Article Text

Abstract
Background We sought to determine whether patients seen in hospitals who had reduced overall emergency department (ED) length of stay (LOS) in the 2 years following the introduction of the Ontario Emergency Room Wait Time Strategy were more likely to experience improvements in other measures of ED quality of care for three important conditions.
Methods Retrospective medical record review using difference-in-differences analysis to compare changes in performance on quality indicators over the 3-year period between 11 Ontario hospitals where the median ED LOS had improved from fiscal year 2008 to 2010 and 13 matched sites where ED LOS was unchanged or worsened. Patients with acute myocardial infarction (AMI), asthma and paediatric and adult upper limb fractures in these hospitals in 2008 and 2010 were evaluated with respect to 18 quality indicators reflecting timeliness and safety/effectiveness of care in the ED. In a secondary analysis, we examined shift-level ED crowding at the time of the patient visit and performance on the quality indicators.
Results Median ED LOS improved by up to 26% (63 min) from 2008 to 2010 in the improved hospitals, and worsened by up to 47% (91 min) in the unimproved sites. We abstracted 4319 and 4498 charts from improved and unimproved hospitals, respectively. Improvement in a hospital's overall median ED LOS from 2008 to 2010 was not associated with a change in any of the other ED quality indicators over the same time period. In our secondary analysis, shift-level crowding was associated only with indicators that reflected timeliness of care. During less crowded shifts, patients with AMI were more likely to be reperfused within target intervals (rate ratio 1.59, 95% CI 1.03 to 2.45), patients with asthma more often received timely administration of steroids (rate ratio 1.88, 95% CI 1.59 to 2.24) and beta-agonists (rate ratio 1.47, 95% CI 1.25 to 1.74), and adult (but not paediatric) patients with fracture were more likely to receive analgesia or splinting within an hour (rate ratio 1.66, 95% CI 1.22 to 2.26).
Conclusions These results suggest that a policy approach that targets only reductions in ED LOS is not associated with broader improvements in selected quality measures. At the same time, there is no evidence that efforts to address crowding have a detrimental effect on quality of care.
- Emergency department
- Health policy
- Performance measures
- Healthcare quality improvement
This is an Open Access article distributed in accordance with the Creative Commons Attribution Non Commercial (CC BY-NC 4.0) license, which permits others to distribute, remix, adapt, build upon this work non-commercially, and license their derivative works on different terms, provided the original work is properly cited and the use is non-commercial. See: http://creativecommons.org/licenses/by-nc/4.0/
Statistics from Altmetric.com
Introduction
Emergency department (ED) crowding and long waiting times are associated with numerous adverse consequences, including a higher risk of mortality,1 ,2 subsequent hospital admission1 and lower levels of patient satisfaction.3 Several studies have demonstrated that ED crowding negatively impacts a number of recognised quality of care measures such as time to antibiotics in adults4–7 and neonates,8 reperfusion for patients with acute myocardial infarction (AMI)9 and pain management.10–12 Potential mechanisms for these effects may include impaired decision-making, unwillingness to order tests or consultations that may take a long time, incomplete examination, insufficient monitoring, incomplete treatment or a lack of discharge planning and follow-up arrangements.1 ,13
One common focus of the healthcare policy response to ED crowding undertaken in a number of jurisdictions, including England in 2001,14 Ontario in 200815 and Australia in 2010,16 has been to target reductions in ED length of stay (LOS). In Ontario, the ER Wait Time Strategy comprised a number of initiatives, including a pay-for-performance programme targeting ED LOS,17 public reporting of ED wait times,18 setting targets for ED LOS18 and an ED process improvement (lean) programme to improve patient flow in hospitals.17 The focus of these efforts was to decrease ED LOS, and there were no explicit efforts to address other quality of care measures. Ontario and England have reported reductions in overall ED LOS and improved performance with respect to ED wait time targets since the implementation of their strategies.19–22 The policy approach is controversial23 ,24 in that a focus on achieving wait time targets may have unintended consequences for other quality of care measures. On the other hand, clinical strategies to improve flow and wait times could also improve other aspects of the quality of care, such as by standardising care protocols. It is unknown whether strategies that achieve reductions in overall ED LOS will impact other measures of ED quality of care.
This study sought to determine whether reductions in ED LOS following the introduction of the Ontario ER Wait Time Strategy in 2008 also resulted in improvements in other measures of ED quality of care. Given the focus of the strategy on reductions in ED LOS, we believed that any improvements in quality of care would largely be restricted to time-sensitive measures, and may not have extended to all quality measures. Because there is stronger and more consistent evidence for the effects of ED crowding on timeliness of care,4–6 ,9 ,10 ,12 ,25–28 our prespecified hypothesis was that in hospitals that achieved overall reductions in median ED LOS, other measures of ED quality of care related to timeliness of care would also improve (eg, time to medication/intervention) compared with hospitals that did not. On the other hand, we believed that measures related to safety and effectiveness (eg, appropriate use of a diagnostic test or appropriate discharge prescription) would remain unchanged.
We also wondered whether, regardless of overall performance on waiting times over the study period, patients seen during times of crowding would experience similar changes in quality measures compared with those seen at other times. Therefore, our secondary hypothesis was that a similar association would be seen between local shift-level crowding conditions at the time of the ED visit and the timeliness and safety/effectiveness quality of care measures.
Methods
Setting and participants
We conducted a retrospective medical record review of unplanned ED visits in Ontario over two fiscal years from 1 April 2008 to 31 March 2009 and from 1 April 2010 to 31 March 2011. These 2 years were chosen to reflect the beginning and the midpoint of the ER Wait Time Strategy introduced in 2008. We restricted our analysis to EDs with an annual volume of at least 20 000 in fiscal year 2008 because lower-volume EDs tend not to have prolonged wait times. Twenty-four EDs were selected based on whether their ED LOS had improved over the study period as described in the Exposures section below.
In Ontario, all ED visits are mandated to be captured through the National Ambulatory Care Reporting System database (NACRS)29–32 and all hospital admissions through the Discharge Abstract Database (DAD).33 ,34 NACRS was used to identify patients who presented to the selected EDs during the study period with any one of the following main problems: high acuity asthma (ICD-10-CA codes beginning with J45 or J46 with a Canadian Triage and Acuity Scale35 (CTAS) score of 1, 2 or 3) among patients aged 2–55 years or shoulder/upper arm/forearm fracture (ICD-10-CA codes beginning with S42 or S52) in adults (aged 18–65 years) and children (aged 2–17 years) where the mechanism of injury was a fall (ICD-10-CA codes beginning with W0 and W1). ED visits resulting in admission for AMI among those aged 20–100 were identified using the Ontario Myocardial Infarction Database, an administrative database based on the DAD of patients discharged from an acute care hospital with a most responsible diagnosis of AMI;36 ,37 these records were subsequently linked to the associated ED records in NACRS. In data quality studies, agreement has been reported as 78% for main problem in NACRS29 and 82% for most responsible diagnosis in the DAD;38 these fields are mandatory in these databases. These conditions were chosen given that at least one evidence-based quality of care measure existed for each one (representing both timeliness and safety/effectiveness),39 and they reflect both high acuity (AMI, asthma) and low-moderate acuity (fractures) conditions and higher (AMI) and lower (asthma, fracture) likelihood of hospitalisation. In addition, an association between ED crowding and poorer quality of care has been observed in previous studies for each of these conditions. Many of these conditions and the related indicators were chosen based on a national consensus of indicators of quality and patient safety in the ED39 and a structured panel process that identified quality of ED care for children.40 We selected a random sample of each condition within each ED and time period.
An electronic case report form tool along with a comprehensive chart abstraction manual, including the relevant data dictionaries, were developed, and six nurse abstractors were hired and trained in a 2-day workshop. The nurse abstractors were also trained to read and interpret 12-lead ECGs. Deidentified test charts were provided for training purposes. The health records department at each hospital provided access to both paper and electronic components of the patient records. Data for the assigned cases were abstracted directly onto secured laptop computers. A random selection of 5% of cases assigned to each abstractor underwent independent validation by a second abstractor. Inter-rater reliability analyses showed moderate (0.41–0.60) to good (0.61–0.80) agreement in terms of Cohen's kappa41 for each of the variables tested.
The datasets used in this study were linked using unique encoded identifiers and analysed at the Institute for Clinical Evaluative Sciences.
Exposures
Hospital sites were classified according to the difference in median ED LOS from April to December fiscal year 2010 compared with the same period in fiscal year 2008. This 9-month period reflected the availability of fiscal year 2010 data at the time of site selection. ED LOS was calculated as the time from registration or triage (whichever was earlier) to the time the patient left the ED. Eleven sites were classified as ‘improved’ based on a ≥15% relative and ≥0.5 h absolute reduction in median ED LOS from 2008 to 2010; these hospitals had the greatest improvement in ED LOS among all potentially eligible hospitals. Among remaining hospitals that had experienced increases or no change in median ED LOS from 2008 to 2010, we selected 13 sites (‘non-improved’) that had a baseline median ED LOS within 0.5 h of the range of median ED LOS among improved sites.
The exposure of interest in our secondary hypothesis was shift-level crowding in the ED at the time of patient arrival, measured according to mean ED LOS among all patients presenting at that ED during the same 8 h shift with a similar illness severity based on triage score. This measure has been previously shown to be associated with poor outcomes among patients discharged from the ED.1 All participating EDs used the 5-level CTAS tool, with common training programmes for triage nurses and demonstrated reliability and validity.35 Triage scores were grouped as high acuity (CTAS 1–3 (resuscitation, emergent and urgent)) and low acuity (CTAS 4–5 (less urgent and non-urgent)). Shifts were grouped as daytime (08:01–16:00), evening (16:01–24:00) and night (00:01–8:00). If no similarly triaged patients presented during the shift, ED LOS was calculated among patients in the same CTAS category in the same ED shift during the previous week.
Outcomes
Outcomes were grouped according to dimensions of quality identified by the Institute of Medicine, that is, timeliness (eg, analgesic within 60 min) and safety/effectiveness (eg, receipt of acetylsalicylic acid (ASA)).42 For AMI, we examined administration of ASA, reperfusion (thrombolysis or percutaneous coronary intervention (PCI)) among all non-transferred patients (ST-elevated myocardial infarction (STEMI) and non-STEMI) without contraindications, reperfusion among non-transferred patients with STEMI without contraindications, and timely reperfusion among all patients who received thrombolysis (within 60 min of registration) or PCI (within 90 min). Outcomes among patients with asthma included lung function testing (peak flow, forced expiratory volume (FEV1), spirometry or other unspecified lung function test (excluding oxygen saturation)), no chest X-ray, corticosteroid administration within 60 min of registration, beta-agonist administration within 60 min of registration, prescription of corticosteroids at discharge and provision of discharge instructions. In paediatric and adult fracture cases, we looked at pain assessment, provision of analgesic or splint, provision of analgesic or splint within 60 min of registration and discharge instructions.
Statistical analysis
We calculated descriptive statistics (frequencies and/or percentages, median/IQRs and ranges) comparing improved and non-improved sites with respect to number of charts, teaching status, baseline (fiscal year 2008) ED LOS and time to initial physician assessment, average annual ED volume and both the relative and absolute change in median ED LOS from 2008 to 2010.
Modified Poisson regression models were used to analyse the association of overall improvement in ED LOS and shift-level crowding with each quality of care measure.43 ,44 We used generalised estimating equation models to account for clustering of patient outcomes within EDs.23 The patient was the unit of analysis and separate models were run for each outcome. Each model included a variable to indicate whether the ED visit occurred at an improved site, a variable to identify the time period (2010 vs 2008), and the shift-level crowding measure (grouped as <4 h (low crowding conditions), 4–5 h, 6–7 h and ≥8 h (crowded conditions)). To test the primary hypothesis, we included an interaction term between improvement and time period, which represented the difference-in-differences,45 that is, the difference between the change in the outcome over time in improved sites compared with the change in non-improved sites. To test the secondary hypothesis that reduced shift-level crowding was associated with more timely care, we examined shift-level crowding parameter estimates for the <4 h group (compared with the ≥8 h group) in the same model. As a sensitivity analysis, we ran a separate series of models, excluding the shift-level crowding variable to determine whether the relationship between improvement and quality of care was confounded by local crowding conditions.
We included as covariates in each model patient age group (2–9, 10–17, 18–39, 40–64, 65–74, 75 years and over), sex, weekend/holiday versus weekday, shift, acuity level (CTAS score, grouped as resuscitation/emergent, urgent and less urgent/non-urgent), patient neighbourhood income quintile and community type (rural vs urban) defined based on postal code using census data obtained from Statistics Canada,46 number of ED visits in the past year, hospital teaching status and mean annual ED volume (grouped according to tercile as 24 889–43 331, 45 313–57 214, 58 908–91 664 annual visits). Observations with missing data were included in the models as a separate categorical variable.
Condition-specific covariates included arrival by ambulance, presence of a prehospital 12-lead ECG, presence of STEMI, interventional cardiac facility, cardiac arrest or cardiopulmonary resuscitation performed within 6 h prior to arrival to 10 min after arrival in the ED and presence of chest pain or other symptoms (dyspnoea or shortness of breath; pulmonary oedema; unexplained nausea, vomiting or diaphoresis; back or abdominal pain; unexplained weakness, dizziness, light-headedness or syncope) of AMI, current use of a beta-agonist or a corticosteroid (oral or inhaled) for asthma and closed reduction in the ED for patients with fracture.
This study received ethics approval from the Research Ethics Board at Sunnybrook Health Sciences Centre in Toronto, Canada, and each of the participating hospitals. All analyses were generated using SAS software, V.9.3 of the SAS System for Unix.47
Results
There were 4319 charts abstracted at the 11 improved sites and 4498 at the 13 non-improved sites. Of these, 2646 were AMI, 2729 asthma, 2024 adult fracture and 1418 paediatric fracture records. Improved and non-improved sites were similar with respect to baseline (fiscal year 2008) ED volume, median ED LOS and time to initial physician assessment (table 1). Improved sites had reductions in median ED LOS of up to 63 min (26%), while non-improved sites had increases of up to 91 min (47%).
Characteristics of participating EDs
Patients in sites where reductions in LOS were achieved were generally similar to those in non-improved sites with respect to a number of demographic and clinical characteristics (see online supplementary appendix 1). Shift-level crowding (acuity-specific average ED LOS at the time of patient presentation) was somewhat lower at non-improved sites compared with improved sites for AMI and asthma, but not for shoulder/upper arm/forearm fracture. Among patients with AMI, 53% arrived by ambulance (of these, 48% had a 12-lead ECG in the ambulance), 31% were STEMIs, 43% were treated at a hospital with a cardiac catheterisation lab, 61% presented with chest pain and 66% with other symptoms. Among patients with asthma, 66% were currently taking a beta-agonist, 44% were taking an inhaled or oral corticosteroid, 89% received a beta-agonist in the ED, of which, 34% received three or more doses. Twenty-two per cent of adult fractures and 12% of paediatric fractures underwent a closed reduction in the ED.
Crude outcomes for each indicator according to improvement in ED LOS and fiscal year are shown in tables 2 and 3. For some indicators, performance was good in 2008 and 2010 in both improved and non-improved sites, including AMI reperfusion among eligible STEMI, ASA for AMI, analgesic or splinting for patients with fracture and discharge instructions for patients with fracture. For other indicators, performance was poor, including reperfusion within target for AMI; lung function testing, no chest X-ray and timely administration of medication for asthma and pain assessment and timely provision of analgesic or splinting in patients with fracture. There were few changes over time and little difference between improved and non-improved sites for many indicators. However, for time to analgesic or splinting among both adult and paediatric fractures, performance was better in fiscal year 2010 among improved sites and the same or worse among non-improved sites.
Safety and effectiveness outcomes among study patients in fiscal years 2008 and 2010 according to improvement in ED length of stay
Timeliness outcomes among study patients in fiscal years 2008 and 2010 according to improvement in ED length of stay
In difference-in-differences models comparing the change in outcome performance in EDs that experienced a reduction in median ED LOS from 2008 to 2010 with those that did not, the primary exposure of improvement in median ED LOS over time was not associated with a change in any of the ED quality indicators (figure 1). In sensitivity analyses, excluding the shift-level crowding measure from the models, results were unchanged (data not shown). For the secondary hypothesis, associations between shift-level ED crowding and performance were seen only among indicators that reflected timeliness of care (figure 2). Patients with AMI were more likely to be reperfused within target intervals during periods of less crowding. Among patients with asthma, there was an association between crowding and timeliness of administration of both steroids and beta-agonists. Lower levels of crowding were associated with a greater likelihood of receipt of analgesic or splinting within an hour among adult fractures, but not in paediatric fractures.
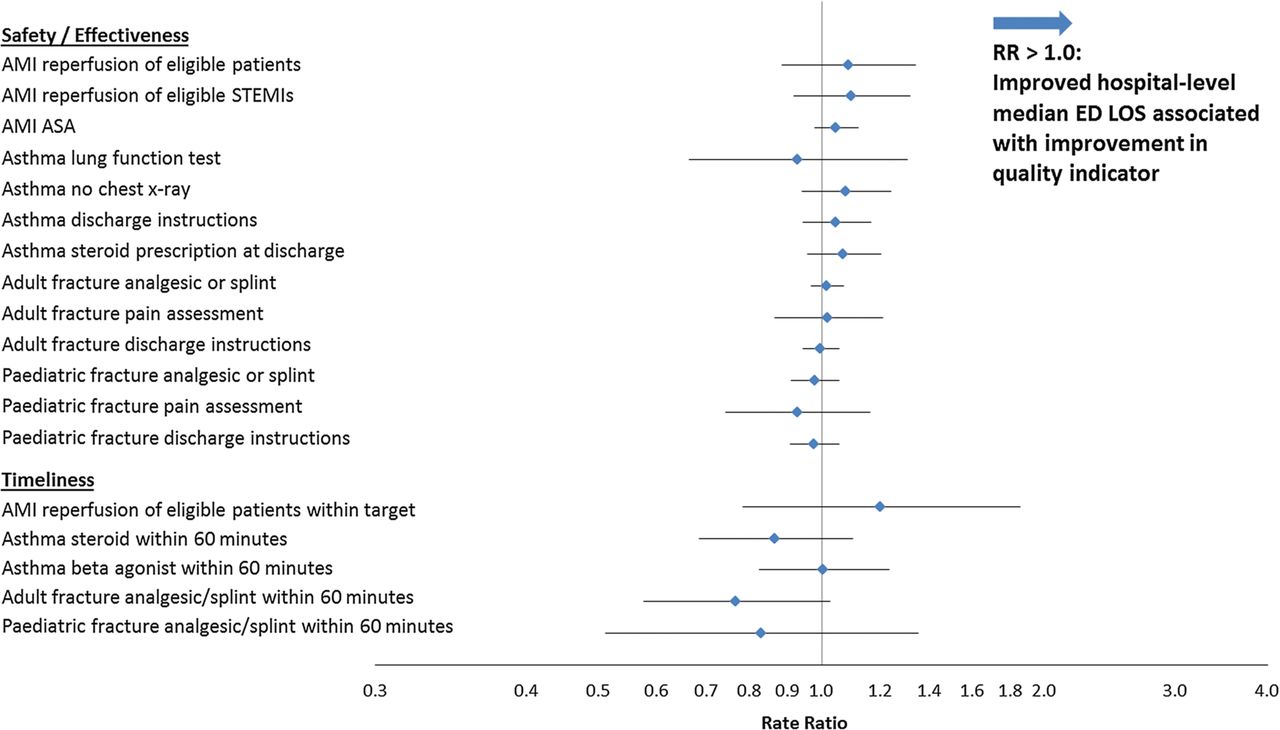
Association between improvement in hospital-level median ED LOS and improvement in other quality of care indicators. The figure depicts the rate ratio (difference-in-differences, computed as a ratio of ratios on the log scale) of better performance on specific quality indicators comparing the change in performance over the study period among hospitals that had improved median ED LOS with the change in performance among hospitals that had not improved. As shown in the figure, none of the quality indicators was associated with shift-level crowding. AMI, acute myocardial infarction; ASA, acetylsalicylic acid; ED, emergency department; LOS, length of stay; STEMI, ST-elevated myocardial infarction.

Association between lower levels of shift-level crowding and quality of care indicators. The figure depicts the rate ratio of performance on specific quality indicators during periods of lower shift-level crowding (defined as the CTAS-specific average ED LOS of <4 h) compared with high shift-level crowding (≥8 h). As shown in the figure, performance on four of the five quality indicators reflecting timeliness was better during periods of lower shift-level crowding. None of the other indicators was associated with shift-level crowding. AMI, acute myocardial infarction; ASA, acetylsalicylic acid; CTAS, Canadian Triage and Acuity Scale; ED, emergency department; LOS, length of stay; STEMI, ST-elevated myocardial infarction.
Discussion
In this study of Ontario EDs, we compared the change in performance on quality indicators for patients with AMI, asthma and fracture in EDs that had improved their overall LOS over the study period with those that had not. Performance on quality indicators was similar at baseline among improved and non-improved EDs, but varied considerably depending on the indicator, suggesting there is room to improve performance on these particular indicators. On the other hand, we did not find an association between improvement in overall ED LOS over the study period and change in quality of care, even for measures reflecting timeliness of care. With respect to our secondary hypothesis, we found an association between shift-level ED crowding at the time of patient visit and performance, but only for quality indicators related to the timeliness of care. These findings suggest that strategies to address ED crowding that are aimed at reducing overall ED LOS will not necessarily be associated with improvements in other dimensions of quality of care. At the same time, these strategies do not appear to be associated with any unintended consequences or adverse effects on the measures of quality of care that we assessed.
This medical record review provided access to detailed clinical information from patient charts, linked with administrative data on changes in LOS and crowding within individual EDs. However, several important limitations should be noted. Although this study employed experienced chart abstractors, failure to meet some of the quality benchmarks we chose may have reflected gaps in documentation as well as actual performance. Several of the indicators represented subgroups of the respective conditions, and these analyses were, therefore, based on small numbers. Cases were selected and our crowding measure was derived from administrative data, which is subject to limitations; however, the fields used in this study have previously been found to be reliable.29 ,30 It is also possible that observed reductions in median ED LOS over time among improved sites may not have been substantial enough to effect changes in these indicators. On the other hand, the range of reductions in median ED LOS (from approximately half an hour to an hour) was fairly sizeable. We chose changes in the median to reflect improvement in ED LOS; it is possible that reductions at, for example, the 90th percentile were more strongly associated with quality of care. The measures of quality examined in this study reflect certain highly selected aspects of care for specific groups of patients. Other domains of quality not studied here, such as patient satisfaction, equity and efficiency, are also important.42 ,48 ED crowding is generally associated with lower patient satisfaction49 and physician-to-patient communication.50
To our knowledge, this is the first study to examine the effect of a health policy to reduce overall ED LOS on the performance of other quality of care measures. Many of these measures have been found to be adversely affected by ED crowding in previous studies.4 ,9–11 ,28 ,48 ,51 ,52 With respect to performance on quality of care measures and shift-level crowding, our findings are consistent with a number of other studies. Rates of reperfusion among eligible patients with STEMI were similar or higher.53 The relatively high percentage of patients with asthma who received a chest X-ray and the low frequency of administration of corticosteroids within an hour are also consistent with previous findings.51 ,54 The frequency of pain assessment in this study was generally lower than those found in other studies of paediatric and adult fractures;10 ,52 ,55 however, timeliness of analgesic administration was similar.10 ,52 As in earlier research, crowding was found to be associated with timeliness of care for a number of indicators, including prolonged time to reperfusion in AMI,9 administration of corticosteroids26 ,28 ,51 and beta-agonists28 among patients with asthma and analgesia among patients with fracture.10 ,52 Remarkably, delays in AMI reperfusion persisted despite what we believe to be a growing recognition of the need for timely access to cardiac care and the development of networks to improve quality of AMI care.56 ,57 Unlike others, we did not observe an association between crowding and pain assessment in adult fractures,10 receipt of analgesia in paediatric fractures52 or corticosteroid administration for asthma.28 A similar lack of association was observed in one other study with respect to ED crowding (defined according to ED volume at the time of patient arrival) and corticosteroid administration.51
Not surprisingly, we found that quality of care was more strongly associated with crowding at the time the patient was seen in the ED than with overall improvements in ED LOS over time and only among quality measures of timeliness. The Ontario ER Wait Time Strategy encompasses all patients seeking care in the ED. Modest reductions in overall ED LOS may not have been sufficient to effect clinically important improvements in quality of care for specific groups of patients. More easily recognised conditions or conditions for which care is more standardised (eg, AMI, fractures and asthma) may be less sensitive to deterioration due to crowding. Indeed, crowding would be expected to affect the higher level performance of an ED (eg, accuracy of diagnosis for less well-differentiated, but serious, conditions or prioritising time-sensitive investigations or interventions when faced with diagnostic uncertainty), in part by increasing cognitive load on all members of the care team.13 ,58 However, developing relevant and rigorous quality metrics for such clinical situations is challenging.
Thus, a broader policy or clinical approach to improving the quality of ED care, which formally targets other measures along with ED LOS, is likely required.58 Some of the strategies employed to address crowding, such as implementation of standing orders to expedite patient flow, could potentially lead to increases in inappropriate care; however, there was no deterioration over time in indicators that may have reflected this, such as chest X-ray for asthma. In some cases, there may have been a ceiling effect with respect to improvement. For example, performance on the provision of analgesic/splinting and discharge instructions for patients with fracture was very good at baseline.
Our study adds to numerous others suggesting that crowding in the ED is detrimental to quality of care. However, our results suggest that a policy approach that targets ED LOS, while necessary, may be insufficient to generate broader improvements in quality. At the same time, there is no evidence from this study that efforts to address crowding have a detrimental effect on selected indicators of quality of care. Reducing waiting times remains an important quality goal in the ED, but our results suggest that quality initiatives should also explicitly target improvements in measures of quality of care other than timeliness for greater impact. Although many jurisdictions remain largely focused on wait times,16 ,20 ,59 in some cases, attention has broadened from wait time metrics to a number of more specific processes of care and outcomes to address a broader spectrum of quality (eg, effectiveness, satisfaction and safety).14 ,42 As pressures on the ED continue to grow,60–62 jurisdictions implementing or considering policies to mitigate crowding should ensure they are broad enough to target both ED wait times as well as other important quality of care measures.
Acknowledgments
We wish to acknowledge the invaluable contribution of our chart abstractors in this study, including Nancy Cooper, Wendy Gregory, Meryl McGrath, Leslie Mills and Shahryar Murshed. We also wish to acknowledge the important contributions of Chelsea Hellings, who managed the project and drafted the dataset creation plan, and Xuesong Wang, who conducted the data cleaning activities and preliminary analyses.
References
Supplementary materials
Supplementary Data
This web only file has been produced by the BMJ Publishing Group from an electronic file supplied by the author(s) and has not been edited for content.
- Data supplement 1 - Online supplement
Footnotes
Contributors All authors provided input into the design of the study and interpretation of the data, and gave final approval of the version to be published and agree to be accountable for all aspects of the work in ensuring that questions related to the accuracy or integrity of any part of the work are appropriately investigated and resolved. MJV contributed to the conception and design, analysis of the data, drafting and revising the article, and is the guarantor of the study. TAS contributed to the conception and design, analysis of the data and revising the article. AK contributed to the conception, design, collection of data and revising the article. MLAS and JD contributed to revising the article. AG and BHR contributed to the conception, design and revising the article. MS contributed to the conception, design and drafting and revising the article.
Funding AG is supported by a Canadian Institutes for Health Research (CIHR) Applied Chair in Child Health Policy and Services Research (grant number APR 126377). BHR is supported as a CIHR Tier I Canada Research Chair in Evidence-based Emergency Medicine (grant number 950-222864). MS is supported by a CIHR Applied Chair in Health Services and Policy Research (grant number ACH-190329-52431). This study was funded by the Canadian Foundation for Healthcare Improvement (grant number RC2-1603-06) and supported by the Institute for Clinical Evaluative Sciences (ICES), which is funded by an annual grant from the Ontario Ministry of Health and Long Term Care (MOHLTC). The opinions, results and conclusions reported in this paper are those of the authors, and are independent from the funding sources. No endorsement by ICES or the Ontario MOHLTC is intended or should be inferred. The funding sources had no role in study design; in the collection, analysis and interpretation of data; in the writing of the report or in the decision to submit the article for publication.
Competing interests None.
Ethics approval The study was approved by the Research Ethics Board of Sunnybrook Health Sciences Centre, which provides an annual approval of all research projects using encoded data at the Institute for Clinical Evaluative Sciences.
Provenance and peer review Not commissioned; externally peer reviewed.
Access to data All authors had full access to all statistical reports and tables in the study and can take responsibility for the integrity of the data and the accuracy of the data analysis.
Transparency declaration The guarantor of the study (MV) affirms that the manuscript is an honest, accurate and transparent account of the study being reported and that no important aspects of the study have been omitted.