Article Text

Abstract
Introduction Irish healthcare has undergone extensive change recently with spending cuts and a focus on quality initiatives; however, little is known about adverse event occurrence.
Objective To assess the frequency and nature of adverse events in Irish hospitals.
Methods 1574 (53% women, mean age 54 years) randomly selected adult inpatient admissions from a sample of eight hospitals, stratified by region and size, across the Republic of Ireland in 2009 were reviewed using two-stage (nurse review of patient charts, followed by physician review of triggered charts) retrospective chart review with electronic data capture. Results were weighted to reflect the sampling strategy. The impact on adverse event rate of differing application of international adverse event criteria was also examined.
Results 45% of charts were triggered. The prevalence of adverse events in admissions was 12.2% (95% CI 9.5% to 15.5%), with an incidence of 10.3 events per 100 admissions (95% CI 7.5 to 13.1). Over 70% of events were considered preventable. Two-thirds were rated as having a mild-to-moderate impact on the patient, 9.9% causing permanent impairment and 6.7% contributing to death. A mean of 6.1 added bed days was attributed to events, representing an expenditure of €5550 per event. The adverse event rate varied substantially (8.6%–17.0%) when applying different published adverse event eligibility criteria.
Conclusions This first study of adverse events in Ireland reports similar rates to other countries. In a time of austerity, adverse events in adult inpatients were estimated to cost over €194 million. These results provide important baseline data on the adverse event burden and, alongside web-based chart review, provide an incentive and methodology to monitor future patient-safety initiatives.
- Adverse events, epidemiology and detection
- Patient safety
- Trigger tools
- Chart review methodologies
This is an Open Access article distributed in accordance with the Creative Commons Attribution Non Commercial (CC BY-NC 4.0) license, which permits others to distribute, remix, adapt, build upon this work non-commercially, and license their derivative works on different terms, provided the original work is properly cited and the use is non-commercial. See: http://creativecommons.org/licenses/by-nc/4.0/
Statistics from Altmetric.com
Introduction
Preventable adverse events are an ongoing challenge in healthcare. International studies demonstrate that 3%–17% of admissions are associated with an adverse event (defined as an injury caused by healthcare management resulting in prolonged hospitalisation, disability on discharge or death1).2 ,3 Approximately half of the adverse events are preventable.4
Little is known about adverse events in the Irish healthcare system. Notwithstanding a number of reports into individual incidents,5 ,6 there is no comprehensive national collection of adverse event data, and voluntary reporting captures only a small proportion of events.7 Therefore, recommendations on improving patient safety at a national level are being made on limited information. Additionally, the WHO recommends collecting local data to provide the mandate and commitment for national patient-safety action.8
The aim of the Irish National Adverse Events Study (INAES) was to quantify the frequency and nature of adverse events in acute hospitals in the Republic of Ireland for the first time using an internationally recognised retrospective patient chart review methodology. Previous studies have shown a fivefold difference in adverse event frequency, but these differences are difficult to interpret due to variation in inclusion criteria for eligible events. We therefore also wished to examine how the Irish rate would vary with application of different published adverse event criteria.3 ,9 ,10
Patient data from 2009 were collected as it predated the establishment of the National Clinical Programmes in Ireland in 2010: the programmes aim to improve and standardise the quality of patient care.11 INAES was therefore designed to assess the baseline burden of adverse events and enable future evaluation of the effect of these programmes on patient safety. The INAES also employed web-based electronic data capture which has the potential to make the methodology more accessible for organisations to assess and monitor their patient-safety initiatives.
Methods
To allow international comparison, we based our methods on the Canadian Adverse Events Study which employed a modified protocol of the Harvard Medical Practice Study.1 ,12 Similar protocols have been used in other international adverse event studies.2–4 ,9 ,13–26 This involves a two-stage review of patient charts with nurse reviewers screening for triggers that may identify an adverse event (stage 1), followed by physician reviewers determining the presence of adverse event(s) in trigger positive charts (stage 2).
Definitions
An adverse event was defined as an unintended injury or complication resulting in disability at the time of discharge, prolonged hospital stay or death and that was caused by healthcare management rather than by the underlying disease process.1 Disability was restricted to temporary (lasting up to a year) or permanent impairment of physical function.12 Healthcare management included the actions of individual hospital staff as well as the broader systems and care processes of healthcare, including both acts of omission (failure to diagnose or treat or manage) and acts of commission (incorrect diagnosis or treatment).12
Study sample
The study hospitals were all acute public hospitals in the Republic of Ireland—public hospitals provide approximately 88% of the national acute hospital beds.27 Thirty hospitals listed in the Irish Health Service Executive (HSE) 2012 hospital Casemix annual budget adjustment were invited to participate (this excluded eight hospitals with a sole clinical specialty focus, ie paediatrics, maternity and orthopaedics).28 Casemix is a system which groups patient data to compare activity and costs between hospitals.29
Hospitals were classified as ‘large’ if total annual inpatient, day case and emergency department Casemix units were over 100 000 and/or the hospital hosted a National Cancer Centre (ie, where staff with specialist cancer expertise are concentrated30); with the remainder classified as ‘small’. The approximate number of annual Casemix units (and distribution into inpatient/day case/emergency) for the nine large hospitals was 980 000 (22%/37%/41%), and for the 21 small, it was 860 000 (30%/23%/47%).28 Eighteen hospitals agreed to participate, six refused and six did not reply despite several contacts. The selection process involved random sampling of participating hospitals, stratified by health system (HSE) region and hospital size, to select eight hospitals: one ‘large’ and one ‘small’ from each of the four regions.31
After hospital selection, a random sample of 300–400 admissions (‘index admissions’) for the calendar year 2009 was generated at each site using the hospital's local Hospital Inpatient Enquiry (HIPE) electronic discharge database. HIPE collects demographic, clinical and administrative information on discharges and deaths from acute hospitals in the Republic of Ireland. Discharge diagnoses and procedures are coded using ICD-10 AM/ACHI/ACS 6th edition (International Classification of Diseases 10th revision Australian Modification/Australian Classification Health Interventions/Australian Coding Standards).32
The sampling frame included all inpatient admissions for patients aged at least 18 years who had a minimum stay in hospital of 24 h (or died within 24 h) and excluded admissions with a principal diagnosis related to obstetrics or psychiatry (ICD-10 codes F00–F99 and O29–O92733). Admissions that were recorded in HIPE as being a transfer from another hospital were excluded as the likelihood was that full clinical information from the transferring hospital would not be available. Nurse reviewers conducted a further eligibility check prior to commencing review of each chart to identify ineligible admissions that were not able to be excluded using our HIPE methodology, that is, inpatients who were discharged within 24 h and obstetric admissions resulting in uncomplicated births with non-obstetric principal diagnosis codes. Early pregnancy (<20 weeks) was included in line with the Canadian Adverse Events Study.12
Reviewer training
Six nurse reviewers, each with a minimum of 7 years’ nursing experience and all having experience in clinical research, audit, hospital management and/or education and three physician reviewers (two recently retired respiratory physicians and one public health medicine physician) performed the chart reviews.
Researchers from the Canadian adult and paediatric adverse events studies conducted face-to-face training of the reviewer group over 2½ days.12 ,17 An operations manual containing the study protocol and instructions for the web-based data collection was adapted from the Canadian manual. The Canadian website data entry forms and database were modified for the Irish healthcare setting. The web-based data collection tool captured all study data. It had several advantages—prepopulation of admission demographic data, streamlined data entry (compulsory fields, review of each injury with automatic adverse event determination if the definition was satisfied), enhanced data security (direct download to a secure server), central monitoring of site progress, automatic assignment of reliability charts and direct transfer into statistical software. Structured implicit review assisted physician reviewers to assess causation and preventability with the tool guiding reviewers through a series of questions before they made their judgements.
Reviewers independently reviewed 20 training charts immediately following the group training. These were assessed for inter-rater reliability by calculating the κ statistic (nurse κ=0.16, physician κ=0.52). The low κ for the nurses was due to a subset of nurses being oversensitive and triggering nearly all of the charts. The training charts were discussed in the reviewer groups before beginning data collection. The nurses had support on their initial 10 study charts. A 10% sample of patient charts was rereviewed by all nurse or physician reviewers at each site. The κ statistics in the field improved to nurses 0.79 (95% CI 0.68 to 0.88) and physicians 0.59 (95% CI 0.37 to 0.79).
A sample of trigger-negative charts at each site was also reviewed by a physician reviewer for adverse events as part of a sensitivity analysis of the stage 1 trigger methodology. The sensitivity and specificity were calculated as 96% and 64% respectively, with a 1.0% (95% CI 0.1% to 3.7%) prevalence of adverse events in missed charts (2/196 trigger-negative charts contained events).
Data collection
Patient charts were reviewed between December 2013 and January 2015. Stage 1 involved nurse review of each chart using a list of 18 ‘triggers’ (eg, unplanned readmission, hospital-acquired infection, adverse drug reaction; online supplementary appendix 1). Chart reviews centred on the index admission and all documentation 1 year before and after. The majority of patient charts were paper based or scanned paper records. In some sites, reports or correspondence were available electronically but these tended to duplicate documents included in the paper chart. There was no limit on time taken to review charts.
Stage 2 involved physician review of triggered charts to determine whether an adverse event had occurred. One physician reviewed each chart. Adverse events, which occurred within 12 months before, or during, the index admission, which were detected either during the index admission or within 12 months afterwards, were included. The physician reviewer rated the impact of the event, the likelihood that it was caused by healthcare management and its degree of preventability using standard scales (see online supplementary appendix 2). For each event, the physician classified its nature (ie, whether it was related to diagnosis or other clinical management, an operation or non-surgical procedure, a fracture, an anaesthetic, administration of fluids or medication, pregnancy and/or another type of event) and whether a system issue was involved (ie, if failures within the healthcare system contributed to the event). A consultant surgeon was available for advice on surgical cases.
Demographic and administrative data on the index admissions (age, sex, discharge diagnoses and procedures, consultant specialty code, admission and discharge dates) were collected at the time of random selection at each site. National demographic data for equivalent adult inpatients in acute public hospitals during 2009 was provided by the Healthcare Pricing Office and generated using the same HIPE search strategy as employed in the INAES sampling (see online supplementary appendix 3).34
Analysis
Power calculation
A sample size of 1500 admissions was calculated using a 20% rate of adverse events and ±2% precision (with precision improving at lower rates).3 This allowed a precision of ±5% in any subgroup constituting 20% or more of the total sample. Thus, at least 187 eligible admissions were required to be reviewed at each hospital.
Weighting and analyses
The risk (period prevalence) of adverse events in inpatient hospital admissions was calculated as the proportion of admissions associated with one or more adverse events.12 The incidence density was calculated as the number of adverse events occurring per 100 admissions, excluding events occurring prior to the index admission (to avoid double counting). CIs for binary variables were modelled using logistic regression; CIs for incidence were calculated using Poisson regression with robust variance estimation to account for overdispersion; p values were derived from logistic regression, unless otherwise noted. To maximise the number of adverse events reviewed, the sample was stratified such that half of admissions had undergone a surgical procedure (without stratification, this figure was approximately one quarter34). The procedure codes for general anaesthetic, regional and neuroaxial blocks (ACHI 9251400–9251499, 9250800–9251299) were used as proxies to indicate that surgery was likely to have been performed during the admission. Analyses were weighted for this sampling frame (ie, the ratio of admissions with and without the anaesthetic procedure codes in each hospital's eligible study population). Inter-rater reviewer reliability was analysed using Cohen's κ, with CIs calculated using a bootstrap method implemented in the user-written command kapci.35 All analyses were performed using Stata release 13.1.
The national cost of adverse events in adult inpatients was estimated as the product of (1) the estimated number of adverse events—using the INAES incidence density of adverse events applied to the number of adult inpatient admissions to acute public hospitals in 2009, excluding those with obstetric and psychiatric principal diagnoses (n=339,84434); and (2) the average cost of an event—calculated as the INAES mean number of added bed days attributed to adverse events multiplied by the average cost of an inpatient hospital bed in Ireland in 2009 (€909 per day36).
Results
A total of 2600 admissions were randomly selected from the hospitals’ HIPE discharge databases. Oversampling was performed to account for missing charts or ineligible admissions. Hospitals were advised to retrieve charts in batches from the top of the randomly generated list. Nurse reviewers were asked to review a target of 190–200 eligible charts at each site, reviewing the top 200 charts first and using the oversample as backup. A total of 1854 charts were screened for eligibility by the nurse reviewers and 1609 (87%) were eligible for the study (figure 1). The majority of ineligible admissions had a hospital stay of under 24 h. After excluding charts with inadequate documentation, 1580 admissions underwent a full stage-1 review (188–201 admissions per hospital), of which 6 were excluded by physician reviewers leaving a total of 1574 fully reviewed charts (figure 1).
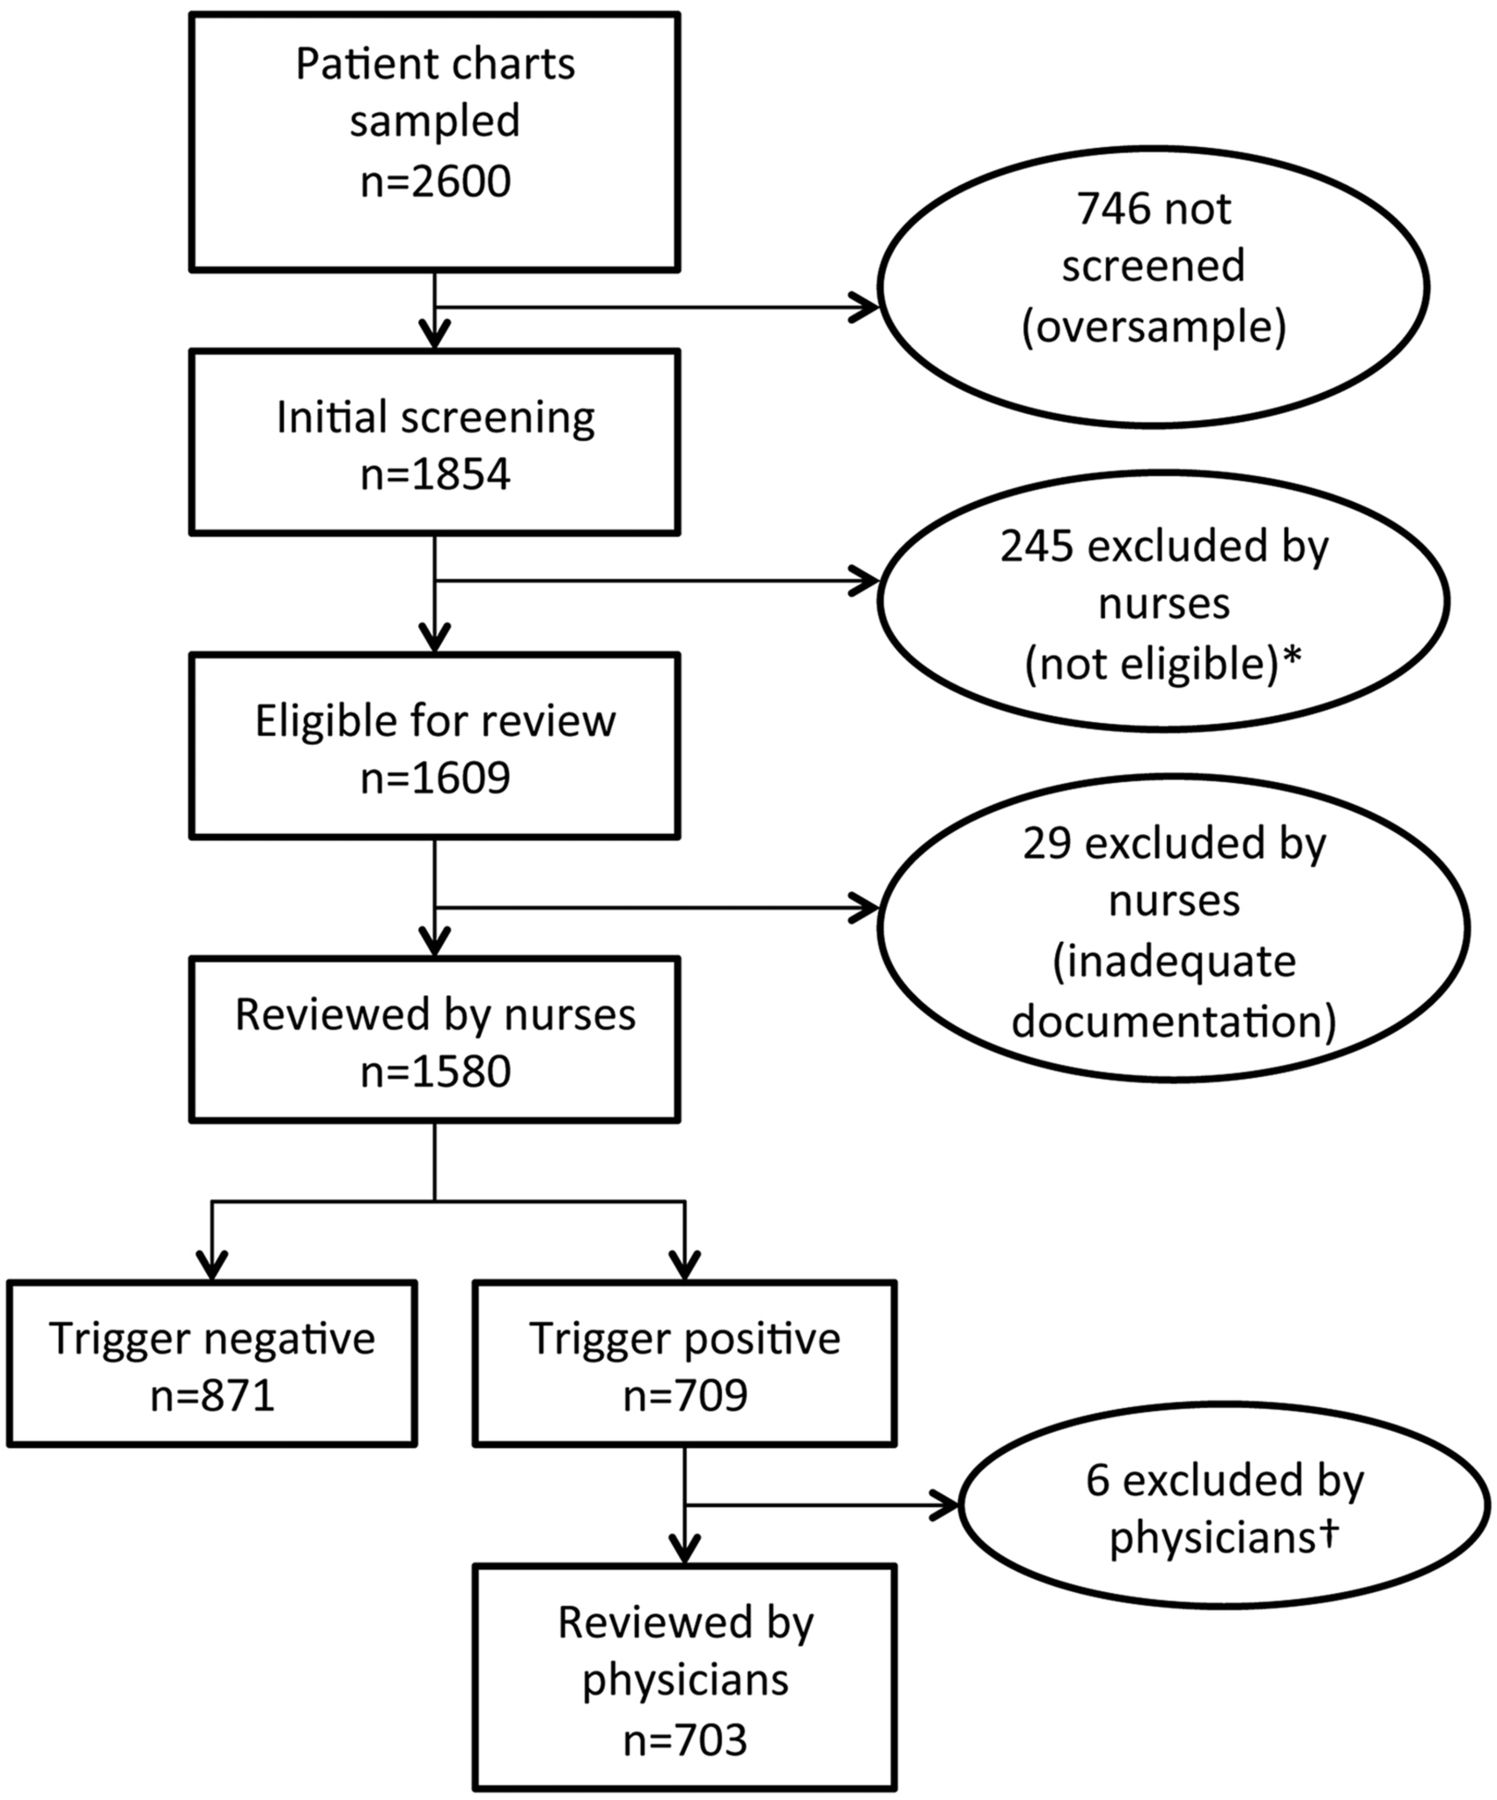
Flow chart of the INAES chart review process. INAES, Irish National Adverse Events Study. *<24 hours (n=216), uncomplicated birth (n=25), transfer (n=2), not admitted (n=1), under 18 years old (n=1). †<24 hours (n=1), uncomplicated birth (n=1), transfer (n=3), unable to locate (n=1).
The reviewed charts were comparable with national acute public hospital admissions in 2009 for age, sex and length of stay (see online supplementary appendix 3). However, a lower proportion of the national admissions compared with the INAES sample died during the admission (2.7% vs 4.8%, respectively). This is likely due to INAES excluding admissions with a hospital stay under 24 h unless the patient died, whereas the national figure includes all short-duration admissions.
A total of 45% of charts reviewed in stage 1 were trigger positive. The triggers of hospital-acquired infection, unplanned return to the operating theatre and unplanned removal/injury during surgery had the highest relative risks for subsequent adverse event determination (5.3, 4.8, 4.7, respectively; online supplementary appendix 1).
In stage 2, physician reviewers identified 247 adverse events in 211 admissions, including 15% with more than one event (see case descriptions in online supplementary appendix 4). Most (72.4%, weighted) of the adverse events occurred during the index admission (table 1). Approximately a quarter of events (23.5%) were detected after the index admission, and in 27.7%, the event occurred prior to the index admission.
The weighted distribution of adverse events by the timing of occurrence and detection
The overall adverse event prevalence (ie, the proportion of admissions associated with one or more adverse events) was 12.2% (95% CI 9.5% to 15.5%) after weighting for the sample frame. The weighted incidence density was 10.3 adverse events per 100 admissions (95% Poisson CI 7.5 to 13.1). The mean age of patients was significantly higher among admissions with an adverse event than those without (61.8 years vs 55.4 years; p<0.001 (t test)), and with each 10-year age increment, there was an 18% increase in risk of an adverse event (OR 1.18, 95% CI 1.09 to 1.27). There was no difference in risk between women and men (p=0.683).
Of the 247 adverse events, 179 (72.5%) were judged to be preventable (see online supplementary appendix 2). When these results were adjusted for the sampling strategy, 72.7% (95% CI 58.8% to 83.3%) of events were deemed preventable (table 2), including 74.6% (95% CI 60.2% to 85.1%) of the 187 events occurring during the index admission. There was no difference between large and small hospitals in risk of an adverse event (p=0.918) or in the proportion rated as preventable (p=0.254).
Adverse event frequency, by hospital type
Two-thirds (67.6%, weighted) of adverse events resulted in no physical impairment or disability at discharge or in minimal-to-moderate impairment with recovery within 6 months (see online supplementary appendix 2). Nonetheless, 9.9% of the adverse events resulted in permanent disability, and 6.7% (occurring in 14 patients) were judged to have contributed to the patient's death (see online supplementary appendix 2). There was no significant difference in risk of death in admissions that had adverse events compared with admissions without events (p=0.331).
Patients who experienced adverse events had a median length of index admission of 7 days (IQR 3, 17) compared with four days (IQR 2, 8) without adverse events (p<0.001, Wilcoxon–Mann–Whitney). Physician reviewers judged events occurring in the index admission to result in a mean of 6.1 (95% CI 4.8 to 7.7) additional hospital days in that admission or readmission(s). This represents an additional cost of approximately €5550 for each adverse-event-associated admission, which when extrapolated nationally gives an estimated annual cost of hospital-based adverse events to the Irish healthcare system of €194 million.
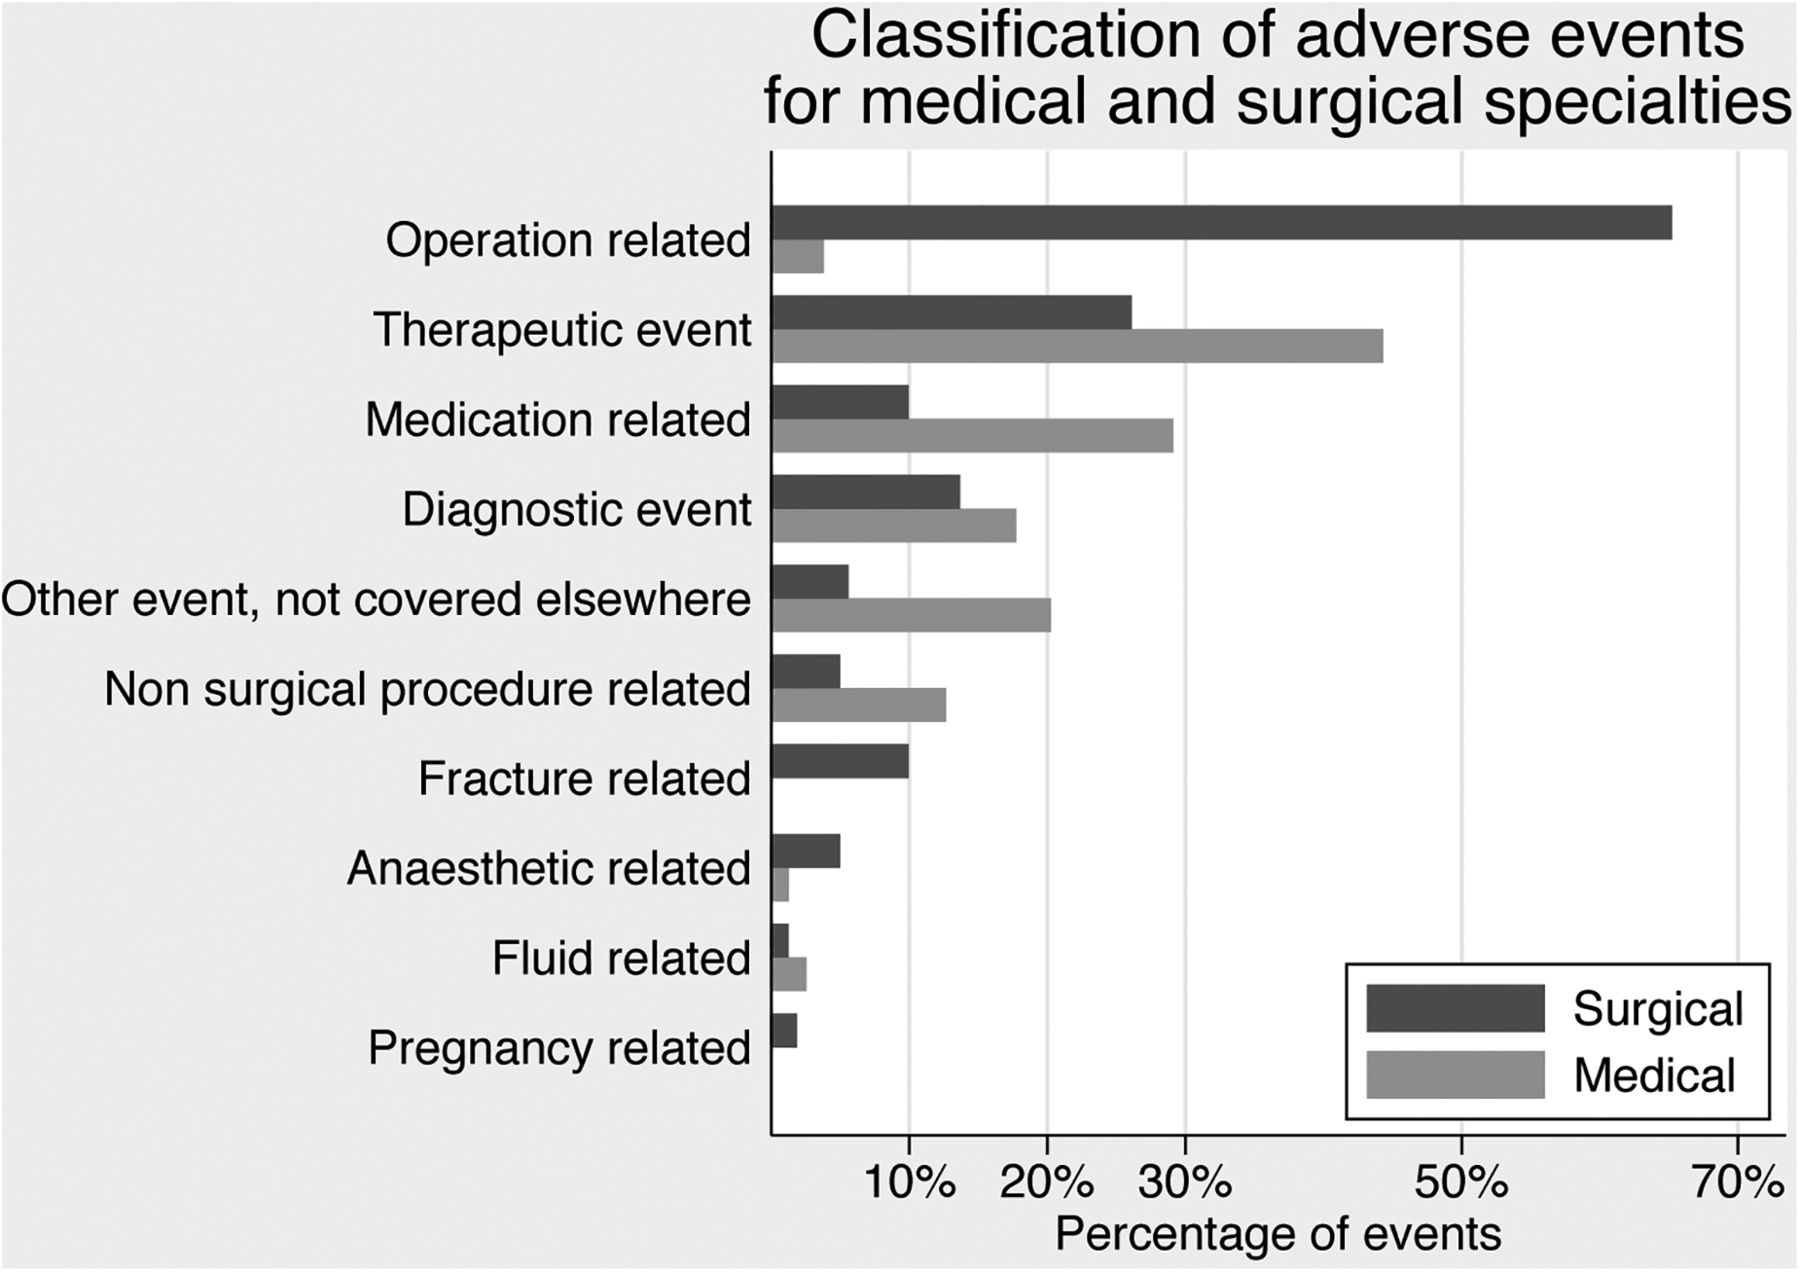
Adverse event risk was higher in admissions with anaesthetic procedure codes indicating a surgical procedure was likely to have occurred, than in admissions without these codes (17.9% (95% CI 13.5% to 22.3%) versus 10.2% (95% CI 7.2% to 13.1%)). However, when the 1499 admissions with medical or surgical consultant speciality codes were compared, there was no difference in event frequency between the specialities: medical-weighted prevalence 11.9% (95% CI 8.3% to 15.5%), surgical 13.1% (95% CI 9.8% to 16.5%). The type of adverse event varied by speciality, with surgical specialities having a greater proportion of operation-related events (occurring during surgery or within 30 days postoperatively), whereas therapeutic events (inappropriate or delay in treatment or failure to monitor) and medication-related events were the dominant categories for medical specialities (figure 2). When operation-related events were removed, the distribution of remaining event types was similar in medical and surgical specialties (see online supplementary appendix 5). A system issue was identified in 106 events (weighted proportion 46.1% (95% CI 31.5% to 61.4%)). Overall, adverse events resulting from errors of omission were as common as those resulting from errors of commission (data not shown), with no significant difference between medical and surgical specialties (p=0.627).

Frequency of adverse event types for medical and surgical specialties.
Adverse event prevalence varied significantly if different criteria were used to identify the events (table 3). For example, exclusion of events occurring in the index admission and discovered subsequently reduced the weighted risk to 9.4% (95% CI 7.4% to 11.9%).1 ,9 Similarly exclusion of events prior to the index admission resulted in a risk of 8.6% (95% CI 6.7% to 10.9%).19 If events caused by healthcare management outside the index hospital were included (eg, occurring in general practice, nursing homes or other healthcare facilities), then the weighted prevalence rose to 14.6% (95% CI 11.6% to 18.3%).22 Furthermore, using a lower threshold to determine likelihood of causation by healthcare management (a score of ≥2, online supplementary appendix 2) increased the prevalence to 14.5% (95% CI 11.3% to 18.4%),21 and if events caused by healthcare management outside the index hospital were also included, this became 17.0% (95% CI 13.4% to 21.3%).3
Weighted occurrence of Irish National Adverse Events Study (INAES) adverse events with the application of international adverse event eligibility criteria
Discussion
This is the first national study to report adverse event prevalence in the Republic of Ireland. The major strengths of this research are its standardised methodology and the ability to compare with international studies that have used this method but different adverse event eligibility criteria. Our adverse event prevalence of 12.2% and incidence of 10.3 events per 100 admissions fall at the upper end of the range of other international studies (3%–17%).3 ,9 At a national level, this extrapolates to 41 000 admissions associated with one or more adverse events out of approximately 340 000 similar admissions to Irish acute public hospitals in 2009.
In contrast, adverse events were reported in only 1.9% of patient contacts in 2011 to the National Incident Management System (NIMS).37 ,38 While not directly comparable (NIMS includes near-misses and community settings), there appears to be significant under-reporting of adverse events in the Irish healthcare system, similar to other research.7 ,23 Reasons for this include lack of awareness or belief in the value of reporting, fear of litigation and lack of a supportive culture encouraging reporting.39 ,40
The leading categories of events by frequency in INAES were similar to other studies: operation related, therapeutic, medication related and diagnostic.9 ,12 ,13 Additional analyses will be needed to delineate the nature of events within these categories for prioritisation of future patient-safety initiatives. Unlike the Canadian study, we did not find a difference with hospital size; however, hospital categorisation differs between studies and necessarily relates to local demographic and health service factors.12 Over 70% of INAES adverse events were considered preventable. This appears high (compared with a previous systematic review aggregate estimate of 43.5%4) but preventability is likely to increase over time with advances in surgical techniques, therapeutics, quality initiatives and increased availability of documentation with electronic clinical notes;41 more recent studies have reported similar rates.16 ,18 ,22 Furthermore, judgement of preventability can only be based on available documentation and will be influenced by reviewers’ experience and knowledge.42 ,43 In line with other research, undergoing a surgical procedure was associated with a greater risk of an adverse event.4 However, this finding was not true for the surgical specialities overall. This is probably because a quarter of admissions coded with a surgical speciality (ie, under the care of a surgical consultant for their principal diagnosis) did not appear to have had surgery (judged by the absence of a procedure code for an anaesthetic) while approximately 5% of those with a medical code underwent surgery.
Comparison of published adverse event rates is problematic. Results from international studies conducted over a 30-year period present the burden of adverse events at one point in time and may not reflect current practices or quality and patient-safety improvements in that healthcare system. In addition to differences in setting, these studies differed by eligible population, threshold for causation by healthcare management, extent of documentation reviewed and the timing and location of events relative to the index admission. For example, some studies included paediatric and all obstetric patients and had no length-of-stay eligibility criteria,1 ,9 ,13 some had a lower threshold for causation,3 while others did not include events that were discovered before, or after, the index admission.1 ,9 ,19 When our data were recalculated by applying different adverse event criteria, the INAES prevalence varied from 8.6% to 17.0% (representing a 30% decrease to a 40% increase when compared with the main result of 12.2%). This highlights the challenges inherent in measuring and comparing adverse events. Current variation in methodology and definitions, as well as setting and year, make it difficult to assess whether there are intrinsic differences in adverse event occurrence between healthcare systems.44
The cost of adverse events is significant in terms of adverse outcomes for patients and the trauma and consequences for all involved—patients, families and staff.45 Financially, an annual cost of €194 million represents approximately 4% of the Irish healthcare acute services 2009 budget.46 This is an underestimate as it does not take into account costs such as escalation of care and litigation. Furthermore, day cases, emergency department assessments, paediatric and the majority of obstetric and psychiatric admissions were not included in our study.
Study limitations
Not all invited hospitals agreed to participate. However, the INAES included large and small hospitals from across the country and was comparable with national demographic data. Our estimate may not have captured all adverse events. For example, the two-stage methodology means that not all charts undergo physician review. However, our trigger screening sensitivity analysis indicates that the adverse event rate would only result in a relative 4% increase (to 12.7%) if physicians had reviewed all charts. Events detected in the index admission that occurred over a year beforehand (estimated to contribute 10% of all events3), and events from the index admission that were detected after a year are not included. In addition, retrospective chart review is restricted to chart documentation without direct information from staff involved in patient care. Our reviewers commented that there was significant variability across hospitals in terms of filing practices, recording of information (extent of documentation, handwritten or typed), layout of drug charts, presence of discharge summaries and availability of investigation results. Furthermore, studies comparing prospective and retrospective methodologies have found that although these methods identify similar rates of events, they do not necessarily identify the same adverse events.47
In addition, chart review relies on consistency between reviewers, in order for physicians to agree that an adverse event has occurred, all three elements of the definition (injury, resulting disability at discharge/prolonged hospitalisation/ death and causation) must concur. Our κ statistic of 0.59 for physicians is in line with other studies, where κs have ranged from 0.25 to 0.78.15 ,19 This need for reviewer consistency across elements of the adverse event definition highlights the problem of rater reliability in detecting adverse events. To enhance reviewer consistency, INAES employed standardised training and structured implicit review, with the data collection tool guiding physicians to informed professional judgements.
Irish healthcare has undergone extensive change due to the economic recession and the growth of the quality movement, including the National Clinical Programmes. Therefore, our study of adverse events in 2009, near the start of these dual influences, provides an important baseline and the opportunity to link safety with subsequent organisational reform.11 However, while our results describe the burden of adverse events, the retrospective methodology may be viewed as a blunt instrument for monitoring specific quality initiatives, as adverse events are a heterogeneous group.48 A reduction in one category may be counterbalanced by an increase in others, leading to no overall change in adverse event rates. Thus, interventions to reduce adverse events need to be targeted at specific adverse event categories, and studies monitoring effects tailored accordingly.41 ,48
The INAES web-based tool is now available for use in Irish hospitals, providing an electronic application for chart review that will allow hospitals to conduct their own reviews and monitor patient-safety initiatives. The results from these reviews will be directly comparable with the INAES results. Furthermore, other national studies have spearheaded the development of national patient-safety organisations and policy, and we anticipate that this study will further support patient-safety initiatives in the Irish healthcare setting.1 ,12–14
Conclusion
INAES provides the first estimate of adverse event occurrence within the Irish healthcare system and an important measure of the burden and impact of these events. Our results give an overview of the types of patient-safety issues that will help guide future interventions to reduce specific adverse events and improve safety. We found a significant discrepancy between our rate of adverse events and that reported to the national reporting scheme. Therefore, efforts must be made to encourage a ‘reporting culture’. From an international perspective, this most recent large-scale retrospective chart review national study shows broad consistency yet again in the frequency and nature of adverse events. Patient-safety experts should question why, after 30 years, there has been so little evidence of overall improvement.
Acknowledgments
We gratefully acknowledge the support and assistance provided by the eight participating hospital sites, especially their managerial and administrative staff who facilitated the environment and chart access for the study. We are extremely grateful for the hard work of our nurse and physician reviewers. We thank Professor Ross Baker, Virginia Flintoft and Dr Anne Matlow at the University of Toronto for their training and advice. Thank you also to Dr Áine Carroll, Dr Philip Crowley, Dr Barry White, Dr Ann Coughlan, Sarah Kennedy, Dr Lucia Prihodova, our surgeon advisor, and the members of the INAES advisory group.
References
Supplementary materials
Supplementary Data
This web only file has been produced by the BMJ Publishing Group from an electronic file supplied by the author(s) and has not been edited for content.
- Data supplement 1 - Online appendix 1
- Data supplement 2 - Online appendix 2
- Data supplement 3 - Online appendix 3
- Data supplement 4 - Online appendix 4
- Data supplement 5 - Online appendix 5
Footnotes
Contributors NR: design, acquisition of data, analysis and interpretation of the data and drafting of the manuscript. DW and AH: design, reviewed analysis and interpretation of the data and critical revision of drafted manuscript. RMC: design, analysis and interpretation of the data and critical revision of drafted manuscript. SC: design, acquisition of data, interpretation of data and critical revision of drafted manuscript. GW, POC and DV: design, interpretation of data and critical revision of drafted manuscript. All authors approved the final version of the article.
Funding Health Research Board (RCQPS/2013/1), Health Service Executive.
Competing interests None declared.
Ethics approval Ethical approval was obtained from the research ethics committees of the Royal College of Surgeons in Ireland (REC815) and the Royal College of Physicians of Ireland (RCPI RECSAF 04).
Provenance and peer review Not commissioned; externally peer reviewed.