Article Text

Statistics from Altmetric.com
Introduction
Fidelity is the degree to which a change is implemented as intended. Improvement project teams should measure fidelity, because if the change is not implemented, nothing will change. However, measurement resources are usually limited, especially in the early stages of implementation. A frequent problem in quality improvement is that people waste time collecting too much data. A previous paper1 showed how to demonstrate local gaps in care with very small samples of 5–10 patients. In evaluative clinical trials, the goal is to detect small differences between groups with precise estimates of these differences. By contrast, local quality improvement is often asking whether local performance meets a specific standard, such as 80% compliance with a guideline. If local performance is poor, small samples of 5–10 patients may be large enough to demonstrate a gap in care. In this paper, our goal is to offer some general guidelines to measuring fidelity of implementation on small samples in the face of constrained measurement resources.
Our target audience is healthcare improvers who have:
Identified a local gap in care.
Analysed the causes of this gap.
Developed a change theory to address the gap.
Created an initial change concept to be tested and refined locally.
A hypothetical scenario
A hospital-based improvement team is focused on medication reconciliation. Medication reconciliation refers to efforts to avoid unintentional changes to medication regimens at transition points such as hospital admission and discharge.2 The team has conducted several small audits showing important gaps in the local system of medication reconciliation. The team has designed a new medication reconciliation form and is keen to start Plan-Do-Study-Act (PDSA) rapid improvement cycles. The hospital director wants the new medication reconciliation form implemented broadly as soon as possible. One member of the team wonders about conducting a randomised controlled trial of the new form. The team has about four person-hours per week to devote to the project. The team is unsure how to use their measurement resources to the best effect.
Why is it important to measure fidelity of implementation?
We suggest four reasons to measure fidelity of implementation. The obvious reason is that if changes are not implemented, nothing changes. Fidelity is analogous to treatment adherence in controlled clinical trials. Ensuring excellent adherence is a major focus during clinical trials, because clinical trials tend to be negative if participants do not take the treatment. In the Diabetes Control and Complications Trial, 97% of patients adhered to a very tight regimen of insulin, likely because of very careful attention to adherence issues in a detailed feasibility study.3
Second, successful early implementation usually involves a committed local opinion leader, working with convenience samples of enthusiastic early adopters. Broader implementation and dissemination, in the absence of committed leaders and enthusiastic adopters, may not necessarily be so successful. Monitoring fidelity allows for timely detection of implementation problems as the project moves from ideal early conditions to broader dissemination.
Third, it is important to optimise fidelity of implementation prior to undertaking evaluative studies. Low fidelity of implementation leads to smaller effect sizes, which means that a larger sample is needed to detect the effects of the change (table 1). Suppose that the estimated sample size to detect an effect is 100 patients. This sample estimate assumes that the fidelity of implementation is 100%. If the fidelity of implementation is only 70%, then the required sample size to detect the same effect doubles to 204.4 5 If the fidelity of implementation is 70%, and only 100 patients are enrolled, then the study will yield a negative result. The corollary is that small improvements in fidelity can reduce the required sample size and increase the chance of demonstrating an effect. Improving the fidelity of implementation from 70% to 80% reduces the required sample size from 204 to 156.
Finally, a measure of fidelity of implementation is needed to interpret the result of an evaluative study. Suppose an evaluative study has a negative result. One possibility is that an ineffective change was correctly implemented. Another possibility is that a potentially effective change was not adequately implemented. A measure of fidelity will help determine which possibility is most likely.6
We assume that resources for measuring fidelity are constrained. We assume that if the local improvement efforts are initially successful, there may be efforts made to obtain additional resources for further dissemination and evaluation. Therefore, there should be enough data from the initial phase to support and inform further dissemination and evaluation. We focus on quantitative measurement, but we emphasise that qualitative measurement is important. Quantitative fidelity measures inform whether a change was implemented, but qualitative data inform why the change was, or was not, implemented.
Measuring fidelity of implementation
We suggest five steps:
Choose fidelity measures based on a change theory.
Establish a minimum acceptable fidelity for each measure.
Establish a sampling strategy.
Choose a practical sample size.
Create run charts.
Choose fidelity measures based on a change theory
Change efforts should be based on a change theory that describes how each element of the change is expected to lead to improved processes and outcomes. A sound change theory makes it easier to choose fidelity measures. The initial steps of the change theory are logical places for fidelity measurement.
The initial fidelity measures can be rudimentary signals that change is occurring during early PDSA cycles. These initial measures can be considered PDSA-level fidelity measures. More robust fidelity measures should give confidence that the change has been implemented as intended, based on the change theory. Robust fidelity measures can subsequently be used as project-level fidelity measures during broader dissemination or evaluation. Interventions are often multifaceted, in which case a group of fidelity measures is appropriate.
The medication reconciliation team’s change theory includes the following:
Clinicians will complete a form that outlines the patient’s home medications and the plan for each medication (continue, change, stop) at the time of admission.
The form will be placed on the patient’s chart.
This form will lead to fewer medication errors during the hospitalisation.
Fewer medication errors will lead to fewer preventable adverse drug events during the hospitalisation.
The project team considers the rudimentary (‘PDSA level’) fidelity measure of ‘form is found on the patient’s chart’. (If the form is not on the patient’s chart, nothing is changing!) The project team recognises that the appearance of the form on the chart is insufficient evidence the change has been implemented as intended. The project team decides that ‘forms correctly completed’ is a more robust fidelity measure that could ultimately be a project-level fidelity measure. The team is willing to commit a little extra effort to measure ‘forms correctly completed’. The project team supplements the fidelity measurement with qualitative feedback from users: What did the user like about the form? What could be improved? Why didn’t the user complete the form?
Establish a minimum acceptable fidelity
We suggest a minimum acceptable fidelity of 70%. If fidelity is less than 70%, then the effect of any change will be attenuated, broader dissemination will be difficult to achieve, and the required sample size for evaluation may become prohibitively large (table 1). If fidelity is less than 70%, then a reasonable next step is to identify and ameliorate barriers to implementation, with ongoing monitoring of fidelity.7 Our suggestion of a minimum acceptable fidelity of 70% is arbitrary. We are unaware of a ‘correct’ minimum fidelity value. A lower fidelity might be acceptable for changes that are simple, inexpensive and for which formal evaluation is not planned.
Impact of fidelity of implementation on required sample size for an evaluative study
Establish a sampling strategy
The following are the two useful guiding principles for sampling in improvement projects, as previously outlined by Perla et al8:
obtain just enough data to guide next steps
make full use of local subject matter expertise in selecting the most appropriate samples.
In the early stages we suggest small convenience samples to test and refine the change. These convenience samples could include enthusiastic early adopters in ideal conditions. We propose a first arbitrary milestone of two consecutive convenience samples above minimum acceptable fidelity. If this simple milestone cannot be reached, broader dissemination is unlikely to be successful. The change should be refined or abandoned. After reaching this first milestone, we suggest moving to purposive (or judgement) samples that are more reflective of typical system performance. Purposive sampling can draw on local expert knowledge to ensure that implementation is tested more broadly, including situations when implementation can be expected to be difficult. We propose a second arbitrary milestone of two consecutive purposive samples above minimum acceptable fidelity.
As discussed in the prior paper on small sample sizes,1 data quality is important on small samples. The five important steps to data quality are to (1) define the eligible sample, (2) establish exclusion criteria, (3) state the study period for each cycle/sample, (4) keep a reject log and (5) ensure complete data collection. Aim to enrol consecutive eligible patients. Random sampling is ideal but usually not practical.
The project team establishes the eligible sample and exclusion criteria, plans to keep a log of patients enrolled in each sample, and commits to complete data collection for all samples. The team decides to start with convenience samples of patients admitted to the enthusiastic physician on the project team during regular working days. The team also consults with local experts, who suggest that implementation will be a challenge for patients admitted to physicians uninvolved with the project, especially on weekends and nights. The team decides that the purposive samples will comprise patients admitted under these more challenging conditions.
Choose a practical sample size (table 2)
Hypothetical results of early Plan-Do-Study-Act implementation cycles (steps 2–4)
We assume that resources for measurement are constrained. Suppose that reality dictates that a maximum of 10 patients per cycle can be sampled. The minimum acceptable fidelity is 70%, so there must be at least 7/10 successes every cycle. If there are four failures in a cycle, then the cycle cannot achieve 7/10 successes. The cycle can be stopped, the failures can be studied qualitatively, and necessary adjustments can be made.
The medication reconciliation team’s first PDSA implementation cycle (table 2) yields two correctly completed forms and four incomplete or missing forms on the convenience sample of six patients. There are already four failures, so the cycle can be stopped, because there is no chance of achieving 7/10 successes. The team studies the qualitative feedback and takes the necessary actions. The second cycle yields a similar experience. The third and fourth cycles are above the minimum acceptable fidelity of 70%, so the first milestone is achieved. The team moves to purposive samples of patients admitted to other physicians, including nights and weekends. Cycle 5 (table 2) shows poor fidelity, so the team obtains feedback and makes the necessary improvements. Cycles 6 and 7 both achieve the minimum acceptable fidelity of 70% on two consecutive purposive samples, so the second milestone is achieved.
Create a run chart (figures 1–3)
A run chart is an efficient method for further enhancing a team’s confidence in fidelity of implementation. Provost and Murray9 recommend that a run chart needs 10 data points, with at least 10 observations per data point, and a consistent sampling approach. Do not use the data from step 4 for the run chart because the change, the implementation method and the sampling approach are all in flux during step 4.
We propose that a third milestone is a stable run chart with a median fidelity above the minimum acceptable value (figure 1). Run charts have some simple rules for stability.10 If any rule is broken then the run chart is not stable.
trend: five consecutive points up or down (figure 2)
shift: six consecutive points above or below the median value (not including points that touch the median)
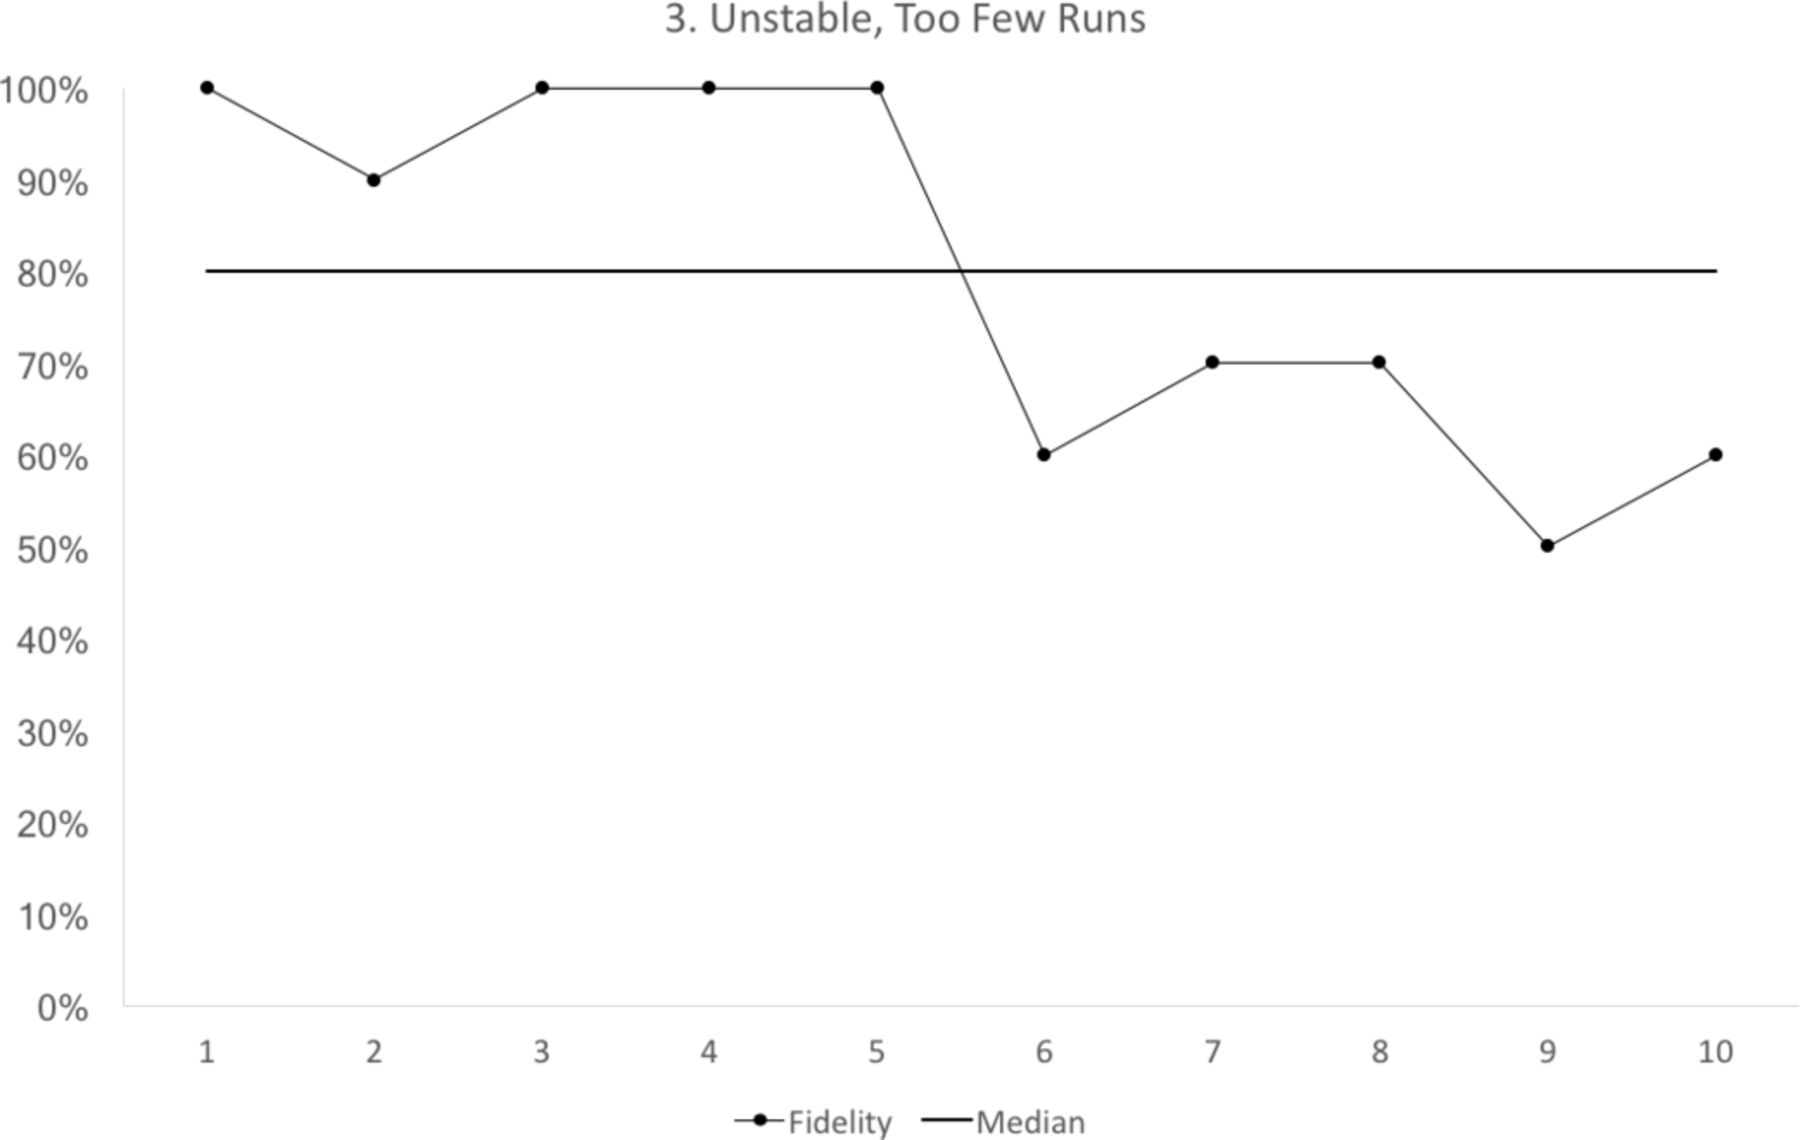
runs: the values cross the median too often, or not often enough (figure 3).
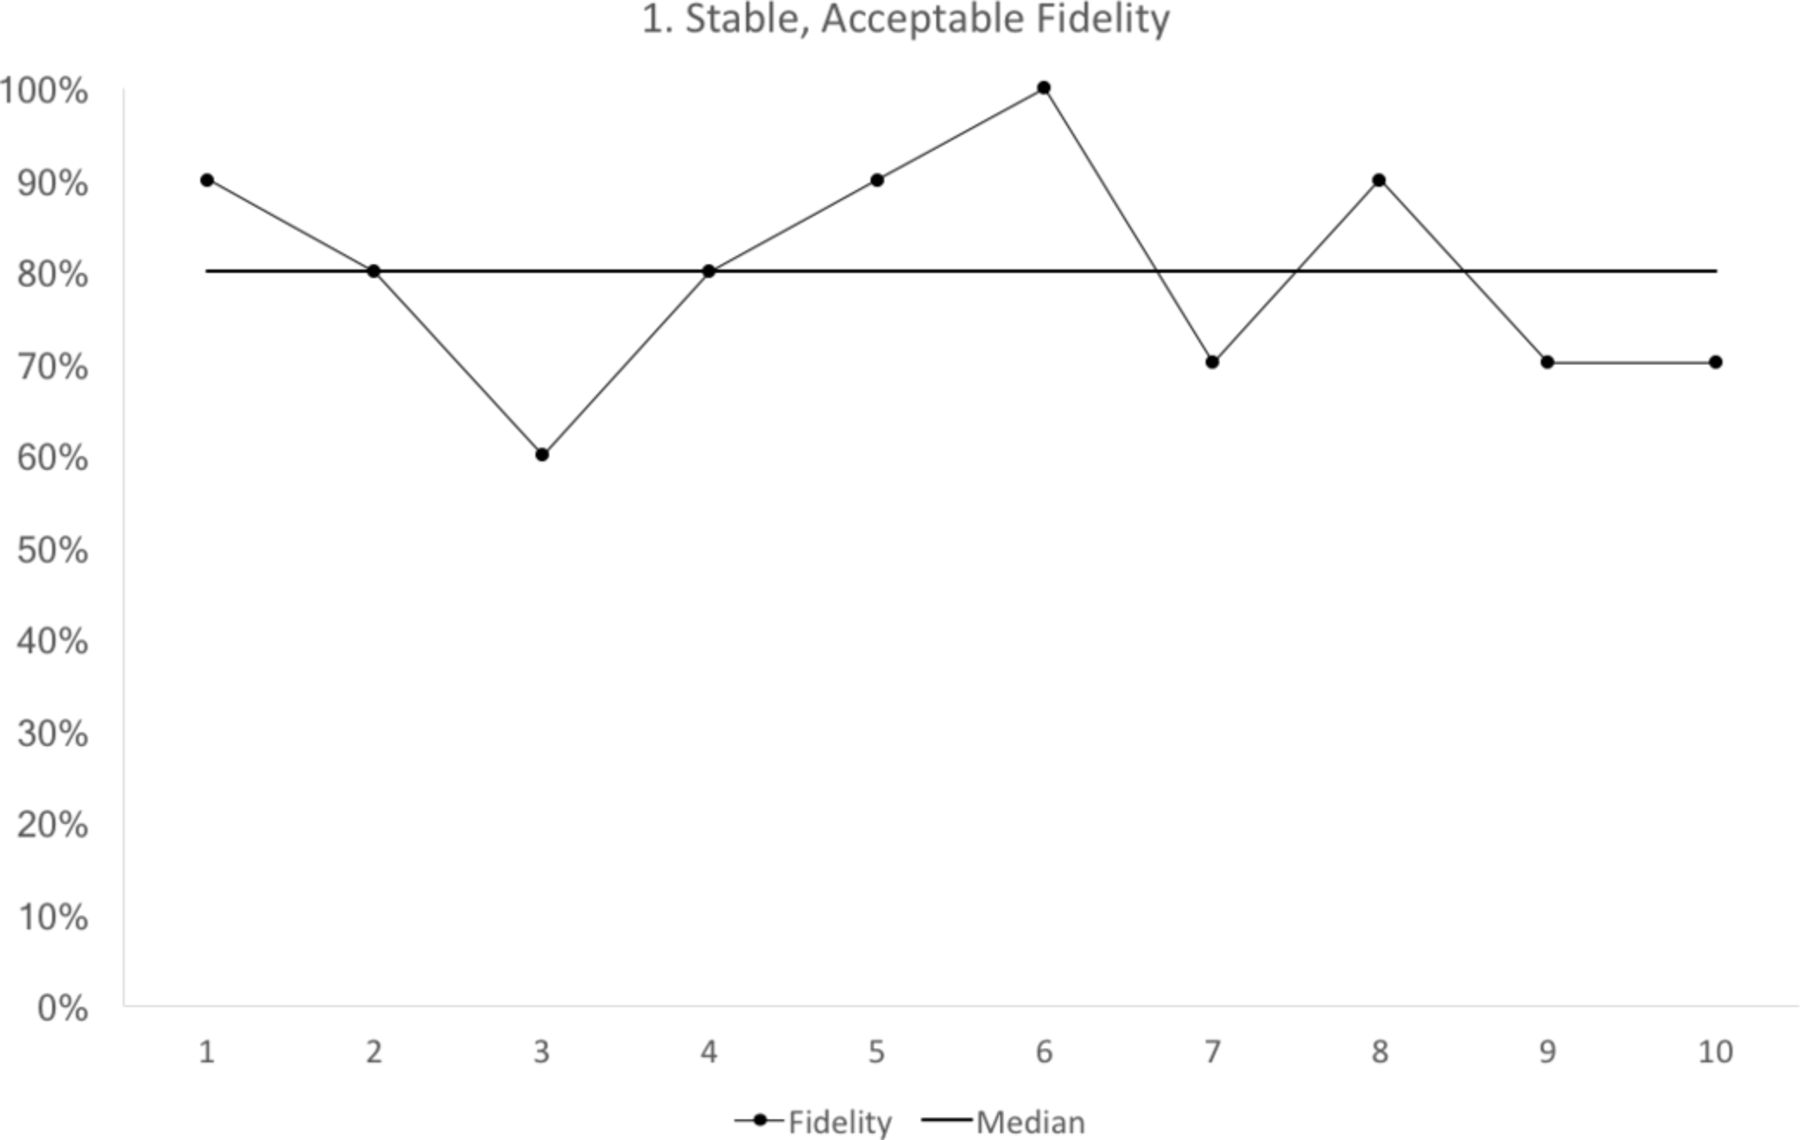
Run chart 1 shows the median fidelity above 70%, with no evidence of instability. Each data point represents 10 observations.
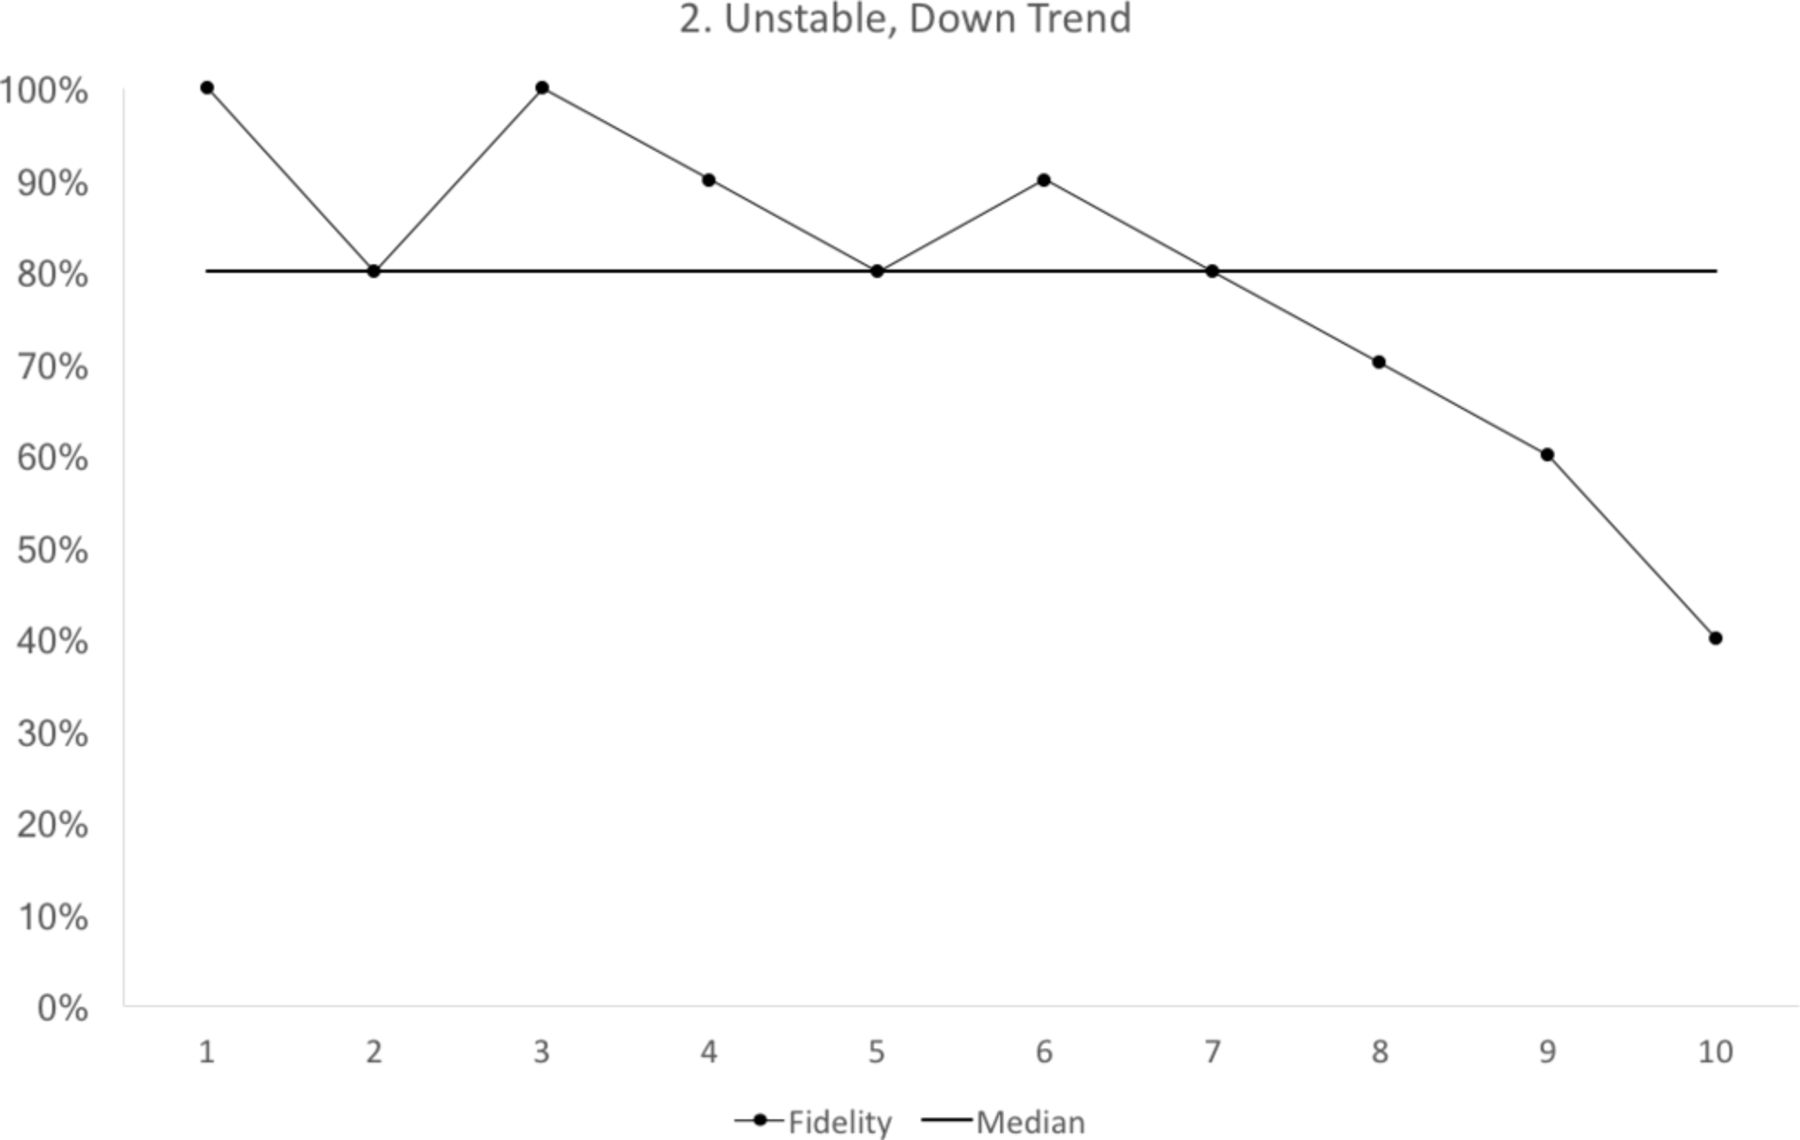
Run chart 2 shows a median fidelity above 70%, but the run chart is not stable. There is a downward trend starting with cycle 6. Each data point represents 10 observations.
Run chart 3 shows a median fidelity above 70%, but the run chart is not stable. The run chart line crosses the median only once. For a run chart where there are 10 points that do not fall on the median, we would expect to see the median crossed at least three times8. Each data point represents 10 observations.
One exceptional situation would be a run chart showing five consecutive increases (unstable but improving trend) and a median fidelity above target. In this case, the third milestone would be achieved.
Run charts cannot quantify the level of variation in the fidelity of implementation. Control charts, using larger samples and longer sampling periods, are needed to quantify the variation in fidelity of implementation. If ample data and resources are available, then control charts could be used earlier in a project.11 Otherwise, we suggest that a stable run chart with a median value above the minimum acceptable fidelity of implementation is an important milestone before undertaking additional dissemination or evaluation.
Project-level measures that reflect the ultimate targets of change can also be developed and tested during this step. This additional measurement effort can:
Enhance confidence that the change theory is correct. If implementation is acceptable, then there should be a trend to improvement in the other project-level measures, with no expectation of demonstrating a statistically significant difference. If there is an unexpected worsening, then the change theory, the implementation plan and the measurement methods should be re-examined.
Plan the sample size of an evaluative study. A sample size estimate requires an estimate of fidelity, and an estimate of the baseline values for the other project-level measures. For many projects, change is targeted at providers, but the impact of the change is measured on patients. For example, in the medication reconciliation example, the target of the change is physicians filling out the form, but the downstream impacts (medication errors and preventable adverse drug events) are measured on patients. In such cases, the correlation between the targets of change and downstream measures is needed for a sample size estimate.12
These additional measurement activities might not be needed if the relationship between the change and downstream effects is already incontrovertible and generally agreed on, or if there is no plan for broader dissemination or evaluation.
The project team commits to measuring ‘forms correctly completed’ on 10 purposive samples (each with sample size of 10) over the next 10 weeks. The team also begins to measure medication errors and preventable adverse drug events. These are project-level measures that reflect the ultimate target of the medication reconciliation project, as outlined in the team’s change theory. At the end of the 10 weeks, the run chart (figure 1) is stable and above the minimum acceptable fidelity. The team also has baseline measures for medication errors and preventable drug events, and an estimate of the correlation between physicians completing the form, medication errors and preventable adverse drug events. The team meets with a statistician to plan an evaluative study and obtain a sample size estimate. The team begins efforts to secure additional resources for broader dissemination and evaluation.
Summary
The following are our take home points:
It is essential to ensure high fidelity during early implementation prior to broader dissemination and evaluation.
We propose five steps to measuring fidelity during early implementation.
choose a fidelity measure based on a change theory
establish a minimum acceptable fidelity
establish a sampling strategy
choose a practical sample size
create a run chart.
We suggest three measurement milestones during early implementation:
two consecutive convenience samples above minimum acceptable fidelity
two consecutive purposive samples above minimum acceptable fidelity
one run chart of 10 purposive samples, each with at least 10 observations, showing stable implementation with median value above the minimum acceptable fidelity.
Footnotes
Handling editor Kaveh G Shojania
Contributors EE and TW both conceived the review, contributed to initial drafts, revised the paper for critical content and approved the final version.
Funding This work was supported by the Health Foundation and the National Institute for Health Research (NIHR) Collaboration for Leadership in Applied Health Research and Care (CLAHRC) Northwest London.
Disclaimer The views expressed in this publication are those of the authors and not necessarily those of the Health Foundation, the NHS, the NIHR or the Department of Health.
Competing interests None declared.
Provenance and peer review Commissioned; externally peer reviewed.