Article Text

Abstract
Background and objectives A clinical trial in 93 National Health Service hospitals evaluated a quality improvement programme for emergency abdominal surgery, designed to improve mortality by improving the patient care pathway. Large variation was observed in implementation approaches, and the main trial result showed no mortality reduction. Our objective therefore was to evaluate whether trial participation led to care pathway implementation and to study the relationship between care pathway implementation and use of six recommended implementation strategies.
Methods We performed a hospital-level time-series analysis using data from the Enhanced Peri-Operative Care for High-risk patients trial. Care pathway implementation was defined as achievement of >80% median reliability in 10 measured care processes. Mean monthly process performance was plotted on run charts. Process improvement was defined as an observed run chart signal, using probability-based ‘shift’ and ‘runs’ rules. A new median performance level was calculated after an observed signal.
Results Of 93 participating hospitals, 80 provided sufficient data for analysis, generating 800 process measure charts from 20 305 patient admissions over 27 months. No hospital reliably implemented all 10 processes. Overall, only 279 of the 800 processes were improved (3 (2–5) per hospital) and 14/80 hospitals improved more than six processes. Mortality risk documented (57/80 (71%)), lactate measurement (42/80 (53%)) and cardiac output guided fluid therapy (32/80 (40%)) were most frequently improved. Consultant-led decision making (14/80 (18%)), consultant review before surgery (17/80 (21%)) and time to surgery (14/80 (18%)) were least frequently improved. In hospitals using ≥5 implementation strategies, 9/30 (30%) hospitals improved ≥6 care processes compared with 0/11 hospitals using ≤2 implementation strategies.
Conclusion Only a small number of hospitals improved more than half of the measured care processes, more often when at least five of six implementation strategies were used. In a longer term project, this understanding may have allowed us to adapt the intervention to be effective in more hospitals.
- Emergency surgery
- Quality Improvement
- Implementation
- Evaluation
Statistics from Altmetric.com
Background
As the volume of surgical procedures performed worldwide continues to increase,1 2 the need for improvement in the quality and safety of surgical care has become a global healthcare priority.3–5 This is of particular importance considering both the increasing age and complexity of the surgical population and the global mortality burden associated with surgery.6 7 Emergency abdominal surgery is a commonly performed procedure worldwide, with high mortality rates and wide variations in the standards of care.8–11 The Enhanced Peri-Operative Care for High-risk patients (EPOCH) trial was performed to test whether a national quality improvement (QI) programme to implement a care pathway could reduce 90-day mortality following emergency abdominal surgery.12
The EPOCH trial intervention consisted of an evidence-based care pathway designed to improve patient outcomes and a QI programme promoting a set of implementation strategies designed to enable care pathway implementation.13 The main analyses were designed to evaluate the impact of the QI programme across a large cohort of 93 National Health Service (NHS) hospitals, leveraging the large sample size to adequately power the trial. A different perspective is to view the EPOCH trial QI programme as an enabling factor in 93 separate hospital-level QI projects. The impact of local context on the effectiveness of QI efforts is increasingly understood, especially in relation to complex intervention delivery.14–16 We observed wide variation in the approaches taken to implement the care pathway, including differing ways of engaging colleagues and decisions regarding which parts of the pathway to implement first, as well variations in the challenges faced. More details are provided below and in our concurrent trial process and ethnographic evaluation papers.13 17 Given the level of heterogeneity across participating hospitals, an analysis designed to understand changes in care processes at the individual hospital level is also needed.
In this paper, we explore how a form of simple time series chart (the run chart) might enable detailed hospital level analysis of process change over time when system improvements are attempted at a national level.18 The primary objectives of this study were to: (1) evaluate, at the individual hospital level, whether participation in the EPOCH trial QI programme led to implementation of the EPOCH care pathway and (2) to assess the relationship between care pathway implementation and use of the implementation strategies. Our secondary objectives were: (1) to describe the number of improvements in care processes overall and (2) to describe which care processes were most commonly improved (or potentially degraded).
Methods
This was a prospectively designed time series analysis of registry data provided by hospitals participating in the EPOCH trial, a stepped-wedge cluster randomised trial across 93 UK NHS hospitals. The registry was the National Emergency Laparotomy Audit (NELA), funded separately by the UK Healthcare Quality Improvement Programme, which started collecting individual patient data on 1 December 2013.
Patients and hospitals
Patients were recruited from March 2014 to October 2015. Recruited hospitals were grouped into 15 clusters of six to eight geographically colocated hospitals; clusters were randomised to start the intervention at 5-week intervals. QI leads from each stakeholder discipline (surgery, anaesthesia and critical care) were tasked with leading hospital wide improvement to implement the care pathway with the support and guidance of the national EPOCH QI team. QI leads were informed of their hospitals start date 12 weeks in advance. The main EPOCH trial analysis found no effect on the interventions on any of the trial outcomes measures: 90-day risk adjusted mortality, length of hospital stay or hospital readmission.12 Analysis of trial process measures (see below) suggested little improvement had occurred as a result of the intervention across the entire cohort. These results did not differ significantly between hospitals activated earlier in the stepped-wedge design compared with those activated later.
The EPOCH care pathway and implementation strategies
Details of the 37-component evidence-based care pathway are provided in figure 1, and a full summary of evidence is available on the trial website (www.epochtrial.org). The EPOCH programme theory was based on current evidence and learning from a range of other QI programmes.19–22 Six specific implementation strategies were developed to facilitate care pathway implementation (see table 1). The EPOCH QI programme was designed to support local clinicians. The programme comprised: a 1-day face-to-face educational meeting; a half-day follow-up; a virtual learning environment and telephone/email support from the core EPOCH team. The QI intervention was designed to be ‘light touch’, recognising the limited resources of the study, of clinician time within the NHS and the fact that data collection through NELA was already taking place. Full details of the EPOCH QI programme are reported elsewhere.13
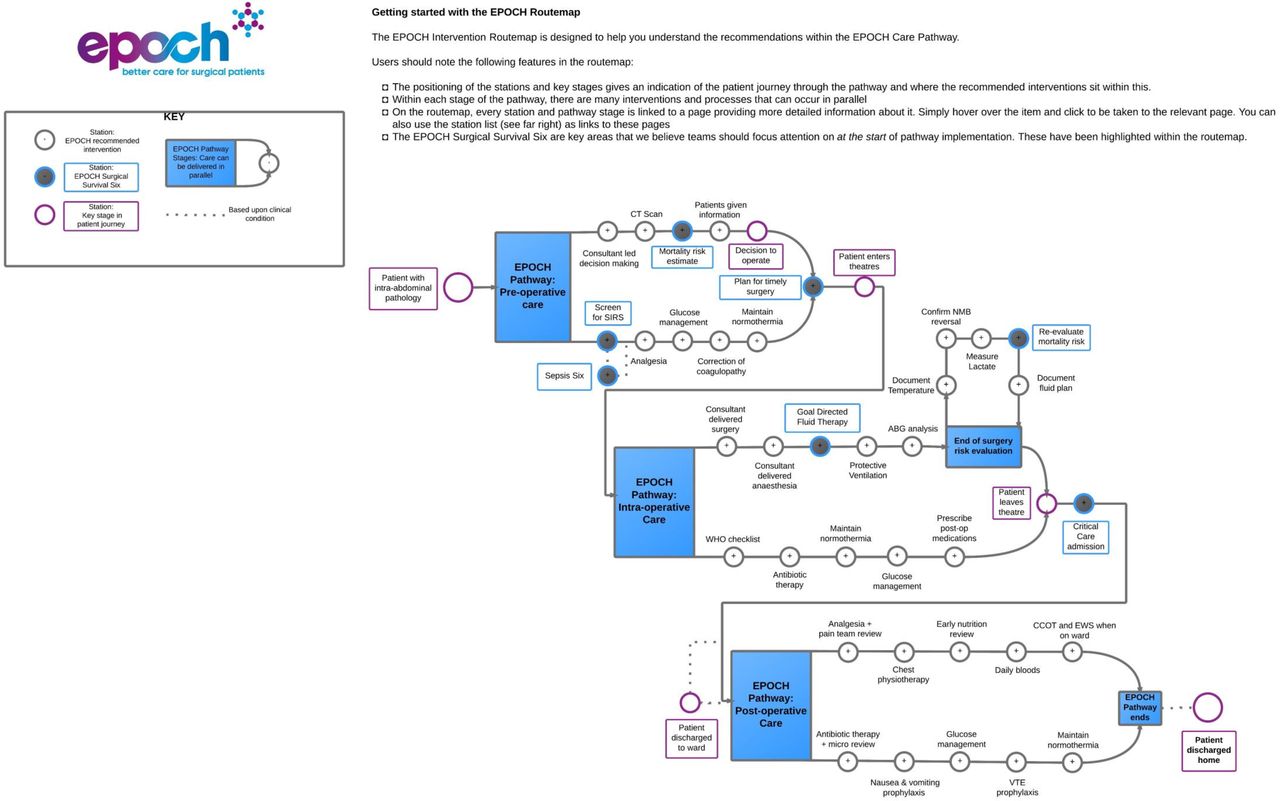
The EPOCH trial recommended care pathway. ABG, arterial blood gas; CCOT, critical care outreach team; NEWS, national early warning score; NMB, neuromuscular blockade; Sepsis Six, a protocolised treatment for sepsis; SIRs, systemic inflammatory response syndrome; VTE, venous thromboembolism.
EPOCH implementation strategies; desired outcomes, resources and use in individual hospitals
Data collection
Data were collected through the NELA database (www.nela.org.uk). Inclusion and exclusion criteria for these analyses were the same as for the main trial.12 Patients were eligible for inclusion in the data analysis if they were 40 years or older and undergoing emergency open abdominal surgery in a participating hospital. Patients were excluded from the analysis if they were undergoing a simple appendicectomy, surgery related to organ transplant, gynaecological surgery, laparotomy for traumatic injury, treatment of complications of recent elective surgery or if they had previously been included in the EPOCH trial. We predefined a longer data collection period than the main trial so that data from the 1 January 2014 to 31 March 2016 (6 months following the end of the EPOCH trial) were analysed. The rationale for this is that the shift rule requires at least six data points (ie, 6 months of data, see figure 2) for change to be demonstrated. There is also evidence that the effects of QI may take longer than expected to show.23 24 Therefore, we included this 6-month wash-out period to provide clusters activated later in the trial adequate opportunity to demonstrate improvement. We used data from our process evaluation questionnaire to quantify recommended implementation strategy use in each hospital (table 1). Full results of the process evaluation are reported elsewhere.13 Seventy-seven of 93 (83%) of QI leads completed the exit questionnaire. For this study, we used binary responses related to implementation strategy usage, for example, we did/did not form a QI team.

Run chart analysis process and worked example. Explanation of steps in run chart analysis: (1) Baseline median from months 1–11. There are 10 useful data point (excluding 1 point on the median) and 8 runs (groups of data points on either side of the median line). Referring to published guidance, this indicates the baseline performance is exhibiting normal (random) variation. (2) As the baseline period has no signals, baseline median is projected forward as centre line for chart, against which to assess new data. (3) Intervention period runs from months 12–27. Two signals of interest: (A) number of runs, in this case 5, which when referring to published guidance would indicate a non-random signal and (B) shift, ≥6 data points on one side of the median line, which would also indicate a non-random signal. Therefore, a signal demonstrating an improved process is shown from month 19 onwards. (4) A new median performance is calculated from these data points (71% new median process delivery). CO, cardiac output; NELA, National Emergency Laparotomy Audit; QI, quality improvement.
Process measures
Process measures in this study are the same as those in the main trial but now analysed at the individual hospital level rather than in a pooled analysis. The 10 key care processes of the EPOCH care pathway for which process measure data were available via the NELA dataset were: (1) consultant-led decision making; 2) consultant review of patient before surgery; (3) preoperative mortality risk documented; (4) time from decision to operate to entrance to the operating theatre; (5) entry to operating theatre within National Confidential Enquiry into Patient Outcome and Death (NCEPOD) target time frame; (6) consultant-delivered surgery; (7) consultant-delivered anaesthesia; (8) cardiac output monitoring to guide fluid therapy; (9) measurement of serum lactate intraoperatively; and (10) admission to critical care postoperatively.
Data analysis
Process measure data were analysed for each hospital. Data for each calendar month were pooled, and the mean was calculated and plotted onto run charts, using a preprogrammed Excel workbook designed specifically for the EPOCH trial (see figure 2 for a worked example). A baseline median was constructed with the first 10 data points (January 2014–October 2014) or from January 2014 up to and including the month of trial cluster activation, whichever provided the longer baseline period. To increase the likelihood that any signals identified in the run charts were associated with the EPOCH trial, and not pre-existing improvement efforts (such as involvement in NELA), each hospital’s baseline median was assessed for signals using the run chart rules. In particular, the ‘runs rule’ was used to identify potential improvements in patient care processes before the improvement intervention started (see ref 18 for the reference chart for this). In line with recommended practice, if no signals were seen, the baseline median was fixed and extended forward creating the centre line for all data points on the chart to facilitate analysis of signals over time.18 25 Where too few runs were seen, the median was not fixed and extended but instead continued with all data points in the chart contributing to this. The patterns of data points on the charts were visually inspected for signals compatible with accepted run chart rules that are probability-based, predefined data patterns with a probability of <5% of occurring by chance.18 The two run chart rules used in this analysis are: (1) a shift, identified as a signal with 6 or more data points on one side of the median line and (2) too few runs, identified by counting the number of runs (groups of data points falling either above or below the median line) and then referring to the published guidance for the upper and lower limits.18 The trend rule was not included due to evidence of lack of utility.25 When a signal was identified in a care process, a new median monthly delivery rate was calculated based on the data contributing to the signal.
To answer objective 1, we considered the care pathway to be implemented if the 10 measured processes improved to the extent that all had a median monthly delivery rate of >80% following activation to the intervention (or a sustained median of <6 hours to surgery for process measure four, as above). Eighty per cent was chosen as it is considered a minimum level of process reliability and is used by NELA to define an acceptable standard of care.8 26 Care processes already reliably delivered to >80% of patients were also included. To answer objective 2, we defined care process improvement as any signal towards improvement identified on a hospital’s run chart, regardless of the magnitude of the improvement (unless followed by a subsequent signal toward process degradation). For each hospital, we also calculated the proportion of patients before and after activation to the intervention who received each of the target care processes and the median time from decision to operate to entry into the operating theatre (process measure 4) preactivation and postactivation. These were then aggregated for all trial hospitals included in the run chart analysis to show the overall effect size of process changes.
We report the relationship between care pathway implementation and implementation strategy fidelity using descriptive statistics and analysed the relationship using a scatterplot and R2 calculation. To explore this relationship further, we undertook post hoc analysis comparing: fidelity to implementation strategy usage (using five or six strategies vs using <5 strategies), individual implementation strategy usage, NELA data collection method and care process improvement between the least improved (≤2 care processes improved; n=28) and the most improved (≥6 care processes improved n=14) hospitals. We used Fisher’s exact test, with 2×2 contingency tables to compare groupings and a one-sided p value, with significance set at p<0.05.
We undertook a validation exercise, with an independent reviewer (RH) analysing a random selection of 200 of the total 800 charts (25%). The reviewer repeated the analysis of each chart. Results for the 200 charts were compared with the original analyses and any inconsistencies of analysis were discussed, and the final result was agreed on. An error rate of ≥5% was decided as the threshold for whether a further validation exercise would be necessary. We also undertook two post hoc sensitivity analyses on the charts from the hospitals that improved more than half the process measures (14/80 hospitals improved ≥6 care processes) to test the different results obtained by using stricter analysis rules. These rules use thresholds for identifying signals (runs and shifts) based on the total number of data points on the chart, rather than a fixed rule, which may provide more accurate findings.27 In this group of most improved hospitals, we also undertook analysis using a run chart centre line (median) based on all chart data, rather than the fix and extend method.
Results
Of the 93 hospitals enrolled in the EPOCH study, 86 hospitals had data available for analysis. However, six hospitals had data capture of insufficient quality (<50% case ascertainment reported via NELA for either both years 1 and 2 of the audit or for the year in which the hospital was activated to the QI intervention) to enable month-by-month analysis using run charts. Therefore, 80 hospitals were included in analyses resulting in the generation of 800 run charts for the 10 measures of interest, based on analysis of data from 20 305 patient admissions (figure 3). Table 2 displays key hospital characteristics of interest. In the validation exercise, six errors were identified, giving an interobserver agreement of >95%. Of the six errors, three were type 1 errors, where charts were marked as having signals towards improvement that were not there, and two were type 2 errors, where signals toward improvement were missed. One was an error where a degraded care process was missed (type 2 error). In all cases, signals were marginal, and overall, these errors did not substantially change our main findings or conclusions.

Inclusion of hospitals and patients in the run chart analysis. NELA, National Emergency Laparotomy Audit; QI, quality improvement.
Key characteristics of data set
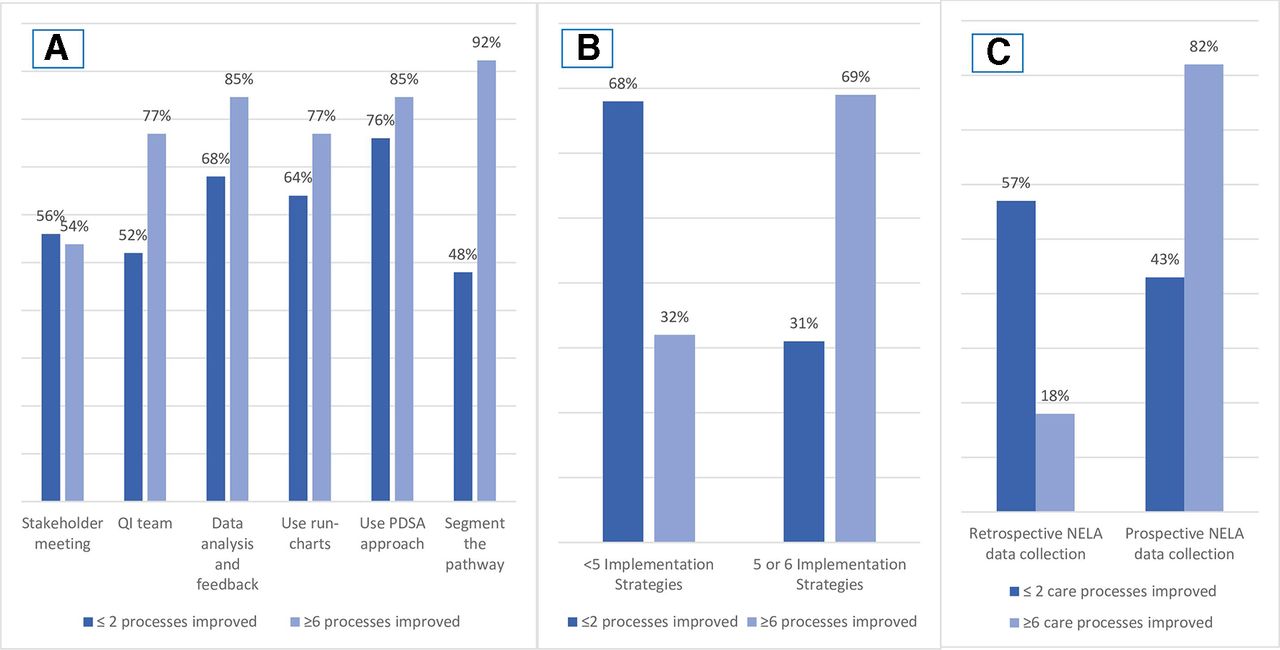
No hospital achieved implementation of the care pathway according to our definition (all 10 measured care processes improved to a ≥80% median delivery rate). Regarding objective 2 (describing all improvement, not just achievement of >80% reliability), 21/80 hospitals improved ≥5 of the 10 measured processes and 14/80 improved ≥6. Figure 4 displays the overall number of improved care processes per hospital. Preoperative risk assessment (57/80 (71%)), intraoperative lactate measurement (42/80 (53%)) and cardiac output-guided fluid therapy (32/80 (40%)) were the most frequently improved care processes (table 3). Consultant-led decision making (14/80 (18%)), consultant review before surgery (17/80 (21%)) and time from decision to operate to surgery (14/80 (18%)) were the least likely care processes to improve (table 3). Questionnaire data describing implementation strategy use showed that 10/77 (13%) of QI leads responding said that all six strategies had been used, 23/77 (30%) indicated five had been used, 21/77 (27%) indicated four had been used, 8/77 (10%) used three strategies, 10/77 (13%) used two and 5/77 (6%) just one. No QI lead reported zero implementation strategy usage. Table 1 shows the reported usage of each QI strategy. As no hospital achieved care pathway implementation, we undertook analysis of the relationship between implementation strategy usage and the number of care processes improved. We divided the cohort into tertiles of implementation strategy usage (1–2 strategies, 3–4 strategies and 5–6 strategies) and defined successful hospitals as those with six or more improved care processes (ie, more than half of care processes improved). In hospitals that used 1–2 strategies, we found that no hospitals (0/11) improved six or more care processes, while among those that used 3–4 strategies 4/25 (16%) hospitals improved six or more care processes, and in those that used 5–6 strategies 9/30 (30%) of hospitals improved ≥6 care processes. However, using a linear analysis model across the whole trial cohort, we found no correlation between implementation strategies used and the number of care processes improved at individual hospitals (R2=0.084, online supplementary file). Figure 5A–C, presents the post hoc analysis findings, comparing least and most improved hospitals by implementation strategy usage and NELA data collection method. Prospective NELA data collection, by all members of the care team (presenting a lower time burden for QI leads), was positively associated with greater care process improvement (p=0.039). Details of further evaluation of the relationship between care process improvement and implementation strategy usage are reported in the supplementary file.
Supplemental material
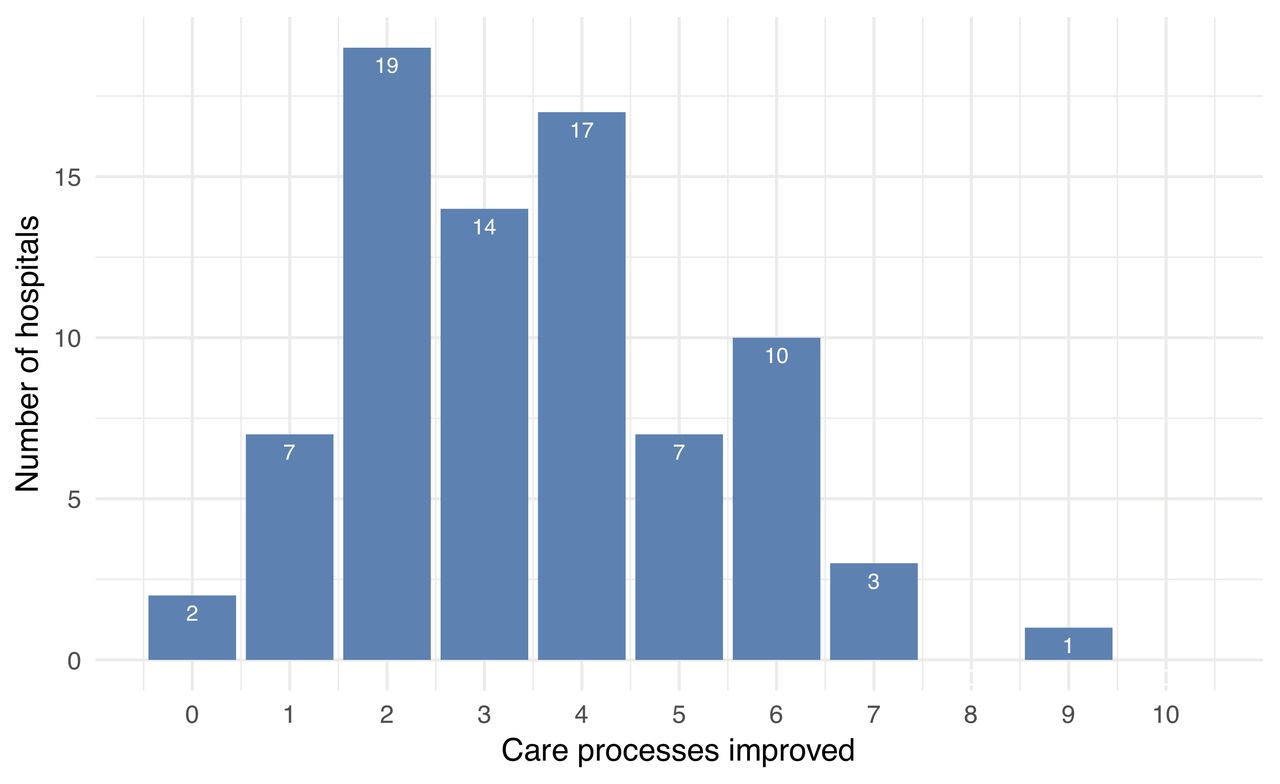
Number of care processes improved by each hospital during EPOCH trial (n=80 hospitals). EPOCH, Enhanced Peri-Operative Care for High-risk patients.

(A) Difference in implementation strategy use between least and most improved hospitals. (B) Fidelity to implementation intervention, comparing least and most improved hospitals by strategy usage. (C) Comparison of least and most improved hospitals by NELA data collection process. NELA, National Emergency Laparotomy Audit; PDSA, plan–do–study–act; QI, quality improvement.
Process measure improvement per hospital temporally associated with participation in the EPOCH trial QI programme
During the analyses, we identified the care processes in each hospital that were already reliably delivered, as defined by a baseline median of ≥80% delivery of a process measure. Consultant led decision making was the care process most reliably delivered pre-EPOCH, with 71/80 hospitals achieving a median of ≥80% for this measure. Of these hospitals 11 (15%) further improved on this performance during the EPOCH intervention period. Consultant delivered surgery was often already reliably delivered, with 70/80 hospitals already achieving a median of ≥80% for this measure. Nevertheless, 19 of these hospitals (27%) managed to further improve this care process. Consultant delivered anaesthesia was the next most reliably delivered care process at baseline (57/80 hospitals) and 16 of these hospitals (28%) demonstrated further improvement in consultant-delivered anaesthesia. Conversely, only 2/80 (2.5%) hospitals had a median time from decision to operate to surgery of <6 hours before the EPOCH trial started; this was also the most challenging care process to improve, although 17.5% (14/80) of hospitals did demonstrate an improvement on the run chart analysis. Process degradation was also observed during run chart analysis. We found 43/800 (5.4%) care processes across 28 hospitals to be degraded after participation in the EPOCH QI programme, that is, a signal towards worse performance associated with activation to the EPOCH intervention. Despite being the third most frequently improved care process, use of cardiac output monitoring to guide fluid therapy was the most commonly degraded process (10/80 hospitals).
In the sensitivity analyses, using stricter run chart rules would have identified 78/140 care processes as improved in this group, rather than 90/140 using the standard rules, resulting in a group of 10 hospitals, rather than 14 that improved ≥6 care processes. Regarding different approaches to the chart median, 6/140 (4%) of charts in the sensitivity analysis used a median based on all data points in the original analysis (due to signals in the baseline period). Across the group of most improved hospitals, using a chart centre line based on all data points would have identified 57/140 (41%) care processes as improved, resulting in a group of three hospitals, rather than 14, that improved ≥6 care processes (see online supplementary table 1).
Discussion
The main finding of this analysis was that no hospital in the EPOCH trial reliably implemented the care pathway within 6 months of the end of the intervention period. However, we did identify areas of improvement. In total, 279 (of a possible 800) care processes were improved by hospitals through participation in the EPOCH trial, and a small group of hospitals (17.5%, 14/80) were successful in improving ≥6 care processes. Effect sizes overall were marginal but with substantial variance for each process across trial hospitals. We specifically did not seek to evaluate changes in patient outcomes associated with the trial intervention, but it seems logical that if only a small proportion used all the recommended implementation strategies and only a subset of these hospitals were able to improve more than half the target care pathway processes, then the causal mechanism we hypothesised would lead to outcome improvement was largely absent in the EPOCH cohort. This confirms the findings of the main, patient-level, trial analysis. This supports the use of individual hospital-level time-series analysis, both during a programme to monitor progress and support hospitals facing challenges and as part of the evaluation strategy to provide granular understanding of cohort-level analyses. We used a prospectively defined run chart methodology, but in a sensitivity analysis, we found our findings were sensitive to the use of alternative methods of run chart construction.
This study contributes to the growing literature on methods to better understand improvement and implementation research results in the face of complexity.24 28–30 In particular, hospitals participating in multisite cohorts may well achieve differing results; understanding this local-level granularity enables a clearer understanding of what happened during a large-scale intervention and what led to, or hindered, overall success.31 32 In line with evidence that a multifaceted approach to change is more effective,33 the hospital teams in our study that achieved greater care process improvement also reported using more of the implementation strategies recommended by the QI programme. While the relationship was absent in the linear model, this approach may be poorly suited to the complexity of this issue, especially across a large and heterogenous cohort. Analysis by groupings, and in particular when comparing the least and most improved hospitals (figure 5a–c and online supplementary file), suggests that greater improvement was possible (but not guaranteed) with use of more of the recommended implementation strategies. This supports the hypothesis that the QI intervention could be effective but only if used in full and deployed within a supportive context. Our concurrent process evaluation paper describes in detail the contextual factors, both enablers and barriers, faced by hospitals as they attempted improvement.13 Major barriers included limited time and scarce resources to support clinicians leading improvement and, relatedly, an onerous burden of data collection that limited capacity to subsequently use these data for improvement. Related to this specific factor, our post hoc analysis also indicated that in hospitals where systems to collect data prospectively existed, minimising the data burden on NELA and EPOCH QI leads, the number of improved care processes increased. Lack of interest among colleagues and seniors was also reported as a problem in many hospitals. Almost universally, contextual enablers were the opposite of these, and future improvement programmes will need to fully address these factors to be successful, including allocating job-planned time for frontline improvement leaders and additional funding for support functions such as data collection and analysis.
There are other possible reasons why we did not find greater care pathway implementation or care process change. First, our definition of reliable pathway implementation may have been too stringent. The standards set by NELA only require consultant presence in the operating room and admission to critical care for patients with a ≥5% risk of mortality, whereas the aspirational improvement goal of the EPOCH trial was for all patients requiring emergency abdominal surgery to be put onto the recommended care pathway. While 80% is an accepted threshold for defining minimum reliability,26 it is possible that hospitals were guided by the more pragmatic standards as set by NELA, thus reducing the chances of pathway implementation as defined in this paper. Second, three key care processes (consultant-led decision making, consultant-delivered surgery and consultant-delivered anaesthesia) were already being reliably delivered (to >80% patients) in most hospitals at the start of the intervention period, which may have limited the head room for further improvement of these particular care processes in some hospitals. Also, the value of one key process, cardiac output monitoring, was under debate in the UK during the time of the study,34 and this may have meant some teams chose not to focus on it or, as our data show, to move away from delivering this process completely. Third, system-level care processes, such as reducing the time to get patients into the operating room, were harder to improve than processes that individual clinicians were able to improve by themselves, such as assessing mortality risk. Nevertheless, we did see that nearly 30% of hospitals improved their performance on getting patients to the operating room in a time frame appropriate for their operative urgency. Considering the complexity of this system-level process, contingent on the actions of multiple stakeholders and on the other pressures faced by operating room suites in the UK, we feel this is a substantial achievement. This mirrors findings from previous QI work regarding the degree of difficulty in attempting to improve systems-level processes compared with more discrete, individual professional or small team delivered processes35 and supports the need to consider different, and potentially more intensive, strategies to improve system-level care processes. This may be of particular importance for this patient group given recent evidence demonstrating the positive impact on mortality of system-level changes such as single pathways of care in emergency general surgery and dedicated emergency surgery units.36
At the trial level, without these further analyses, the degree to which each hospital had implemented the care pathway as intended or improved would have remained unclear, as each hospital’s signal was obscured within the results of a large and heterogeneous cohort. The use of run charts to evaluate QI programmes at scale remains rare, with some notable exceptions,37 yet they are ideally suited to this level of granular data analysis. The main strength of this analysis is that we have tested this approach experientially, alongside our main trial analyses, using the same dataset, and found it was largely congruent with, but added value to, our previous understanding of what happened during the EPOCH trial. We mitigated against human error, inherent in the visual inspection of run charts (present even when using automated data analysis programmes), by undertaking a validation exercise to provide assurance of reliability, which we consider a strength of this work. We also tested different approaches to constructing and analysing run charts in sensitivity analyses and found that the approach used may have a substantial impact on findings. This analysis also had some limitations. First, performance of hospitals in 6 of the 15 trial clusters was analysed using run charts that had a baseline median constructed of 10 data points, which is the minimum acceptable number to use the probability-based run chart rules.18 This was due to the trial and the data collection process, via NELA, starting nearly contemporaneously, thus limiting baseline data in early clusters. Second, analyses require decisions about the desired trade-off between sensitivity and the risk of false-positive signals being identified.18 25 Both our sensitivity analyses, using stricter analysis rules and comparing different methods for creating the chart median, reduced the number of process improvements observed. In the latter analysis, this reduction was substantial. If stricter run chart rules, or a chart median based on all data points, had been applied across all analyses, the level of care process improvement identified would have been smaller than we found than in our preplanned analysis. Third, variations in the denominator for the monthly plotted percentages sometimes interfered with signals in the data, for example, in a month with a small denominator, a few process failures may create a data point that breaks a signal that would otherwise indicate a move towards improvement. This, combined with the time-bound nature of the analyses, may have led to some real-world improvements not being identified using the run charts (ie, type 2 errors). Our analysis may therefore ultimately have provided an overly conservative estimate of the volume of improvement associated with the EPOCH intervention. This problem may have been mitigated by using both run charts and Statistical Process Control charts in a head-to-head comparison. Although it would have produced further valuable reflections on various types of time-series chart for evaluation, it was beyond the scope of these preplanned analyses to do this. Fourth, some of the analysis of the relationship between care process improvement and fidelity to implementation strategies was undertaken post hoc, as the lack of care pathway implementation meant we could not complete our preplanned primary objective. Finally, while our process and ethnographic evaluation identified several potential enabling strategies and influences, we were not able to quantify these to explore their relationship directly with process improvement in these analyses. There may therefore be some important missing strategies that we did not include in the original programme theory and were also not evaluated in this study.
Conclusion
The EPOCH QI intervention did not achieve reliable care pathway implementation in any trial hospital but was associated with individual improvement of care processes across the cohort and substantial improvement in a minority of hospitals. Individual hospital performance analysis using time-series charts can help granular analysis of data from large, heterogeneous cohorts. This approach allowed us to fully understand changes in the delivery of patient care in response to the EPOCH trial intervention, but findings may be sensitive to the chosen run chart design. In a longer term project, this understanding may have allowed us to adapt the intervention to be more successful.
Acknowledgments
We would like to thank Dr Alex Fowler for his help with the additional data analysis during the revision of this manuscript.
References
Footnotes
Collaborators Enhanced Perioperative Care for High-risk patients (EPOCH) Trial Group: Ruper Pearse, Carol Peden, Tim Stephens, Julian Bion, Graham Martin, Ann Thomson, Brennan Kahan, Sally Kerry, Kate Rivett, Duncan Wells, Gerry Richardson, Stephen Brett, Gareth Ackland, Mike Grocott, Peter Holt, Glenn Robert, Obioha Ukoumunne, Justin Waring, Kirsty Everingham, Mandeep Phull, David Cromwell, Rachel Evley, Richard Lilford, David Kocman, Miqdad Asaria, Justin Waring, Carolyn Tarrant, Fan Yang, Ajit Abraham, Pieter Bothma, Daniel Conway, Clare Stapleton, Mark Edwards, Gary Minto, David Saunders, Tom Owen, Carl Waldmann, Paul Hayden, Michael Gillies, Sean Tighe, Neil Smith, Monty Mythen, David Murray, Dileep Lobo, Martin Leuwer, Justin Kirk-Bayley, Simon Howell, Anthony Gordon, Iain Anderson, Jose Lourtie, Simon Walker, Sharon Drake, Dave Murray, Nick Watson, Tamas Szakmany, Robert Sutcliffe, Ravi Mahajan, Alan Girling, Gordon Forbes, Omar Faiz, Mark Blunt, Surjait Singh, Alistair Steel, Kate Wong, Leilani Cabreros, Pieter Bothma, Vivek Chitre, Ayodele Obideyi, Dhiraj Ali, Karl Blenk, Dan Broad, Andreas Brodbeck, Rajesh Dumpala, Arnth Engel, Ranjit Ganepola, Sudha Garg, Mike Gay, Michael Karlikowsk, Edward Lams, Dean Millican, Inga Misane, Ajaya Mull, Veena Naik, Nathan Pushpa, Chris Nutt, Saravanna Sagadai, Hazel Stuart, Paul Noble, Niko Van De Velde, Liam Hudson, Raoul Benlloch, Satish Singh, Karan Verma, Damian Laba, Jack Carmichael, Peter Richardson, Graham Wilson, Ricky Lewis, Karthik Surendran, Essam El-Damatty, Sarada Gurung, Ilona Raulusaite, Nabua Gerstina, Chloe Rochester, Rai Kuldip, Andrew Lindner, Therese Murray, Vivek Chitre, Roshan Lal, Sarah Downey, Vamsi Velchuru, Kamal Aryal, Raman Guruswamy, Kirosh Shankar, Helen Porter, Matthew Tutton, Helen Agostini, Simon Fletcher, Richard Wharton, Steve Hutchinson, Bala Maiya, Richard Howard-Griffin, Michael Crabtree, Vlad Kushakovsky, Abdel Omer, Senthil Nadarajavan, Stephanie Bell, Vishal Patil, Asif Jah, Razeen Mahroof, Nicholas Watson, John Tansley, Gareth Moncaster, Neil Flint, Andrew Miller, Marcus Wood, Andreou Prematie, Sally Roth, Sarah Bowery, Dawn Hales, Tanuja Shah, Gill Tierney, Craig Morris, Syed Iftikhar, Amit Shukla, Grainne O'Dwyer, Adam Wolverson, Ferdinand Adams, Laura Perrin-Brown, Tim White, Sarah Beavis, Victoria Banks, John Abercrombie, Jonathon Mole, Avninder Chana, Ayan Banerjea, David Humes, Rajpal Dhingsa, John Wells, Stephanie Brown, Kenneth Adegoke, Barclay Tofte, Ana Alegria, Nat Natarajan, Mansoor Akhtar, Samer Doughan, John Mackinnon, Biju Aravind, Esther Cook, Mark Snazelle, Matt Gardner, Lee Baldwin, Simon Bailey, Greg Lawton, Nandita Divekar, Neil Kukreja, Mansoor Sange, Mark Watson, Mallikarjunappa Satisha, Michael Protopapas, Zakaulla Belagodu, Shameem Sarfi, Pasupathy Raju, Brenda Stacey, Tim Campbell-Smith, Simon Parrington, Somi Desikan, Andrew Brennan, John Griffith, Steve Fletcher, Catherine Farrow, Stewart Prestwich, Laura Graham, Martin Northey, Jay Gokhale, Frances Mosley, Peter Alexander, Abhiram Sharma, Will Brady, John Hopper, Oliver Hill, Sandeep Varma, Christopher Macklin, Alastair Rose, Harjeet Narula, Sarah Buckley, Karen Simeson, Kevin Sim, Michael Chadwick, Preeti Kuduvalli, Susan Dowling, Amanda McCairn, Lawrence Wilson, Dale Vimalchandran, Anita Jhamatt, Nicole Robin, David Monk, Martin Leuwer, David Bottomley, Oliver Zuzan, Ingeborg Welters, Davina Ross-Anderson, Charles Knowles, Nick Bunker, Ying Hu, Marta Januszewska, Phoebe Bodger, Edyta Niebrzegowska, Carmen Correia, Richard Haslop, Tom Abbott, Tabitha Tanqueray, Sanjay Wijeykoon, Susan Jain, Jens Full, Tamzin Cuming, Flora Bailey, Stelios Chatzimichail, Pedro Cunha, Almas Rehman, Manab Mohanty, Nicola Radford, Otto Mohr, Hitesh Patel, Dolores Mateo, Ashok Raj, Michael Machesney, Nazar Abdul, Kim Jemmet, Marta Campbell, David Inglis, Thomas Parker, Thomas Medici, Peter Chan, Nathan Borgeaud, Dipankar Mukherjee, Oluremi Odejinmi, Tomas Jovaisa, Elizabeth Harwood, Ramani Moonesinghe, Jonathan Mccullough, Jigna Modha, Sanjiv Patel, James Limb, Sheshagiri Bengeri, Amir Rafi, Elizabeth Hall, James Brown, Bruce Gibson, Una McNelis, Mike Bradburn, Maria Lawson, Sara Pick, Matthew Gaughan, David Browell, Vanessa Linnett, Jenny Ritzema, Paul O'Loughlin, Sean Cope, John Corson, Alistair Roy, Julie Furneval, Anitha Holtham, Sophie Noblett, Chris Dawson, Elizabeth Hall, Mike Bradburn, Fiona McMenemie, David Saunders, Stefan Pulsa, Ian Clement, Verity Calder, Katherine Allen, Catherine Rimmer, Helen Reed, Christine Boyd, Diane Monkhouse, Peter Davies, Jost Mullenheim, Emanuel Cirstea, Martyn Cain, Kirsty Baillie, Tom Owen, Arnab Bhowmick, Keiarash Jovestani, Sean Mcmullan, Emma Durant, Alexandra Williams, Donna Doyle, Jason Cupitt, Jonathon Barker, Nick Harper, Emma Brennan, Daren Subar, Robert Shawcross, Dominic Sebastian, Panna Patel, Gillian O'Connell, Jyrki Karvonen, Maitra Ishaan, Alison Hool, Karen Burns, Carol Mcarthur, Tezas Stergios, Singh Gursevak, Makvana Sonia, Heather Pratt, Kaighan Lynne, Sean McAfee, Chris Lewis, Wael Khalaf, Chris Coldwell, Christine Bronder, Mark Wilkinson, Emma Davis, Glenn Arnold, Paul Ziprin, Rachel Bartlett, Martin Stotz, Rovan D'souza, Phillippa Pemberton, Banwari Agarwal, Anita Sugavanam, Melanie Tan, Massimo Varcada, Craig Lyness, Andrew Thorniley, Ash Prabhudesai, Ruth Griffin, Shubha Vashisht, James Harris, Julie Wakeford, Sergei Vaganov, Yasser Mohsen, Alister Myers, Qamar Iqbal, Simon Harris, Sami Ijaz, James Burrow, Paul Ziprin, Francesca Rubulotta, James Burrow, Nabil El-Masry, Nicola Stranix, Tamsin Rope, Lampros Liasis, Tariq Husain, Josef Watfah, Megan Griffiths, Janindra Warusavitarne, Charles Cartwright, Linden Baxter, Rakhee Visavadia, Malcolm Sim, Chris Wilson, Paul Harrison, Dewi Williams, Maria Bews-Hair, Wayne Wrathall, Catherine Jardine, Paul Mclaren, Fanus Dreyer, Paddy Collins, Jennifer Edwards, Susan Moug, Kevin Rooney, Erin Mcilveen, Steven Henderson, Linda Graham, Gail Stark, Lynn Taylor, Mark Munro, Lynn Stewart, Natalie Dickinson, Laura Rooney, Lindsay Bailey, Diane Murray, Tim Geary, Simon Gibson, Colin Pow, Kerwei Tan, Richard Stevenson, Ewen Harrison, Peter Lamb, Kate Carey, Laura Fitton, Fabian Cook, Magen Schwarz, Alan Morrison, Gavin Bryce, Khaled Razouk, Kathryn Cain, Gudrun Kunst, Savvas Papagrigoriadis, Phil Hopkins, Adrian Fawcet, Britta O'Carroll-Kuehn, Amira Girgis, Stas Janokowski, Sami Farhat, Stella Vig, Nada Hadi, Anthony Parsons, Maurizio Cecconi, David Melville, Richard Hartopp, Justin Woods, Isabella Karat, David Gerrard, Edward Curtis, Krishnamurthy Somasekar, Tom Morgan-Jones, Michael Martin, Mark Henwood, Gordon Milne, Ajit Sivasankaranand, Alexandra Scott, Xavier Escofet, Piroska Toth-Tarsoly, Majed Al Shama, Valerie Hilton, Huw Davis, Gail Williams, Tim Harvard, Peter Fitzgerald, Dom Hurford, Tamas Szakmany, Babu Muthuswamy, Gethin Williams, Jack Parry Jones, Nick Mason, Ramesh Rajagopal, Shrisha Shenoy, Magdy Khater, Richard Morgan, Nikolaos Makris, Anil Hermandes, Andrew White, Guy Finch, Matt Outram, Jonny Wilkinson, Jennifer Spimpolo, Debbie Shaw, Marion Obichere, Giovanni Brescia, Flavia Menezes, Helena Stafford, Malcolm Watters, Chris Thorn, Julian Stone, Sam Andrews, Nicola Lythell, Helen Langton, Clare Stapleton, Stephen Baxter, Roy Fernandes, Rame Sunthareswaran, Alastair Ankers, Kumar Panikkar, Simon Sleight, Belinda Cornforth, Louise Bell, Phil Dodd, Fenella Welsh, Geoff Watson, Frankie Dorman, Guy Nash, James Bromilow, Fran Haigh, David Pogson, Stuart Mercer, Vanessa Tucker, Carolyn Way, James Kirby-Bott, Jenny McLachan, Rob Chambers, Rachael Craven, Jane Blazeby, Dan Freshwater-Turner, Lorna Burrows, Helen Howes, Iain Christie, Mark Coleman, Gary Minto, Sam Waddy, Grant Sanders, Abigail Patrick, Catherine Pitman, Susan Tyson, Hannah Smith, Guy Rousseau, Mark Cartmell, Jan Hanousek, Nigel Hollister, Lynsey Kightly, Mark Pulletz, Anjay Talwar, Susie Baker, Ruth Thomas, Richard Gibbs, Hamish Noble, Joseph Silsby, Helen Black, Thomas Evans, Robert DeBrunner, Nicola Cook, Stacy Hodges, Amanda Stevens, Rowena Felipe, Jonathan Paddle, Denzil May, Alison Pickford, Sid Riddington, Olga Tucker, Simon Smart, Jeremy Marwick, Nigel Suggett, Ewen Griffiths, David Riddington, Kathryn Gill, Neil Cruickshank, Jay Susarla, Emma Leno, Julie Colley, Andrew Burtenshaw, Stephen Lake, Jamie Greenwood, Sian Bhardwaj, Jessica Thrush, Julie Wollaston, Julian Sonksen, Rajan Patel, Adrian Jennings, David Stanley, Jenny Wright, Chris Horner, Faisal Baig, Katie Cooke, Jagdeep Singh, Andrew Claxton, Nazzia Mirza, Simon Hester, Georgia Knight, Peeyush Kumar, Taj Saran, Gabriele Marangoni, Roger Townsend, Andy Thacker, Anne Scase, Meghna Sharma and Beth Hale.
Contributors RMP, CJP, GPM, TS and the Enhanced Peri-Operative Care for High-risk patients (EPOCH) Trial group all contributed to protocol development and design of the EPOCH trial. DM, MPWG, SH, DC, SD, CJ and JL supported the EPOCH trial (data acquisition) through the National Emergency Laparotomy Audit database. TS conceived the idea for this paper, collated the data and led the analysis and write-up of results. RH contributed to the data analysis. All authors critically revised the content of the manuscript. All authors read and approved the final manuscript.
Funding The EPOCH trial was funded by the National Institute of Health Research of the UK (HS&DR – 12/5005/10). TS received a scholarship from the Florence Nightingale Foundation during the data analysis and writing of this manuscript.
Disclaimer The funder had no role in the design and conduct of the study; collection, management, analysis and interpretation of the data; or in the preparation, review or approval of the manuscript.
Competing interests TS, CJP, RMP and GPM received grant funding to design, deliver and evaluate the EPOCH trial. RP holds research grants and has given lectures and/or performed consultancy work for Nestle Health Sciences, BBraun, Medtronic and Edwards Lifesciences and is a member of the Associate editorial board of the British Journal of Anaesthesia. DM, CJ and SH received programmed activities for the roles in the NELA Project Team. MPWG received programmed activities for their role in the NELA Project Team, is a medical adviser for Sphere Medical Ltd and director of Oxygen Control Systems Ltd and received an honorarium and travel expenses from Edwards Lifesciences in 2016. TS received a scholarship from the Florence Nightingale Foundation during the data analysis and writing of this manuscript.
Patient consent for publication Not required.
Ethics approval The Enhanced Peri-Operative Care for High-risk patients trial was approved by the Research Ethics Committee of the National Health Service (REC reference 13/EM/0415).
Provenance and peer review Not commissioned; externally peer reviewed.
Data availability statement Data are available on reasonable request. Data may be obtained from a third party and are not publicly available.