Article Text

Statistics from Altmetric.com
Surgical site infection (SSI) rates are closely scrutinised by hospital committees seeking to identify opportunities to prevent these important complications. In most hospitals, SSI rates are displayed as a monthly or quarterly incidence using a bar or line graph with comparison with the hospital’s historical rate or some external benchmark.
The response to these data is usually dichotomous. Hospital committee members may make congratulatory statements if the incidence is decreasing, or alternatively express concern that action is needed if there is an upward trend. Some hospitals even formalise these reactions with red-amber-green designations, ignoring chance variation.1 2 It is striking that in clinical research we would never automatically accept any difference as being significant without demanding a more rigorous statistical analysis. Yet, when it comes to quality improvement, the direction of the change alone is often enough to generate assertive conclusions about the state of a hospital’s infection rates.
The challenge in the interpretation of SSI surveillance data has been to identify a method that can accurately discern a significant change in rates from the normal variation that is best acknowledged as being unchanged. Statistical process control (SPC) is increasingly used across healthcare to assist in answering this question.3 This method for measuring changes over time was originally used by Walter Shewhart, an American engineer, who first introduced it to the world of manufacturing in the 1920s. He was hired to improve the quality of telephone hardware, and observed that when the variation in production parameters was high the quality suffered. He became interested in using data to track performance over time using control charts (sometimes referred to as Shewhart charts in his honour), to prospectively ensure that parameters fell within the expected ‘chance-cause’ variation.4 Any deviation from this would prompt an assessment into possible causes for this change from a quality production standpoint. Applying this approach to infection surveillance allows easy differentiation between ‘common cause’ (random, natural) and ‘special cause’ (unnatural) variation, thus allowing hospitals to focus on variations that are potentially preventable through control efforts while avoiding a premature response to random increases that cannot be controlled.5 6
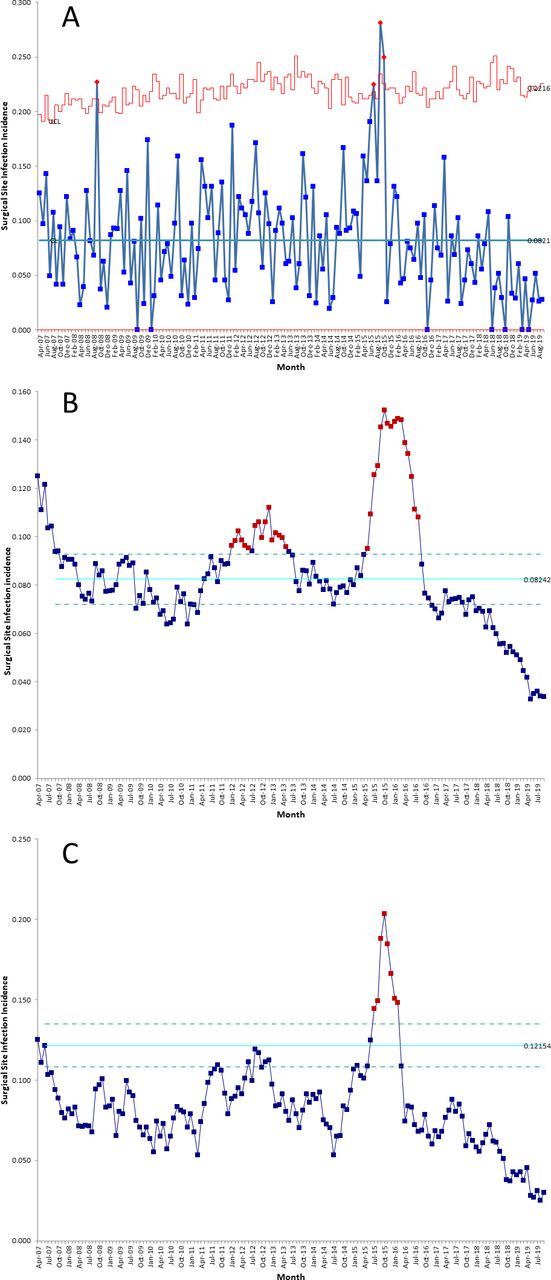
Control charts are not new to quality improvement in healthcare, and many institutions including our own have used them routinely to measure improvement.7–9 But not all SPC charts are the same and the parameters used can greatly influence their performance characteristics. The most common settings used to measure SSI rates are U-charts and P-charts, which provide the number of SSIs per monthly surgical cases or per cent SSIs, respectively. Control limits are typically set to three-sigma (equivalent to 3 SD), where consecutive points above or below the lower control limits represent a significant change equivalent to p<0.01.10 In practice, however, this approach has generally proven to be insensitive in detecting potentially important changes in SSI rates. For example, figure 1A displays a U-chart of the cardiac SSI rates at our institution over the past decade which fall nearly completely within common cause variation. Some authors have argued that risk-adjusted charts based on the standardised infection ratio improves sensitivity of standard control charts,6 but there is no accepted method for using SPC in SSI surveillance, leading to significant variation in practice.
Surgical site infection rates following coronary artery bypass graft surgery at an academic hospital displayed using (A) a U-chart set to three-sigma control limits; (B) a moving average chart with 12-month span, 18-month baseline and 6-month lag, set to one-sigma control limits; and (C) a moving average chart with 6-month span, 3-month baseline and 3-month lag, set to one-sigma control limits.
In the current issue, Ilieş et al 11 sought to identify the optimal use of SPC for SSI surveillance that would maximise detection of significant increases in SSI while minimising false alarms. They performed a rigorous analysis of over 16 550 different SPC charts across 58 community hospitals and 13 surgical procedures for a total of 331 hospital–procedure combinations that included over 5000 unique statistical signals of potentially important SSI rate increases. They compared three different SPC chart types including the traditional P-chart, the moving average (MA) chart, as well as the exponentially weighted MA chart. Each month that generated a statistically significant signal in at least one chart (n=2709) was reviewed by three independent epidemiologists to score the clinical significance of the change. These epidemiologists were able to use clinical information including infection type, infecting organism and surgeon, but were blinded to the chart type and parameters set to trigger each signal.
Their results determined that the best balance between sensitivity and specificity was achieved using a combination of two of the MA charts set at one-sigma control limits. The first MA chart had a 12-month span, 18-month baseline period and 6-month lag and used an external benchmark as the baseline. The second had a 6-month span, 3-month baseline period and a 3-month lag based on individual hospital data. Together the two charts were able to detect small sustained increases in SSIs as compared with external benchmarks as well as large, short-duration increases compared with the hospital’s historical performance, with a sensitivity of 0.90 and a specificity of 0.67.
What does this mean in practice? For those who have used SPC charts to measure improvement, relying on one-sigma control limits represents a significant ‘shift’. The traditional application of SPC has used three-sigma control limits to ensure that any signal represents a statistically significant change. But the goal is different in infection surveillance. SPC provides a mechanism to identify potentially relevant signals in SSI rates that should prompt an investigation to determine if there are preventable factors that need to be addressed. In other words, the prospective use of these MA charts can be a safety mechanism resembling Shewhart’s original use of SPC: to rapidly identify and address any parameters that could indicate a problem.
While the method proposed by Ilieş and colleagues11 carries considerable promise for standardising SPC methodology used for SSI surveillance, some questions require answering before calling for widespread adoption of this approach. The performance characteristics were derived from SSI data generated from the Duke Infection Control Outreach Network, a large network of American community hospitals, but further validation across other healthcare settings is needed. Wider spread adoption of SPC methodology for SSI surveillance will also require improved knowledge and accessibility of SPC software by infection prevention teams and hospital epidemiologists. Some experts have created an open source database with an automated SPC chart generator that can be used by facilities to easily create control charts using their own surveillance data.12
We incorporated our cardiac SSI surveillance data into the MA charts recommended by Ilieş et al and found that the increase in SSI rates noted in 2015 using our U-chart could have been detected 2 months earlier using this method (figure 1B,C). An additional signal was identified in January 2012 that, using traditional surveillance, did not register as significant on the U-chart and was only noted anecdotally during a cardiac surgery SSI meeting 5 months later. Our experience suggests that this method would have allowed earlier intervention on these occasions, but a prospective evaluation is needed. And, in fact, a multicentre, randomised controlled trial is under way to confirm whether traditional SSI surveillance can be augmented using this approach.13
Increased emphasis has been placed on public reporting and benchmarking of healthcare-associated infection in recent years, but ensuring a standardised approach between institutions remains a challenge.14 SPC methods have always offered a robust method for identifying true signals amidst the noise of random variation. But the approach employed by Ilieş and colleagues offers a promising new method for earlier detection of signals worth investigating. Future standards for SSI surveillance will likely incorporate this method for analysing and interpreting temporal trends.
References
Footnotes
Correction notice The article has been corrected since it published onlie first. The middle initial of the co-author was missing which has been amended to Jerome A Leis.
Contributors Both authors contributed to the preparation of this manuscript.
Funding The authors have not declared a specific grant for this research from any funding agency in the public, commercial or not-for-profit sectors.
Competing interests None declared.
Patient consent for publication Not required.
Provenance and peer review Commissioned; internally peer reviewed.