


In the United States, nearly 500,000 cases of hospital-onset Clostridium difficile infection (CDI) occur annually, with ∼29,000 deaths.Reference Lessa, Mu and Bamberg1 Infection prevention teams attempt to reduce this incidence using many approaches: decreasing patient contact with CDI spores, bleach-based or terminal room cleaning, contact precautions, personal protective equipment (PPE), hand hygiene, and antibiotic stewardship programs.Reference Leffler and Lamont2 Despite these efforts, CDI is still a prominent healthcare-associated infection (HAI), suggesting additional factors may facilitate transmission.
Although prevention efforts to reduce exposure in the immediate patient environment are well established,Reference Leffler and Lamont2,Reference Widmer, Frei and Erb3 little has been done to analyze how inpatient mobility between units may influence CDI transmission. Inpatient mobility (transfers) increases contact opportunities, making risk of CDI transmission difficult to measure. Current retrospective surveillance methods, primarily contact tracing, are used to examine CDI transmission,Reference Otete, Ahankari and Jones4 but may not prevent future outbreaks.Reference Hellmich, Clements and El-Sherif5 To construct a prospective surveillance method for CDI, it is essential to examine indirect contact opportunities due to patient mobility. One potential method is to assume broad environmental exposure based on physical location in the hospital, namely inpatient units. Patients may be transferred between units during their stay, which occurs more frequently with severe illnesses, precisely the setting in which CDI risk is high. Each inpatient transfer provides additional opportunities for CDI exposure. Thus, combined with patient specific risk (eg, antibiotic treatment, immunosuppression), the mobility of patients between hospital units is likely an important risk factor for CDI transmission within hospital units.
In this study, we built an in-hospital patient mobility network and analyzed the relationship between network measures and CDI at the hospital-unit level.Reference Newman6 Network analysis has been used to examine interhospital transfers and ambulatory care,Reference Donker, Wallinga and Grundmann7–Reference DiDiodato and McArthur9 but studies of intrahospital mobility are limited.Reference Curtis, Hlady, Kanade, Pemmaraju, Polgreen and Segre10,Reference Cusumano-Towner, Li, Tuo, Krishnan and Maslove11 We quantified the degree of unit connectedness using network centrality, a class of network measures.Reference Newman6 We hypothesized that centrality measures can quantify inpatient unit risk of CDI related to patients with CDI moving between units. We considered the relationship of hospital-onset CDI: unit (population) susceptibility, patient mobility, and environmental exposure. We describe 2 practical clinical tools that could be implemented in facility EHR systems to quantify and visualize this relationship, providing infection prevention teams with easily interpretable, prospective data with which to identify units at risk for CDI. This application goes beyond the current measures of identifying individual patient CDI riskReference LaBarbera, Nikiforov, Parvathenani, Pramil and Gorrepati12–Reference Oh, Makar and Fusco15 and further examines population risk of CDI.
Methods
Human subjects protection
This proposal was reviewed and approved by the University of Rochester Human Subjects Review Board (protocol no. RSRB00056930). Data were coded such that patients could not be identified directly in compliance with the Department of Health and Human Services Regulations for the Protection of Human Subjects (45 CFR 46.101(b)(4)).
Data source and study population
Deidentified patient electronic health record (EHR) data from a 739-bed hospital in New York State were acquired for a 2-year period from approximately January 2013 to December 2014 (n = 209,694). These records included patient demographics, medication administration, International Classification of Disease, Ninth Revision (ICD-9) diagnosis codes, laboratory test results, and individual hospital unit admission data.
An admission was defined as an inpatient stay ≥24 hours on a hospital unit, either via the emergency department (ED) or directly. This definition ensured inclusion of patients at risk of exposure to CDI as a hospital-onset case, with a positive CDI test result during their current admission. Multiple admissions for single patients were included because individual transfer and susceptibility data contribute to overall unit susceptibility regardless of CDI case classification. Newborn, neonatal, and pediatric patients were excluded because they are not considered to be an at-risk population for CDI. We adopted the following inclusion criteria: admission to a hospital unit beyond the ED, admission >24 hours, and patient age >18 years. Ultimately, we gathered data on 72,636 admissions that occurred over 2 years.
A positive CDI outcome was defined by enzyme immunoassay (EIA) and nucleic acid amplification test (NAAT), and was further categorized as hospital onset (ie, positive test occurred after a negative test, or 24 hours after admission) or community onset (ie, positive test within 24 hours of admission) because we did not have access to infection control data to further specify National Healthcare Safety Network (NHSN) standards.16 Variables such as length of stay and medication administration (eg, antibiotic, proton pump inhibitor, and histamine H2-receptor (H2) antagonist) were adjusted to capture administration prior to a patient’s first positive CDI test.
Network construction
Relative inpatient unit admission date and time were used to construct a 2-year inpatient mobility network. Weekly unit-to-unit transfer rates were calculated using the following equation (Eq 1):
 $${{\mu}_{xyW}} = {{{Y_{1,w}} + {Y_{2,w}}} \over 2},$$
where µxyW is the patient transfer rate between units x → y in week W, x is the transferring unit, y = receiving unit, W is the calendar week, Y 1,w is the weekly data from year 1, and Y 2,w is the weekly data from year 2. Total weekly transfers from units x → y for each calendar week were calculated by averaging the total weekly transfers across 2 years of data.
Centrality measures, statistical values representing the connectedness of individual nodes in the network, were calculated for each node.Reference Newman6,Reference Donker, Wallinga and Grundmann7 Network construction and centralities were performed using R version 1.0.143 (R Foundation for Statistical Computing, Vienna, Austria), Python-igraph (https://igraph.org/python/) and graph-tool (https://graph-tool.skewed.de/), and Gephi version 0.9.2 software (https://gephi.org/users/download/).
Statistical analysis
To capture patient CDI susceptibility within each inpatient unit, a logistic model was constructed using the training and test-set method,Reference Kuhn and Johnson17,Reference Wei and Dunbrack18 with the outcome of hospital-onset CDI as defined above. Data were randomly split 7:3, and hospital-onset CDI cases were randomly split by the same ratio. The resulting training set had n train = 50,845 patients with c train = 321 CDI cases, and the test set had n test = 21,791 patients with c test = 138 CDI cases.
Purposeful model selection,Reference Bursac, Gauss, Williams and Hosmer19 a method designed to include variables of clinical significance that would have been omitted using traditional statistical significance testing (P < .05), was used to construct a predictive model for hospital-onset CDI. The P-value cutoff points for first univariate, multivariate, and second univariate steps were 0.2, 0.05, and 0.15, respectively. Daily mean individual patient risk (susceptibility) of CDI was calculated using the logistic model, and the overall mean unit susceptibilities were calculated based on patient unit residence for that day using the following equation (Eq 2):
 $${S_{Ud}} = {\sum {S_{Id}} \over {N_U}},$$
where S Ud is the daily susceptibility of a given unit and S Id is the susceptibility of individual patients residing in that unit that day, divided by N units. Association between overall mean unit susceptibility (outcome variable) and unit centrality (predictor) in the mobility network were determined using multivariate linear regression.
To quantify inpatient mobility, unit susceptibility, and current infections in the hospital, we derived a new and unique network centrality measure, contagion centrality. This term has also been used to describe the risk of cascading financial failure in interbank networks.Reference Markose20 Contagion centrality was calculated for each unit on every admission day using the following equation (Eq. 3):
 $$C{C_y} = \sum {S_y}{F_{xy}}{I_x}$$
where CC y is the contagion centrality of receiving unit, S is the mean unit susceptibility, F = patient flow (transfer rate), I is the current number of CDI infections, x is the transferring unit, and y is the receiving unit, which can also be called the SFI statistic. The contagion centrality metric was evaluated using linear regression, with an outcome of actual CDI cases, unit-specific variance, and distribution. Regression, contagion centrality calculation, and data visualizations were performed using R version 1.0.143 and Wolfram Mathematica version 11.3 (Wolfram Research, Champaign, IL).
Results
Network
We constructed an inpatient mobility network using trace-route mapping,Reference Rosenberg21 which yielded 40 nodes (inpatient units) and 1,003 unique edges (unit-to-unit transfer pairs). Several units did not have direct transfers to other units in our hospital and did not contribute risk of CDI transmission to other units; thus, they were unsuitable for our predictive tools. The network is shown in Supplementary Fig. S1 (online) using a conventional graph.
Unit susceptibility
We performed logistic regression to identify variables significant for individual patient CDI, yielding an AUC (area under the curve) of 0.81, sensitivity of 0.75, and specificity of 0.71 at a threshold of 0.006 (0.6% of the patient sample of n = 72,636 presented hospital-onset CDI) (Table 1).
Table 1. Time-Sensitivea Clostridium difficile Infection (CDI) Multivariate Logistic Model Selection
Note. HIV, human immunodeficiency virus; PPI, proton pump inhibitor.
a Medication administration variables occur prior to first positive CDI lab.
The HIV confidence interval was statistically insignificant, resulting from initial variable elimination in purposeful model selection. Subsequently the predictor was re-added into the model later due to the more lenient cutoff points discussed in the Methods section.Reference Bursac, Gauss, Williams and Hosmer19,Reference Hosmer, Lemeshow and May22,Reference Hosmer and Lemeshow23 Despite a low HIV prevalence in this dataset (n = 3), this variable may highlight the clinically significant CDI risk factor of immunosuppressionReference Revolinski and Munoz-Price24 and contributes to the overall accuracy of the predictive model in conjunction with the other predictor variables.
Daily unit susceptibilities were averaged over the 2-year period of the dataset. We used linear regression to compare overall unit susceptibility to unit network centrality measures and to determine whether susceptibility can be predicted by how connected the nodes are via patient transfers. We next compared linear regression models for CDI susceptibility: (1) full admission variables with (2) censoring to include only values prior to CDI diagnosis (Table 2).
Table 2. Mobility Network Centrality Multivariate Linear
a Model does not contain time-sensitive medication administration variables (ie, variables included if they occur at any point during a patient admission).
b Model contains time-sensitive medication administration variables occurring only prior to first positive CDI lab.
c NA values in time-sensitive model indicate the centrality measure was not statistically significant and was left out of the model.
The regression model outcome for full-admission variables includes susceptibility variables from the logistic regression step prior to recalculation and capturing the entire admission as opposed to just the period prior to the first positive CDI laboratory test (ie, a time-sensitive variable outcome). Using purposeful model selection, 4 centralities were identified having a statistically significant association with full-admission model susceptibility: in-degree, weighted in-degree, closeness, and PageRank. In contrast, time-sensitive model susceptibility was only statistically significant with closeness centrality.Reference Newman6 Additional centralities (ie, out-degree measures, eigenvenctor, betweenness) were considered, but these either exhibited correlation with other centralities or were eliminated in model selection.
The difference between these 2 models lies in which part of the patient admission is most significant. Incoming transfers are best captured by closeness, weighted in-degree, and in-degree, whereas the importance of both incoming and outgoing transfers is captured best by PageRank. PageRank ascribes higher value to nodes linked with other high-value nodes.Reference Newman6 PageRank is typically known as the algorithm that orders the results of a Google search query; however, in a hospital network, a unit with high PageRank receives more patients from high-centrality units and then distributes them to other high-centrality units.
We conclude that PageRank centrality is useful for examining the full patient admission for all-cause CDI cases. In contrast, the statistical significance of closeness centrality with time-sensitive outcomes suggests that incoming transfer edges are important when analyzing susceptibility of hospital-onset CDI cases.
Inpatient mobility
Generating a mobility network graph allows us to compare hospital unit closeness to overall susceptibility and to visualize transfers in unit communities (Fig. 1). Larger node size indicates a higher value of either closeness or susceptibility (depending on which network is being viewed), and smaller node size indicates lower values. The node coloring indicates unit communities within the network and is denoted by groups A through G (see group classifications in Supplementary Table S1 online).
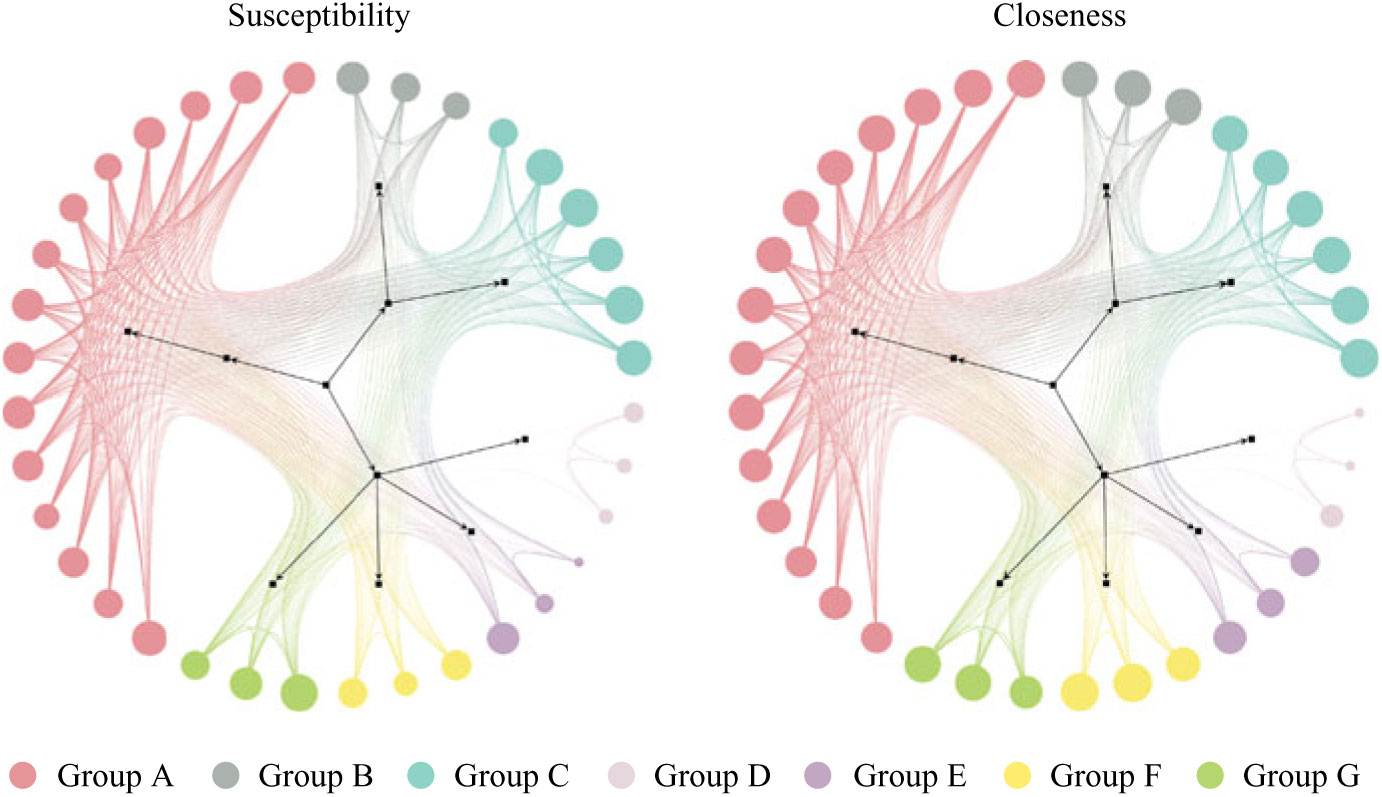
Fig. 1. Patient mobility networks. Node size depicts normalized “susceptibility” and “closeness,” respectively. Not all nodes depicted in graphs. Unit group classifications can be seen in Supplementary Table S1 online.
Units with high closeness tend to have higher CDI susceptibility and vice versa, however, with some exceptions (groups D, E, and F). Units in Group F may tend to be the last units in a patient’s journey (low susceptibility), with high incoming rates and low outgoing transfer rates to other units (high closeness). The units in groups D and E may tend to transfer among each other without receiving or redistributing patients back into the network (low closeness), but they sometimes have patients with higher susceptibility.
Contagion centrality
To account for these exceptions while still capturing the important relationship of closeness to susceptibility in other units, we adapted the contagion centrality measure to CDI. The term “contagion centrality” was originally developed to explain the spread of financial instability in an interbank networkReference Hosmer, Lemeshow and May22 and was used to quantify the risk of a “spillover effect” or rapid spread of fear of financial instability to predict bank failure. Thus, failure of a bank with high financial contagion centrality will likely increase the risk of failure for the other banks it is connected to. In contrast, CDI contagion centrality reflects the likelihood that a unit will receive patients from other units with high CDI incidence. CDI contagion centrality is built from patient data within the current unit (quantifying increased risk of CDI susceptibility) and from those units directly transferring into that unit. Contagion centrality considers the flow of incoming transfers captured by closeness (F), but adjusts for susceptibility (S) and current infections (I). For example, a unit with high susceptibility (S) receiving many patients from units with CDI present (high F and I) would, in turn, have a high contagion centrality and high risk of CDI appearing. The units with highest overall contagion centrality (normalized between 0 and 100) are the acute medicine units 4, 1, 3, and 2 (contagion centrality values = 100, 99.9, 99.9, and 99.7, respectively).
Metric validation
The contagion centrality metric validation involved 3 steps: (1) linear regression, (2) sensitivity analysis, and (3) variance analysis. A linear regression model with the outcome of actual CDI cases (P < .05), supported the hypothesis that inpatient transfer rates are associated with hospital-onset CDI (Fig. 2).
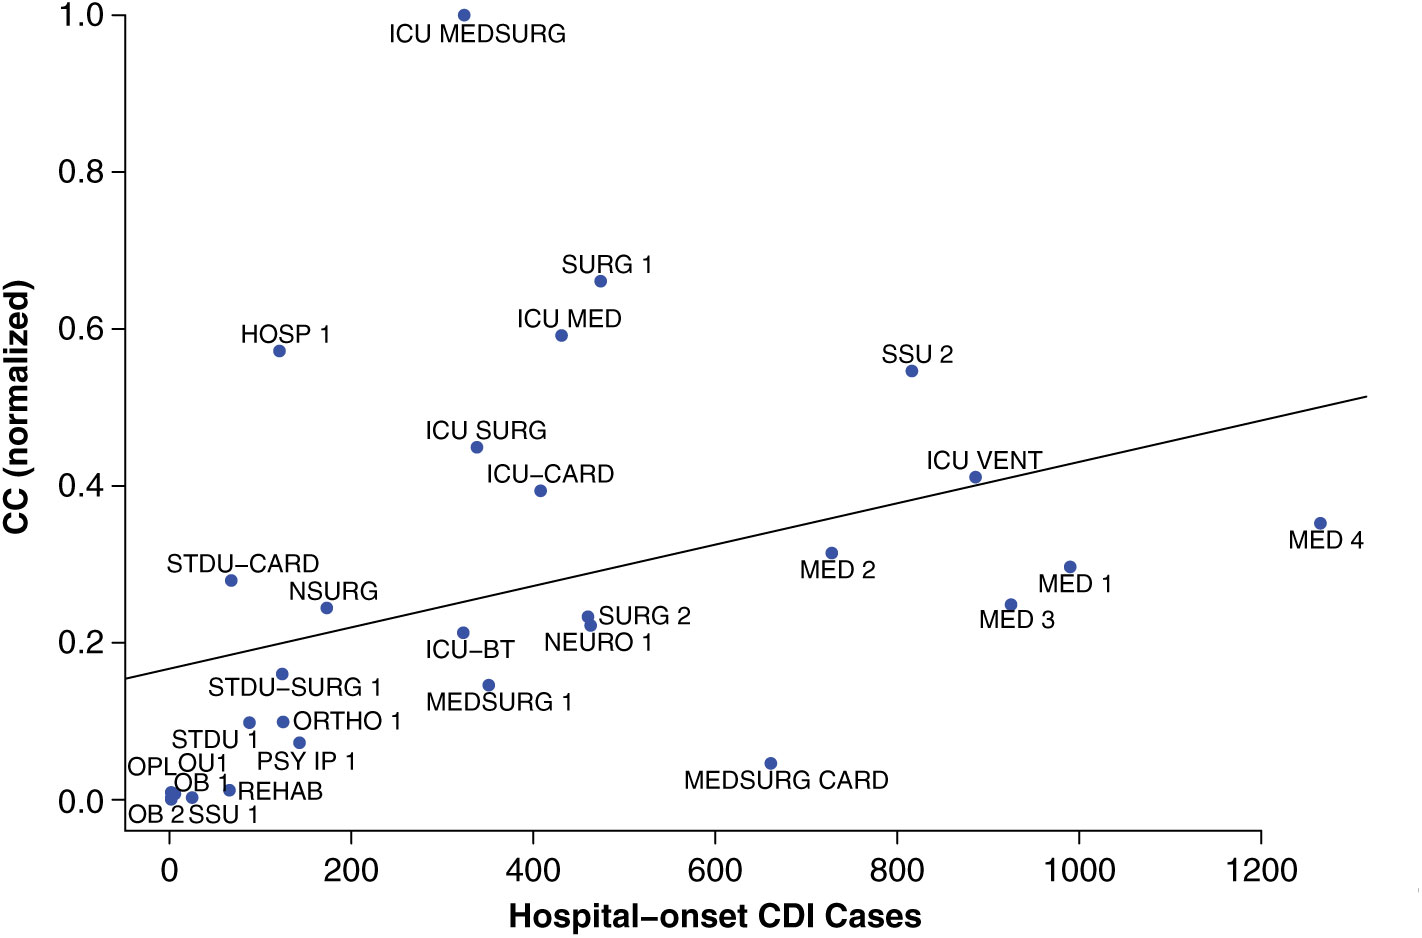
Fig. 2. Linear regression validation plot. Unit abbreviation definitions can be seen in Supplementary Table S1 (online).
Notably, intensive care units (ICUs) are an exception to this pattern, as demonstrated by fluctuation plots of unit-specific contagion centrality over the 2-year data period (Fig. 3).
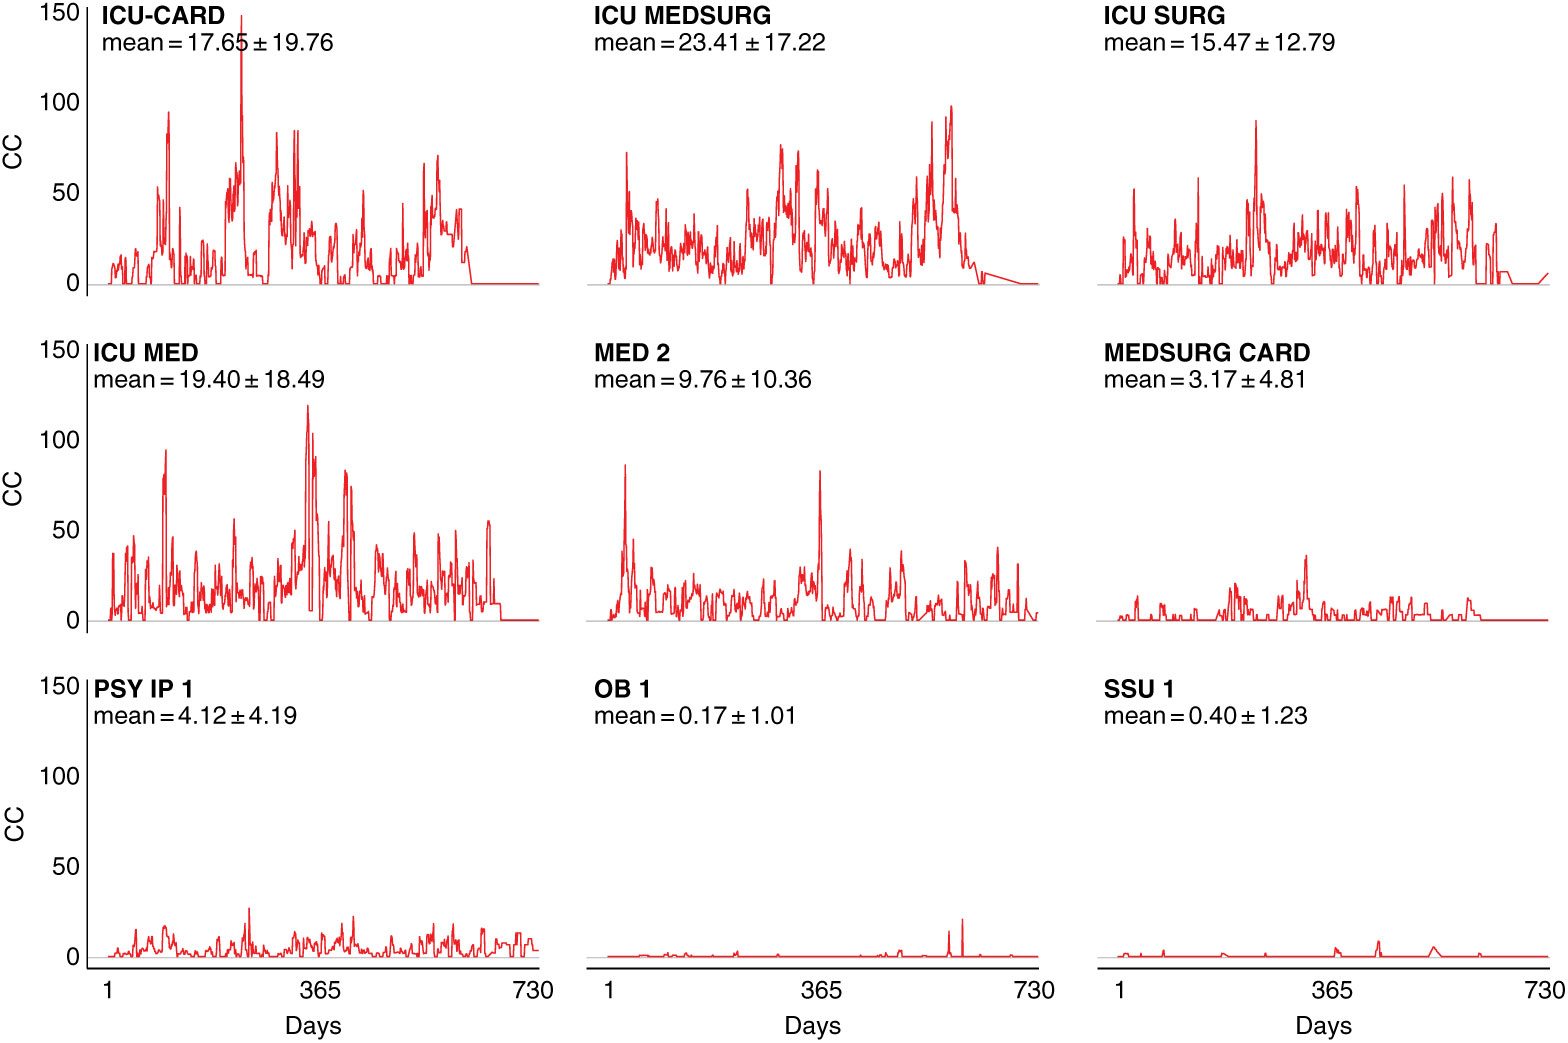
Fig. 3. Contagion centrality flux diagram. Unit abbreviation definitions can be seen in Supplementary Table S1 (online). Note: CC, contagion centrality; days, all dates spanning 2-year dataset.
Figure 3 examines contagion centrality variation, which was greater in ICUs likely due to higher unit susceptibility, suggesting that contagion centrality captures unit-specific factors. Unit-specific contagion centrality interquartile ranges, median, and outlying values were also examined, and they confirmed the findings from the fluctuation analysis. The units with the smallest and largest contagion centrality ranges were the psychiatric and obstetric units, and the intensive care and cardiovascular surgery progressive care units, respectively (Supplementary Fig. S2 online). These findings also suggest that contagion centrality should be interpreted on a unit-specific basis because it captures unit-specific variability.
Clinical tools and application
Highlighting the effect of incoming inpatient transfers for unit-wide susceptibility of hospital-onset CDI through the contagion centrality metric can help infection prevention teams identify at-risk units, and it provides additional contextual data (eg, transfers, unit-specific patient susceptibility, current infection) for targeted infection prevention. To illustrate this, we plotted the components of contagion centrality (unit susceptibility vs flow of infection) by day, graphically highlighting the factors contributing changes in contagion centrality (ie, flow of infection or unit susceptibility) (Fig. 4).
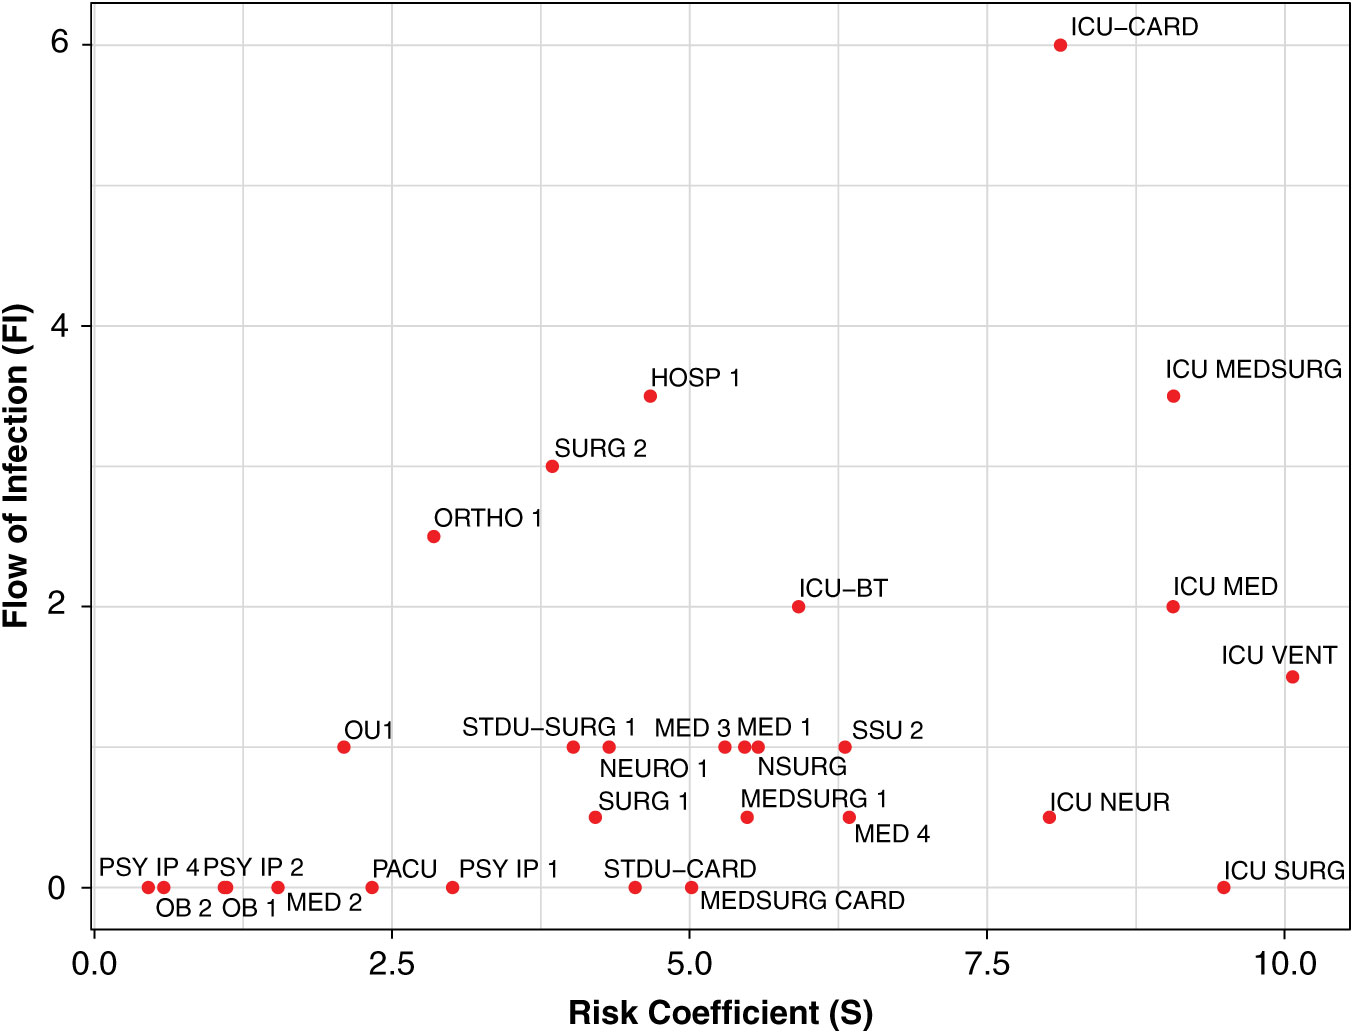
Fig. 4. Daily contagion centrality plot. Unit abbreviation definitions can be seen in Supplementary Table S1 online.
Figure 4 shows all unit contagion centrality values on a sample date. Units with higher flow of infection (y-axis) may have an increased contagion centrality due to more transfers or potential transfer of infection into that unit. Units with higher susceptibility (x-axis) may have an increased contagion centrality due to the patients they currently have in their unit that day and their susceptibility to infection.
To supplement the calculation plot, we also developed an active surveillance tool showing overall unit change (units with the most positive or negative changes are highlighted) and subplots of changes in unit-specific weekly CDI contagion centrality (Fig. 5). Change plots allow monitoring of weekly change in all units simultaneously, as well on a unit-specific basis, but they still identify factors contributing to a high or low CDI contagion centrality. Use of these tools together may provide unique and active surveillance measures to prevention teams, and they may help hospitals prepare for heightened, unit-specific CDI infection risk (eg, increased hand hygiene and PPE usage, targeted patient isolation, or minimizing transfers to high-risk units).
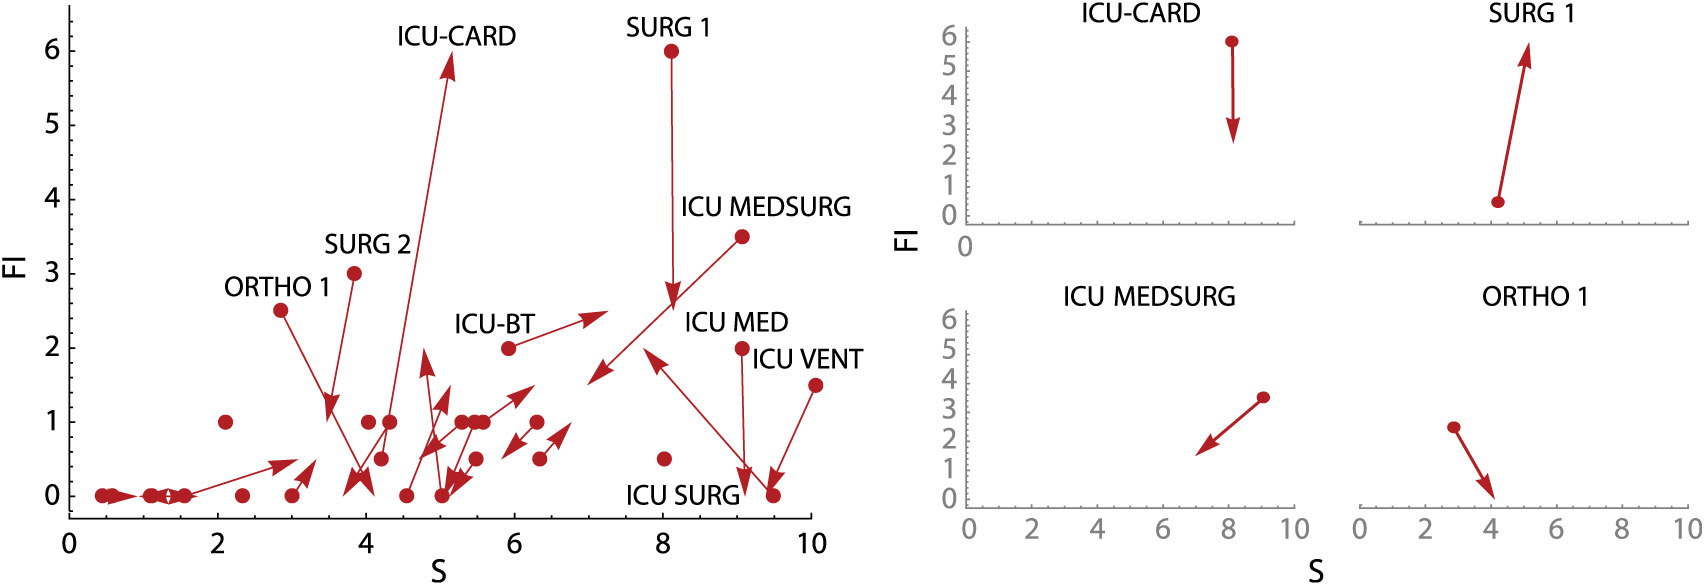
Fig. 5. Weekly contagion centrality change plots. Overall plot (left) shows change in all inpatient units in a 7-day period, and unit plots (right) show change in select individual inpatient units in a 7-day period. Unit abbreviation definitions can be seen in Supplementary Table S1 online. Note: S, susceptibility; FI, flow of infection.
Discussion
To our knowledge, this is the first clinical tool for the prediction and surveillance of hospital-onset CDI accounting for hospital mobility and generalized population risk from patient environment and healthcare worker contact. The inpatient mobility network construction and analysis are strengths of this study. Prior literature has focused primarily on interhospital transfersReference Donker, Wallinga and Grundmann7–Reference DiDiodato and McArthur9 as opposed to intrahospital transfers.Reference Curtis, Hlady, Kanade, Pemmaraju, Polgreen and Segre10,Reference Cusumano-Towner, Li, Tuo, Krishnan and Maslove11 Here, we quantitatively show that higher incoming transfer rates from units with higher numbers of CDI cases are statistically associated with new cases of hospital-onset CDI on the receiving unit. The contagion centrality measure and proposed prevention tools can be tailored to the specific transfer patterns and patient risk factors in any facility. They can even be adapted to different infections that require moderate proximity or contact.
The limitations of this study include the use of inpatient, but not outpatient, medication administration data. It is likely that patients received an antibiotic, an H2 antagonist, or a proton pump inhibitor medication from outside providers prior to their admission, a susceptibility that cannot be captured by the data available for this study. Future work would benefit from capturing outpatient medications prior to hospitalization. Another limitation is the lack of formal infection prevention hospital onset classification as reported to the National Healthcare Safety Network (NHSN).16 This classification standard is typically complex and cumbersome, requiring individual case review. Our approach is simpler and EHR driven, classifying hospital-onset cases as those occurring >24 hours after admission or after a previously negative lab but may slightly overestimate hospital-onset CDI cases. Several other limitations of this work are situational. Units with low susceptibility but high hospital-onset CDI rates may indicate the importance of factors not captured by our model (eg, decreased hand hygiene, environmental contamination). These data were not available to us for this study, and they would likely increase the accuracy and utility of this approach.
Future studies may benefit from network analysis of unit community clustering to determine the risk of hospital-onset CDI on unit communities instead of single units, as well as further calibration analysis to determine prediction probabilities by unit. Each hospital unit in our data exhibited different levels of contagion centrality variation during the period immediately prior to CDI cases, suggesting different predictive periods for each unit. Implementation of contagion centrality and the associated visualization tools in a hospital or facility should be performed to further validate our model, to highlight facility-specific changes that should be made to better capture CDI outbreak risk, and to allow for intervention development to measure and reduce risk of hospital-onset CDI.
Finally, it is important to recognize the impact of inpatient mobility on risk of infection, as well as the need for more targeted, prospective infection prevention tools. This study quantifies the significant association between inpatient transfers and unit risk of CDI, and it provides the first attempt to our knowledge to actively measure and predict CDI in patient populations.
Supplementary material
To view supplementary material for this article, please visit https://doi.org/10.1017/ice.2019.288
Acknowledgments
We would like to thank Dongmei Li, Solomon Abiola, and members of the Rochester Center for Health Informatics at University of Rochester Medical Center for helpful discussions regarding the statistical analyses. The content is solely the responsibility of the authors and does not necessarily represent the official views of the National Institutes of Health (NIH) or Burroughs Wellcome Fund (BWF).
Financial support
This work was partially funded by the University of Rochester Clinical and Translational Science Institute (grant no. UL1 TR002001), and by the National Center for Advancing Translational Sciences (NCATS), a component of the National Institutes of Health (NIH grant nos. TL1 TR000096 and TR002000). Additionally, this work was funded by the Translational Biomedical Science PhD Program at the University of Rochester School of Medicine and Dentistry from the Burroughs Wellcome Fund Institutional Program Unifying Population and Laboratory Based Sciences (grant no. 1014095 BWF).
Conflicts of interest
The authors have no conflicts of interest to disclose.


 Open access