


Abstract
Retrospective records reviews carried out in several countries have shown substantial rates of adverse events (AE) among hospitalized patients, preventable in half the cases. As no such data have been recorded in Switzerland, we estimated the incidence of AE in one acute care hospital as a basis for a safety improvement program.
A two steps retrospective records review (screening criteria and full review of positively screened records).
A medium size community hospital.
A stratified sample of 400 surgical and 600 medical hospitalizations whose records fulfilled a set of information quality criteria.
Not applicable.
Adverse events, preventable adverse events and extent of resulting harm.
The proportion of hospitalizations with at least one AE was 12.3% (95% CI: 10.4–14.1) whereas the overall hospital incidence rate was 14.1% (95% CI: 12.0–16.2). Nearly half of AE were judged preventable, corresponding to one or more preventable AE in 6.4% of hospitalizations (95% CI: 5.0–7.8). Sixty percent of AE resulted in no or minor impairment at discharge whereas 23% resulted in severe disability. AE were twice more frequent in surgical patients, and preventable AE resulted more often in severe impairment than unpreventable AE. No death was attributed to an AE. The proportion of stays with an AE increased with age and length of stay.
The incidence of preventable AE in patients hospitalized in one Swiss hospital is comparable to previously reported rates. Further, patient safety improvement is needed, especially among older patients, and for surgical procedures.
Introduction
Retrospective review studies have shown that 3–17% of patients in acute care hospitals experience one or more adverse events (AE) caused by hospital care, resulting at least in prolonged hospital stay [1–13]. In these studies, carried out in various countries, often nationwide, ~50% of the AE were considered avoidable. Although no such medical records review has been carried out in Switzerland yet, there is no doubt that awareness of medical harm and efforts to reduce it exist in Swiss hospitals. Most have voluntary reports of AE and an incident review committee for their analysis [14], active clinical surveillance of specific types of events (such as surgical site infections, anaesthesia incidents, hospital acquired infections or decubitus ulcer) [15], and a few have morbidity and mortality conferences. However, all these methods give only a partial picture of AE. Reporting systems, operating generally at local level, are strongly dependent on the willingness of staff and local quality culture [16]. Safety indicators based on routinely collected data are promising to allow hospitals to benchmark their performance but most suffer from validity concerns due to medical information inaccuracy or incompleteness and case-mix bias [17, 18].
In spite of their limitations (dependence on information noted in medical records and only fair reliability of the reviewer judgement), retrospective records reviews remain a comprehensive and commonly used method for assessing the nature, incidence and impact of inpatients AE [19, 20]. Although prospective observation of patient care could offer better accuracy of the detection of AE, higher effectiveness of identifying those preventable and better analyses of causes leading to AE, heavy workload and costs constitute strong limitations to such surveys [21].
We aimed to measure the occurrence of AE related to hospital care in one hospital that engaged in a safety management program. The hospital quality and safety committee needed to know the frequency and type of AE in the entire institution to better tailor safety initiatives.
Methods
Setting
The study consisted of a cross-sectional survey in one medium size community hospital, collecting data retrospectively from medical records. The hospital provided services for ~10 000 hospitalizations per year, dealing with all areas of medicine and surgery, except ophthalmology and highly specialized interventions conducted in designated centres. The source population included all acute care hospitalized cases discharged between 1 January 2008 and 31 December 2008, excluding hospitalizations motivated by a psychiatric diagnosis (International Classification of Diseases; 10th Revision (ICD-10), primary diagnosis codes: F00-F99), healthy new-born and deliveries without a surgical operation. A random sample of hospitalizations, stratified according to type of stay, surgical or medical was selected. A surgical stay was defined as an operative procedure that could not be carried out in an ambulatory setting [22]. This population was followed from 1 July 2007 until 1 July 2009. Assuming an AE incidence of 12.5% among surgical stays and of 9.5% among other stays, the sample size (surgery: 400; other stays: 600) was chosen to obtain confidence intervals (CIs) of 3 and 2% around the estimate. The study obtained approval from the ethics committee of canton Vaud.
Definitions
We defined an AE as injury or unintended complication caused by healthcare rather than by the patient's disease and resulting in permanent or temporary disability at time of discharge, death or prolonged hospital stay of at least 1 day. Injuries with no evidence of causation by care management were considered as natural complications, and were not taken into account. The time frame of included events was as follows. We counted AE that occurred during the index admission, which were detected either during the index or during a subsequent hospital admission over the following 6 months period. We also counted AE that were related to a hospital admission within the preceding 6 months but only detected during the index admission. This time frame was used in several earlier studies [8, 23].
The patient's harm was rated according to the degree of impairment in a body function resulting from the AE (none, mild, moderate, severe, complete and death) at discharge, its expected duration in the following 6 months (complete recovery, partial recovery or no recovery) and whether the event required or not an intervention to sustain life. Impairment with minimal impact on daily life was considered mild; moderate when interfering in the person's daily life in <50% of the time; severe when at least partially disrupting the person's daily life in >50% of the time; complete when it disrupting the person's daily life in > 95% of time [24].
Judging the preventability of an AE is a difficult issue. Most studies have used implicit professional judgement on a six-point scale, from no evidence to virtually certain evidence of preventability, defining as preventable an AE rated at least four. However, agreement between reviewers on the event's preventability, usually measured by kappa coefficient, has been only fair or moderate, varying from 0.24 to 0.61 across studies [1, 3, 11, 21, 25, 26]. Consequently, we grounded the preventability on the cause assigned to the AE chosen in a pre-defined list, an a priori preventability judgement being attributed to each cause, based on a literature review and study team consensus. We retained three categories: clearly avoidable cause such as diagnosis error; clearly unavoidable cause such as expected side effects of a drug (e.g. chemotherapy induced febrile neutropenia); a priori undetermined status such as hospital acquired infection requiring interpretation of the information retrieved from the medical record for rating preventability. Our definition did not imply that a specific caregiver was responsible for harm. A bleeding on warfarin would be rated as preventable in the setting of supra-therapeutic international normalized ratio (INR) despite no overt error of the part of the physician but unavoidable in the setting of therapeutic INR. Surgical site infection was considered preventable unless the wound was dirty before operation, or overt immunosuppression. The classification of causes with their preventability is listed in Appendix A. Potentially preventable AE included preventable AE and those with undetermined preventability.
Data sources and collection
We used a two stages review of hospital charts. First, the reviewer (trained physician or nurse) assessed each selected hospital chart for the presence of at least one screening criteria known to be sensitive to the occurrence of an AE (see Appendix B). These criteria, based on the Adverse Patient Occurrence inventory (APO) seminal tool, have been updated along studies [26]. Our criteria were similar to those used by Michel et al. [27]. All positive charts for a screening criterion were then reviewed by a physician to identify the presence of AE and to determine the clinical process that potentially caused the AE, its impact and the degree of preventability according to the definition described above.
Because the sensitivity of AE detection depends on the medical chart completeness, we assessed the quality of each sampled medical chart before inclusion against a set of criteria used elsewhere for hospital accreditation (see Appendix C). Charts that did not comply with all criteria were excluded.
For each selected hospital stay, the reviewer also had access to a standardized report of all routinely collected computerized data: ICD-10 diagnoses codes, Swiss classification procedure codes (referred to as CHOP, adapted from the International Classification of Diseases, 9th Revision, Clinical Modification, ICD-9-CM), procedure dates, origin and discharge location, urgent admission or not, admission and discharge dates. He could thus confront coded information with medical record data and be warned by diagnoses or procedures codes suggesting a complication.
The reviewer could modify the a priori judgement on preventability attributed to causes’ classification, provided he justified his choice. When the a priori preventability was rated undetermined, the reviewer was instructed to opt, as far as possible, for avoidable or unavoidable, based on all available information. All remaining cases of undetermined preventability were discussed on the basis of the medical summary prepared by the reviewer.
The review team consisted of three physicians, two junior physicians, and one senior board certified internist (P.H.) who had already conducted several large reviews of medical records in the field of patient safety, and a nurse trained in data extraction from medical reviews.
The two physician reviewers were trained until the consensus on AE detection measured by kappa coefficient between them reached 0.75. For this purpose, several series of 20 records were assessed by the two reviewers; all discordances were discussed with the principal investigator to reach a consensus. The two reviewers thus assessed 161 records. The kappa coefficient, which was 0.5 on the first series, reached 0.75 on the last one. These records were used as a gold standard, against which we evaluated the performance of the nurse, who was trained until concordance reached a kappa value of 0.85. Meetings of the three physicians took place weekly during the whole study, to discuss all the AE cases on the basis of the record summary.
Statistical analysis
Proportions of stays with an AE, AE incidence rates per stay or day were calculated with their 95% CI, under the hypothesis of a binomial proportion distribution and number of AE Poisson distribution. Estimates at hospital level with their 95% CI were computed by applying the rates observed among surgical and medical stays.
Results
The eligible population consisted of 3877 medical and 2166 surgical stays. Ninety percent (1007) of sampled charts (1101) were available for review (Fig. 1). The main exclusion reason was unavailability of the entire chart (inadequate documentation in only 10% of charts). The proportion of medical charts with at least one screening criteria was similar in medical and surgical stay: 33 and 34% (see Appendix B). The eligible population and samples characteristics are described in Table 1.
Eligible and studied populations’ characteristics
| Eligible population | Random sample | Studied population | |
|---|---|---|---|
| Medical stays | |||
| N (%) | 3877 (64.2) | 664 (60.3) | 605 (60.1) |
| N hospital daysa (%) | 31 029 (65.0) | 5106 (61.1) | 4626 (61.1) |
| Mean age (SD), years | 50.8 (30.7) | 50.8 (30.4) | 50.8 (30.5) |
| Length of stayb (SD), days | 8.0 (7.1) | 7.7 (5.6) | 7.6 (5.4) |
| Sex ratio (M/F) | 1.07 | 1.01 | 1.0 |
| In hospital deaths (%) | 106 (2.7) | 19 (2.9) | 16 (2.6) |
| Surgical stays | |||
| N (%) | 2166 (35.8) | 437 (39.7) | 402 (40.0) |
| N hospital daysa (%) | 16 740 (35.0) | 3247 (38.9) | 2945 (38.9) |
| Mean age (SD), years | 51.0 (21.8) | 50.5 (20.8) | 50.8 (20.8) |
| Length of stayb (SD), days | 7.7 (7.7) | 7.7 (5.6) | 7.6 (5.4) |
| Sex ratio (M/F) | 0.76 | 0.76 | 0.78 |
| In hospital deaths (%) | 16 (0.7) | 3 (0.7) | 2 (0.5) |
aSum (discharge date-admission date +1).
bDischarge date-admission date +1
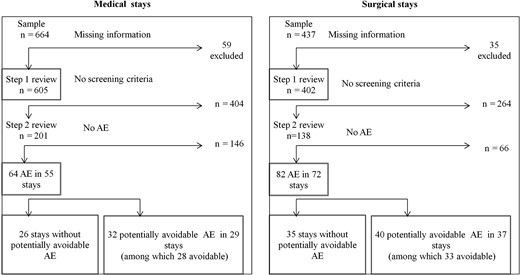
Review process flowchart.
The reviewers identified 64 AE in 55 medical stays and 82 AE in 72 surgical stays. Their causes are listed in Table 2. Seventy percent of the AE occurred and were detected during index admission, 14% occurred during index admission but were the consequence of previous in-hospital care, and 16% were detected during a readmission. These proportions did not differ according to type of stay or to level of preventability of the event. After weighing for the stratified sampling, the overall hospital AE incidence rate was 14.1% (95% CI: 12.0–16.2), and the incidence per hospital-day was 1.9% (95% CI: 1.6–2.2). The proportion of hospitalizations with at least one AE was 12.3% (95% CI: 10.4–14.1) (Table 3).
AE causes
| Medical stays n = 605 | Surgical stays n = 402 | |||||
|---|---|---|---|---|---|---|
| No. of cases (%) | No. of prev. cases | No. of potent. prev. casesa | No. of cases (%) | No. of prev. cases | No. of potent. prev. casesa | |
| Diagnostic procedure | 3 (5) | 3 | 3 | 3 (4) | 3 | 3 |
| Failure, delay or error | 3 | 3 | 3 | 3 | 3 | 3 |
| Therapeutic decision | 4 (6) | 4 | 4 | 0 | ||
| Failure, delay or error | 4 | 4 | 4 | |||
| Drug treatment | 33 (52) | 6 | 7 | 12 (15) | 1 | 1 |
| Inappropriate dose | 6 | 5 | 5 | 1 | 1 | 1 |
| Adverse drug reaction | 27 | 1 | 2 | 11 | 0 | 0 |
| Non-surgical procedure | 17 (27) | 10 | 12 | 6 (7) | 2 | 4 |
| Infection | 5 | 4 | 4 | 2 | 1 | 2 |
| Injury | 4 | 2 | 4 | 2 | 0 | 0 |
| Other | 8 | 4 | 4 | 2 | 1 | 2 |
| Operative procedure | 7 (11) | 5 | 6 | 61 (74) | 27 | 32 |
| Technical complication | 2 | 1 | 2 | 22 | 18 | 20 |
| Wound infection | 3 | 3 | 3 | 7 | 7 | 7 |
| Non-technical complication | 1 | 0 | 0 | 23 | 0 | 3 |
| Post-operative sepsis | 0 | 1 | 1 | 1 | ||
| Post-operative thrombosis | 1 | 1 | 1 | 1 | 1 | 1 |
| Other medical complications | 0 | 7 | 0 | 0 | ||
| All (%) | 64 (100) | 28 (44) | 32 (50) | 82 (100) | 33 (40) | 40 (49) |
prev., preventable; potent. prev., potentially preventable.
aSum of preventable cases and of those of undetermined preventability.
AE incidence rates, proportion of hospitalizations with at least one AE and of hospitalizations with at least one potentially preventable AEa
| Studied sample | Hospital estimates (95% CI) | ||||||||||
|---|---|---|---|---|---|---|---|---|---|---|---|
| No. | No. of days | No. of AE | No. with at least one AE | No. with at least one AE, potent. prev. | No. | No. of days | Incidence rates | Proportion of stays | |||
| Per 100 stays | Per 100 days | With at least one AE | With at least one AE, potent. prev. | ||||||||
| Medical stays | 605 | 4626 | 64 | 55 | 29 | 3877 | 31 029 | 10.6 (7.9–13.2) | 1.4 (1.0–1.7) | 9.1 (6.8–11.4) | 4.8 (3.1–6.5) |
| Surgical stays | 402 | 2945 | 82 | 72 | 37 | 2166 | 16 740 | 20.4 (15.9–24.9) | 2.8 (2.2–3.4) | 17.9 (14.1–21.7) | 9.2 (6.3–12.1) |
| Total | 1007 | 7571 | 146 | 127 | 66 | 6043 | 47 769 | 14.1 (12.0–16.2) | 1.9 (1.6–2.2) | 12.3 (10.4–14.1) | 6.4 (5.0–7.8) |
potent. prev., potentially preventable.
aSum of preventable and of undetermined preventability cases.
Forty-two percent of AE were considered preventable (Table 2); when adding AE eventually judged of undetermined preventability, the proportion of potentially preventable AE was 49%. After weighing for the stratified sampling, the proportion of hospitalizations with at least one potentially preventable AE was 6.4% (95% CI: 5.0–7.8) (Table 3).
Sixty percent of AE (38 among 64 medical stays, and 50 among 84 surgical stays) resulted in no impairment or minimal impairment at discharge. Twenty-three percent (12 for medical stays, and 21 for surgical stays) resulted in severe impairment at discharge. Although seven deaths occurred among the 127 stays with an AE (5.5%), no death was AE attributable, leading to a 95% CI of hospital death rate related to care of 0.0–0.7%. Potentially preventable AE in surgical stays resulted more often in severe impairment than unavoidable AE (40% vs. 12%; P = 0.01). There was no significant association between preventability and degree of impairment for medical stays. The proportion of severe impairment due to an AE was 15% for drug related AE, 25% for surgical procedure related AE, 15% for non-surgical procedure related AE and ~50% for AE due to a diagnosis or therapeutic error. Only nine (six in surgical stays) AE required a vital support intervention. Most patients with an AE had a complete recovery at 6 months. Two AE among medical stays and six among surgical stays resulted in severe permanent impairment. The estimated hospital incidence of AE resulting in severe impairment at 6 months was 0.7% (95% CI: 0.3–12). The proportion of medical and surgical stays with an AE increased with age and length of stay (Table 4). There was no gender-associated difference in the risk of AE or potentially preventable AE (Table 4).
Number and proportion of stays with AE according to age, gender and length of stay
| Variable | Number and proportion of stays with AE | |||||||
|---|---|---|---|---|---|---|---|---|
| Medical stays | Surgical stays | Hospital estimates | ||||||
| n | All AE (%) | Potent. prev. AE (%) | n | All AE (%) | Potent. prev. AE (%) | Prop. with AE in percent | Prop. with potent. prev. AE in percent | |
| Age | ||||||||
| 0–15 | 134 | 1 (0.7) | 0 | 13 | 0 | na | na | |
| 16–44 | 90 | 2 (2.2) | 1 (1.1) | 148 | 15 (10.1) | 8 (5.4) | 6.8 | 3.6 |
| 45–64 | 120 | 15 (12.5) | 8 (6.7) | 127 | 19 (15.0) | 12 (9.4) | 13.6 | 7.9 |
| 65+ | 261 | 37 (14.2) | 20 (7.7) | 114 | 38 (33.3) | 17 (14.9) | 19.6 | 9.5 |
| Gender | ||||||||
| Men | 304 | 26 (8.6) | 15 (4.9) | 177 | 37 (20.9) | 16 (9.0) | 12.5 | 6.0 |
| Women | 301 | 29 (9.6) | 14 (4.7) | 225 | 35 (15.6) | 21 (9.3) | 12.0 | 6.5 |
| Length of stay (days) | ||||||||
| 1–4 | 202 | 2 (1.0) | 1 (0.5) | 149 | 10 (6.7) | 4 (2.7) | 3.1 | na |
| 5–9 | 257 | 21 (8.2) | 11 (4.3) | 167 | 27 (16.2) | 15 (9.0) | 11.1 | 6.0 |
| 10+ | 146 | 32 (21.9) | 17 (11.6) | 86 | 35 (40.7) | 18 (20.9) | 28.0 | 13.9 |
Potent. prev., potentially preventable; prop., proportion.
Discussion
We found that 12.3% of patients admitted to hospital experienced one or more AE, with an overall 14.1% AE incidence rate. This is in accordance with the most recent studies conducted which found higher rates than the initial US studies (Fig. 2). About half of these events were judged preventable, a proportion close to the median of 43.5% from the de Vries et al. systematic review [23]. AE were nearly twice more frequent among surgical than medical stays. Sixty percent of patients experienced no or minor disability, which is similar to 55% of the meta-analysis [23]. About a quarter of AE resulted in severe impairment at discharge, but only 5 % resulted in severe permanent disability at 6 months, which is in accordance with other studies (the higher proportion of permanent disability of 6–11% of de Vries et al. included minor disability). Although diagnostic or therapeutic errors accounted for a minority of AE, they led to more severe consequences [28]. AE were related to patient health status, as suggested by higher rates in patients who were older and had longer hospital stays.
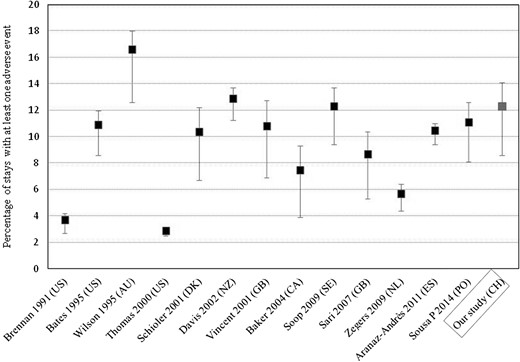
Proportion of admissions with AE reported from retrospective records review studies in hospitalized patients, in chronological order. In the horizontal axis, each study is cited by first author's name, publication year and the country referred to by its international code. Error bars indicate 95% CIs. All the studies of de Vries's systematic review of literature in English are included but O'Neil's study was replaced by Bates's, which evaluated the same population using retrospective review whereas O'Neil used two different strategies. We also have retained an article in Danish published in 2001. Four more recent studies were added after retrieval from a literature search using the keywords ‘AE & record review & hospital’, and appraisal in order to verify the methods comparability and definitions.
Contrary to other studies, no death was attributed to an AE, whereas we would have expected seven deaths among patients suffering from AE when applying the lower limit of 5% of lethal events estimated by de Vries et al. [23]. Seven was the number of observed deaths among patients with an AE, but no causal relationship was established between event and death. The similar proportion of deaths among hospitalizations with a screening criteria but without AE, and those with AE (10/212, 4.7% vs. 7/127, 5.5%) suggested a disputable relationship between AE and death. A 2000 Institute of Medicine report [29] estimated that medical errors result between 44 000 and 98 000 preventable deaths each year in US hospitals. Some researchers questioned the accuracy of this report, criticizing the statistical handling of measurement errors, subjectivity in determining which deaths were avoidable, and an erroneous assumption that 100% of patients would have survived if optimal care had been provided [30]. A 2001 study estimated that despite 20% of hospital deaths being judged avoidable, less than one percent of the patients who died would have lived for three months or more had ‘optimal’ care been provided [31].
Our study had several limitations beyond those associated with similar retrospective chart reviews. It was conducted in one acute care medium size hospital. This hospital did not include tertiary cases; its case-mix is, therefore, likely to be less severe than the average Swiss case-mix. Although most medical and surgical disciplines were provided by the hospital, and although the population served by the hospital bears no apparent special characteristics, the generalizability of our findings to other Swiss acute care hospitals is unknown. Events revealed after discharge were captured only if they resulted in readmission in the same hospital over the following 6 months. This period has been extended to 12 months in some studies [8], whereas other studies counted only AE occurring and being discovered during the index hospital admission [19]. The AE assessment was done by a single physician without long post graduate experience, and budget constraints did not allow estimating an inter-rater reliability on a random sample after data collection. However, efforts were made to improve the moderate reliability of the AE assessment and preventability found by similar chart reviews. Records completeness and adequacy were checked and insufficient records were excluded. A detailed taxonomy of the AE underlying causes was set with a priori judgement on their preventability. All reviewers underwent training until reaching substantial agreement on the detection of AE, much better than methodologically similar studies. In addition, regular discussion meetings took place, where the reviewers could discuss their issues concerning the review process, cases and definition. Each detected AE was discussed with the study team, to verify the correct interpretation of the information retrieved, and a consensus procedure was set.
The report, including a detailed description of the 146 AE, was presented to the Chief Executive, to the Chief Medical and to the Patient Safety Officers. The review team then presented the key findings to the hospital's Patient Safety Committee. The small number of cases per category did not ease the identification of clear improvement priorities. As in other studies, three quarters of AE were due to surgical procedures and drugs. Half of operative complications were avoidable whereas the majority of drug AE were unavoidable. The hospital Committee decided to investigate in depth all events belonging to the two highest categories of harm at discharge judged preventable. This analysis led to eight clinical practice recommendations and to three more general recommendations regarding clinical documentation and organization, after a second review of these eight cases by the Chief Medical Officer.
Because of resources required, chart review with a ‘manual’ two steps procedure remains impractical for routine AE detection. The positive predictive value of the initial screening process was lower for medical than for surgical stays (27% vs. 52%), resulting in the physician reviewers evaluating a high number of false-positive charts. Some of the criteria used for the initial screening process could be captured electronically. With the increasing use of electronic medical records, advances in natural language processing or electronic signals using computerized prescription or laboratory data will greatly facilitate the detection of AE and promotion of patient safety. Various signals have been successfully used for detecting drug AE [32]. But there is a great need for developing information technology tools for screening of tracer clinical conditions effectively [33].
Conclusion
We have observed that the AE occurrence rate in one Swiss community hospital is similar to rates previously reported, and that AE are mostly due to medication and surgery. The lack of tertiary care hospitalizations and the poor precision of estimates by events type raise the question of a larger national study. We need a better estimation of some specific rates indeed, i.e. due to medication or procedure according to severity, and to set a national objective of improvement. However, given the important resources needed to conduct this study, one should examine and validate alternative options. For instance, the use of routinely collected data enriched with clinical information available in electronic patient records, which could allow automating trigger events detection to focus reviews on high-risk patients, may prove useful.
Supplementary material
Supplementary material is available at International Journal for Quality in Health Care online.
References
Sécurité des patients Suisse. CIRRNET—Critical Incident Reporting & Reacting NETwork. https://www.cirrnet.ch/ (23 May 2017, date last accessed).
ANQ Association nationale pour le développement de la qualité dans les hôpitaux et les cliniques. Résultats médecine somatique aiguë. http://www.anq.ch/fr/resultats-de-mesure/resultats-somatique-aigue/ (23 May 2017, date last accessed).
Department of Health and Human Services Agency for Healthcare Research and Quality. Guide to Patient Safety Indicators. http://www.qualityindicators.ahrq.gov/downloads/modules/psi/v31/psi_guide_v31.pdf (23 May 2017, date last accessed).
