Article Text

Abstract
Objectives To understand the impact of emergency department (ED) reconfiguration on the number of patients waiting for hospital beds on trolleys in the remaining EDs in four geographical regions in Ireland using time-series analysis.
Setting EDs in four Irish regions; the West, North-East, South and Mid-West from 2005 to 2015.
Participants All patients counted as waiting on trolleys in an ED for a hospital bed in the study hospitals from 2005 to 2015.
Intervention The system intervention was the reconfiguration of ED services, as determined by the Department of Health and Health Service Executive. The timing of these interventions varied depending on the hospital and region in question.
Results Three of the four regions studied experienced a significant change in ED trolley numbers in the 12-month post-ED reconfiguration. The trend ratio before and after the intervention for these regions was as follows: North-East incidence rate ratio (IRR) 2.85 (95% CI 2.04 to 3.99, p<0.001), South IRR 0.68 (95% CI 0.51 to 0.89, p=0.006) and the Mid-West IRR 0.03 (95% 1.03 to 2.03, p=0.03). Two of these regions, the South and the Mid-West, displayed a convergence between the observed and expected trolley numbers in the 12-month post-reconfiguration. The North-East showed a much steeper increase, one that extended beyond the 12-month period post-ED reconfiguration.
Conclusions Findings suggest that the impacts of ED reconfiguration on regional level ED trolley trends were either non-significant or caused a short-term shock which converged on the pre-reconfiguration trend over the following 12 months. However, the North-East is identified as an exception due to increased pressures in one regional hospital, which caused a change in trend beyond the 12-month post reconfiguration.
- accident and emergency medicine
- Organisation of health services
- Quality in health care
This is an open access article distributed in accordance with the Creative Commons Attribution Non Commercial (CC BY-NC 4.0) license, which permits others to distribute, remix, adapt, build upon this work non-commercially, and license their derivative works on different terms, provided the original work is properly cited, appropriate credit is given, any changes made indicated, and the use is non-commercial. See: http://creativecommons.org/licenses/by-nc/4.0/.
Statistics from Altmetric.com
Strengths and limitations of this study
A strength of this study is the wealth of data used in the analysis conducted: 11 years of weekly trolley data and emergency admissions and 10 years of monthly emergency attendance data were utilised within this study.
The models adopted to perform the analysis within this study capture complex, non-linear underlying patterns within the data. The methods presented here illustrate how patterns in trolley data can be decomposed, allowing the identification of underlying trends.
The inclusion of emergency admissions data at a population level has allowed us to capture whether emergency admissions to hospitals outside of the regions studied have changed as a result of emergency department reconfiguration.
It is also possible that the trolley data are biassed in some way as it is not officially validated using an external source. However, it is collected using systematic methods across all hospitals and these methods have not changed over the study period.
There is a difficulty of modelling complex temporal patterns that combine non-linear and seasonal pattern and are sensitive to the effects of national and local conditions. Our analysis may not have captured changes in population need for emergency services in a region or changes to the conditions or characteristics of the population outside of the hospital setting such as increases in activity due to large numbers of patients presenting with influenza, etc.
Background
Over the past decade, Ireland’s emergency care services have come under increasing pressure. Since the mid-2000s, both national emergency department (ED) attendances1 and emergency admissions have increased,2 while both staff3 4 and acute bed numbers were reduced due to the financial recession of 2008.5
There has been significant emergency and urgent care system reconfiguration in many of the regional health systems of Ireland.6–8 Within the published reports, there is an acknowledgement that due to Ireland's small regional populations, the historical organisation of acute services is less than optimally positioned to maintain staff skills and resources to ensure the best possible outcomes for emergency and urgent care patients.6 7 9–11 The need to attune service capacity to the volume of cases and the need to maximise the efficiency and outcomes of all hospitals, most specifically smaller hospitals, are repeatedly stressed.6–14 Regional system reconfiguration has also seen changes to the availability and location of ED services in Ireland. Much of this reconfiguration was proposed due to concerns regarding the quality and safety of the delivery of care in smaller EDs.7 There have also been continued difficulties in staffing smaller EDs, and debates regarding the inefficiencies associated with having small EDs in close proximity to each other.7 15 The reduction of these services combined with increased numbers of emergency attendances and admissions have been proposed as the cause of increased overcrowding in the remaining acute hospitals with EDs.3 4 16 17 Remaining EDs must now provide services for a higher volume of patients in addition to caring for the most complex case-mix of admissions within the system.18 19
A visible and measurable manifestation of this overcrowding is the presence of patients on trolleys in EDs. Patients on ED trolleys have been admitted to the hospital, but are waiting for an appropriate in-patient hospital bed to become available.20 21 This restricted flow of patients through the hospital system occurs when the need for specific services exceeds what can be provided in a particular location at a particular time.22 Consequently, a high number of ED trolleys is considered to be indicative of poor availability, management or use of hospital resources, particularly beds. This issue has been at the forefront of discourse within the Irish health system for many years and is considered to be one of the most persistent failings of the hospital system in Ireland. It is also an issue that draws particular media attention.16 17 As of 2018, trolley numbers are seen to be consistently high year round, particularly at the major regional hospitals.23
Internationally, overcrowding in EDs has led to different policy approaches in an attempt to reduce growing pressures on the services. These measures include limits to length of stay, access to 24/7 general practitioners (GPs), increasing the number of private sector hospitals and implementing tele-medicine phone services.24 The inability to transfer emergency patients from the ED to in-patient beds is considered to be the single most important contributor to trolley numbers.18 25 High periods of acute bed occupancy have been shown to have knock-on impacts in the throughput from EDs.26–28 One study found that with a 10% absolute increase in bed occupancy, patients wait on average 5% longer to be admitted to a hospital bed.29 Consistent reports have found that an acute bed occupancy of 90% or greater will result in periodic bed crises.30 An Organisation for Economic Co-operation and Development (OECD) study of Ireland’s health system has found that Ireland has one of the highest rates of acute bed occupancy, measured at 93.8% in 2015.31
The impact of ED overcrowding can have knock-on impacts on other areas and large numbers of patients on trolleys should not be viewed in isolation. Shared resources between elective and emergency patients are impacted by the management of emergency patients.32 The potential impacts of resource management, specifically bed management, have been highlighted in previous studies.32 33 Research has also highlighted that the pressure of caring for ED patients requiring assessment and admission has resulted in non-urgent elective surgery appointments being cancelled to accommodate the need for additional beds for emergency cases.33 This has contributed, in part, to increasing numbers of patients on waiting lists for scheduled surgery.33 The end result of this action is that delayed surgery contributes to a higher probability that this patient then requires care as an emergency case.33
The rate of ED trolley use also varies between hospitals. This can be due to individual hospital features such as bed capacity, but may also be driven by regional factors such as increases in local population need and the closure of nearby ED services.34 It can be hypothesised that when ED services are halted or reduced in one location, nearby hospitals can expect to see pressures on patient flows from the ED to in-patient beds unless capacity is increased in the new destination hospital. In Ireland, there is evidence to suggest that the reconfiguration of hospital services has impacted on patterns of patient flow specifically for those presenting with self-harm in the Mid-West.35 EDs that are geographically further from the closed ED would also be expected to be less impacted by an increase in the number of attendances from that hospital.34 To date, these hypotheses have not been tested by using trolley numbers as a signal of overcrowding. To reduce the potential for adverse effects caused by the restructuring of services, it is vital to understand where patient volume and possibly overcrowding will increase as a consequence.34
The aim of this paper is to assess the impact of ED reconfiguration on regional levels of trolley use in proximal EDs. The findings will then be considered in line with information available changes in need and bed capacity.
Methods
Study population
Within Ireland, there are eight hospital regions,36 four of which have seen significant changes to their ED services. Table 1 outlines the changes in each region. ED services at some smaller hospitals were re-designated to urgent care centres (UCCs) which consist of both local injury units (LIUs) and medical assessment units (MAUs), or re-designated to LIUs only. These services do not provide 24/7 emergency care and cater only for low acuity conditions.
Regional reconfiguration of regional ED services
In the West, one ED was reconfigured to a UCC in 2011. In the Mid-West, two EDs were reconfigured to UCCs from 2012 to 2013, whereas in the North-East two EDs were reconfigured to LIUs during the period 2009–2010.
The South experienced changes to three EDs: two rural EDs in county Cork were re-designated to UCCs, and one urban ED was permanently closed. These changes occurred over the period 2012–2013.
Data sources
Trolley data for each region and hospital were provided by the Irish Nursing and Midwives Organisation (INMO) weekly trolley data spreadsheets from 2005 to 2015 as reported by the Department of Health.21 37 The data refer to the number of patients on trolleys in EDs awaiting admission to an in-patient hospital bed, as counted at 08:00 by the Irish Nurses and Midwives Organisation.21 38 The weekly counts refer to the number of patients on trolleys from Monday to Friday only, excluding bank holidays.21 37 These data are collected by contacting bed managers in each hospital, who provide the requested information. Data are then centrally collated by the INMO and cross-checked daily against a Health Service Executive (HSE) database, TrolleyGar.38 Weeks 1, 52 and 53 of the data provided straddles the Christmas season and it is advised by the INMO that the accuracy of the data for these weeks is reduced due to the low level of counting over this period of time. Therefore, these weeks have not been included in the final analysis.
Information regarding emergency admissions to public acute hospitals from 2005 to 2015 was available via the Hospital In-Patient Enquiry (HIPE) system.2 The average number of annual in-patient beds39 and the number of monthly ED attendances at each hospital40 from 2006 to 2015 were provided directly by the Acute Business Intelligence Unit in the HSE.
Patient and public involvement
The analysis within this study was conducted using secondary data collected by the INMO, HSE and HIPE. However, the development of this research question was informed by public and patient experiences as identified by studies conducted by Droog et al 41 and Foley et al 42 as part of the wider Study of the Impact of Reconfiguration on Emergency and Urgent Care Networks (SIREN) project, of which this study is a part. Preliminary findings from this study were disseminated to patients and the wider public through a number of public meetings held in the regions included in this analysis.
Statistical analysis
Moving average
An initial analysis of the moving average of ED trolleys and total emergency admissions within the hospitals with full EDs in each region was conducted to assess the general underlying trend in both. Weekly data were available for both ED trolleys and total emergency admissions. The moving average was constructed using a 50-week window, beginning with the final 24 weeks of 2005 and the first 25 weeks of 2006, moving a week at a time, and ending before the final 25 weeks of 2015. This 50-week window allowed an examination of the underlying trend having removed seasonality. In addition to this initial analysis, contextual data are provided regarding the resources available within the region over the same time period. The average number of annual in-patient beds in hospitals with full EDs was considered. Data for those hospitals that saw a removal of full ED services are included in the regional averages up to and including the year of their closure.
Distribution of ED trolleys among hospitals
To understand how individual hospital trolley numbers contribute to the regional total over time, the annual average of the weekly trolley numbers in each hospital were combined and graphed. This visualisation allows a greater understanding of how the distribution of trolley share by hospital varies before and after ED closure/reconfiguration, thereby identifying those hospitals most impacted by the changes in ED services.
Decomposition of observed trolley numbers
The full time series for the ED trolley numbers in each region were modelled using a negative binomial regression analysis of the full data from 2005 to 2015. The model was adjusted for seasonality and allowed for a non-linear underlying trend.
The following model was used:

where f(t) is a restricted cubic spline function of time. The spline function is cubic between specified time points (knots) and continuous, with continuous first and second derivatives, at the knots. The knots were placed at every 100 weeks. This results are a smooth and flexible model that can react to local changes. The Cos and Sin terms allow for seasonality with periods of 12 months and 6 months (25 and 50 weeks).
This model was then subsequently decomposed into its three relevant components: the underlying trend, seasonality and noise. The relationship between the trend and the seasonality in the model was assumed to be multiplicative. The noise was identified as the difference between the observed and expected counts.
The model also allowed for serial autocorrelation based on a visual inspection of the autocorrelation function (ACF) and partial autocorrelation (PACF) graphs. A function was included to allow the standard errors to have a heteroskedasticity and autocorrelation (HAC) lag of three, as determined by the observed pattern.43
Interrupted piecewise linear time series
Having assessed the underlying trend, an interrupted time series was then applied to a shorter time period. In the West region, where there was a single ED closure, we considered the time period of 12 months prior to the ED reconfiguration and the 12 months post-reconfiguration. For regions where there were two ED reconfigurations, the period from 12 months prior to the first ED reconfiguration to the 12 months after the second ED reconfiguration were considered.
When plotted, the shorter time period was found to be compatible with a linear model. Seasonality was included as before, but the cubic spline term was replaced by a piecewise linear function with a breakpoint at the time of ED reconfiguration. A dummy variable and an interaction term were considered for each of the ED reconfiguration to allow for both a jump and slope change in the trend.
In regions where two ED reconfigurations took place, a backwards hierarchical stepwise approach was taken to determine which impact for each ED closure was significant at a regional level. A significance level of p<0.05 was set, with the model accounting for the impact of the reconfiguration of the first ED, and then the second. For one region, the South, there are three total ED reconfigurations. The final two reconfigurations happened in very close succession, with only a 5-month period between them. The closeness of these reconfigurations made it difficult to distinguish the impact each. As the final closure (Bantry) was a smaller ED, with a small number of emergency admissions, it was excluded from the final analysis to simplify analysis.
The final model for each region, with the significant components and deseasonalised trolley counts, was then graphed against a counterfactual model which set the ED reconfiguration and its potential change in trend and level to zero. As a separate control group was not available, analysis of the outcome of interest in the study group did not allow to control for other events that may have influenced the outcome. The counterfactual model included in this analysis predicts what would have occurred in the absence of the intervention. The level and trend of the pre-intervention segment serve as the control for the post-intervention segment in single group time series. This approach represents a methodologically acceptable design for measuring the impact of interventions. This technique has previously been recommended for evaluating healthcare-based interventions.44 45
Results
Moving average
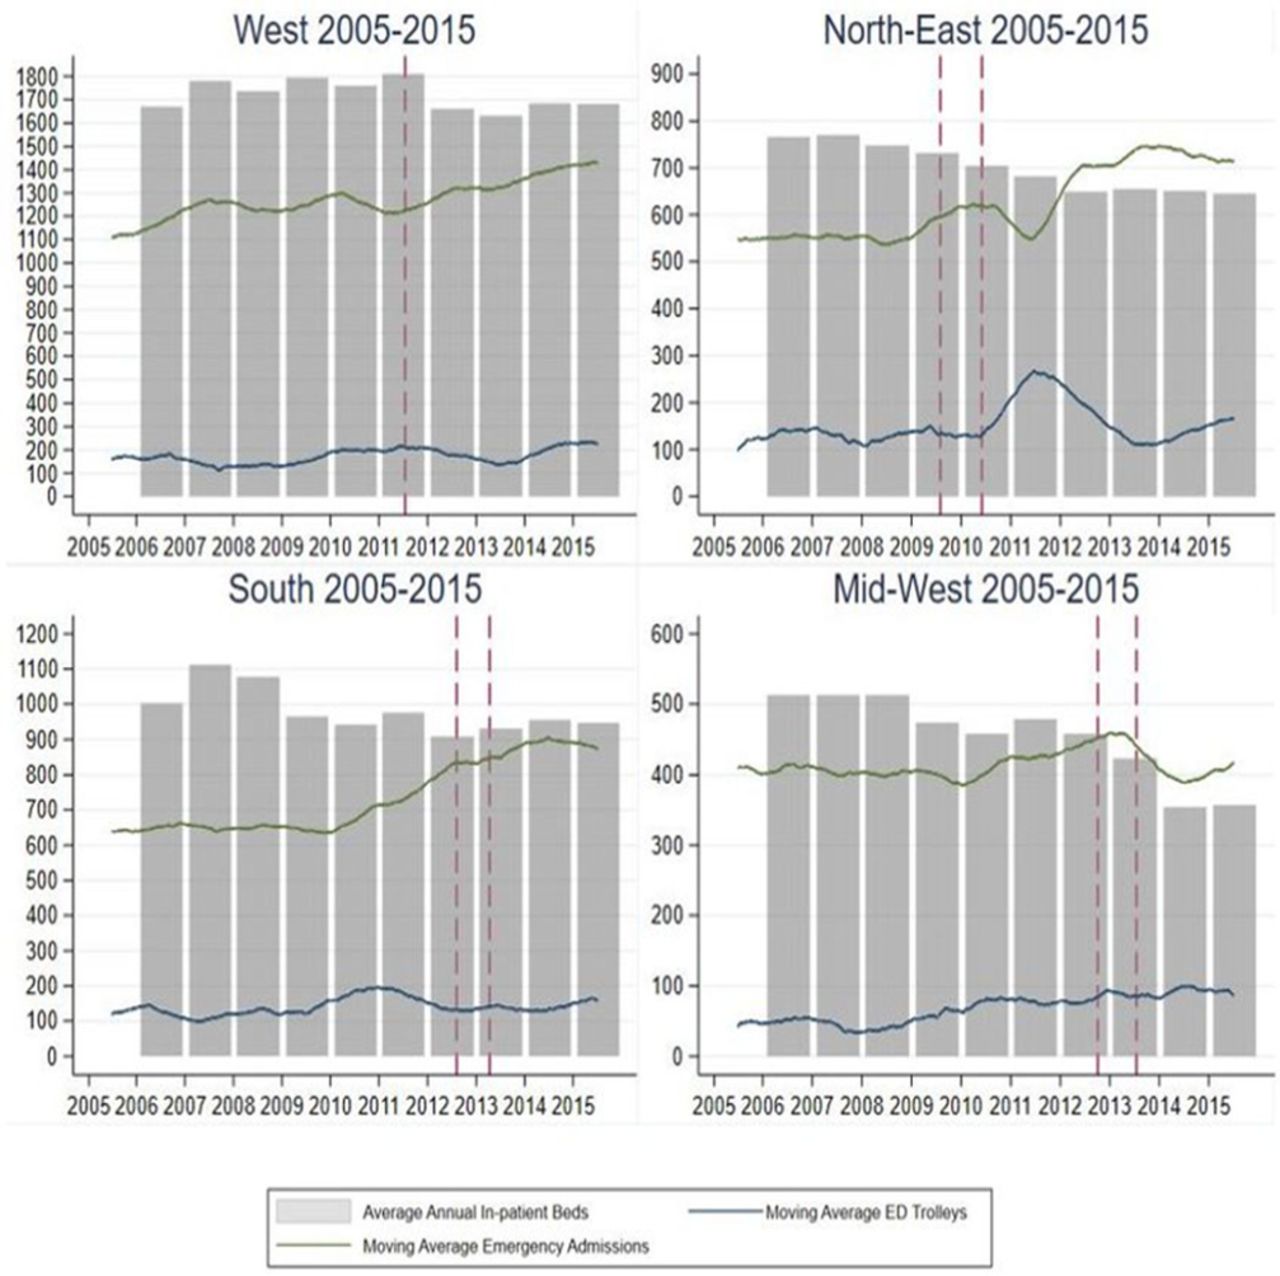
The moving average plots removed seasonality and revealed varying non-linear trends in both ED trolley use and emergency admissions over the period 2005–2015. These can be observed in figure 1 and online appendix 1 figure 1A–D and annual averages are outlined in (online appendix 2 table 2A–C). The reconfiguration date of EDs is represented by the dashed red line.
Supplemental material
Regional emergency department trolleys, emergency admissions and in-patient beds 2005/2006–2015.
In-patient beds
Annual in-patient beds were available for each regional hospital. Figure 1 shows the maximum level of in-patient beds that were observed in 2007 (North-East 770, Mid-West 513 and South 1112), see full details of in-patient bed numbers in online appendix 2 table 2A. All of these regions saw decreases to in-patient bed numbers available between 2005 and 2015 (North-East decrease in 16%, Mid-West decrease in 30% and South decrease in 5%). The exception is the West, which saw an increase to the average number of in-patient beds of 0.7% from 2005 to 2015. For both the Mid-West and the North-East, since 2013 and 2012, respectively, the average number of emergency admissions per week exceeds the number of in-patient beds available.
Emergency admissions
In the West, there was a steady increase in emergency admissions in the relevant hospitals over the period 2005–2015, increasing from a weekly average per year of 1109 emergency admissions in 2005 to 1428 in 2015, representing a 29% increase (see online appendix 2 table 2B).2
The pattern in the three other regions was more erratic. In the North-East, the number of emergency admissions was relatively constant up to 2009 (approximately 550 per week on average each year), after which there was a period of increase until midway through 2010. A subsequent fall and sharp increase between 2011 and 2012 was observed (an increase from an average of 554 per week in 2011 to 706 per week in 2012). This increase was maintained thereafter resulting in a 31% increase over the full study period.
In the South and Mid-West regions, the average number of emergency admissions per week was relatively consistent between 2005 and 2010, approximately 650 per week in the South and 400 per week in the Mid-West. Emergency admissions in the South started to rise after 2010 (728 per week in 2011) and levelled off after 2014 (874 per week in 2015). In the Mid-West, emergency admissions rose after 2010, peaking at an average of 446 per week in 2012, although there was a substantial fall in emergency admissions in 2014 to an average of 389 per week. Over the full study period, the South saw a 27% rise in emergency admissions compared with only 2% in the Mid-West.
Trolley numbers
The trend in trolley numbers varied among regions.
Trolley numbers in the West fluctuated over the 10-year period between a minimum average of 132 trolleys per week in 2007 and a maximum of 226 per week in 2015, see online appendix 2 table 2C.
In the North-East, there was a steady pattern until 2010, with numbers almost doubling over the next 12 months (increasing from an average of 141 per week in 2010 to 264 per week in 2011). After this point, levels dropped back to a similar pattern to that observed prior to 2011. By 2015, the average trolley number had increased to 166 per week, compared with 99 per week in 2005.
In the South, trolley numbers peaked in 2010 with an average of 186 trolleys per week compared with a minimum of 106 per week in 2007.
The Mid-West saw the average number of trolleys more than double from 42 per week in 2005 to 87 per week in 2015, peaking in 2014 at 99 per week.
Distribution of ED trolleys among hospitals
Figures 2–5 illustrate the variation in distribution across hospitals in each region of the weekly average trolley numbers over time. The regional totals are broken down by hospital to identify those EDs which contribute the most to the total regional trolley numbers. The starkest change can be observed in the North-East. As shown in figure 3, following the closure of Louth County Hospital in 2010, the average number of patients on trolleys each week in the neighbouring hospital in Drogheda, Our Lady of Lourdes Hospital, increased from 3398 total in 2010 (an average of 68 per week) to 7321 in total in 2011 (an average of 146 per week).

West-regional distribution of emergency department trolleys among hospitals 2005–2015.

North-East-regional distribution of emergency department trolleys among hospitals 2005–2015.

South-regional distribution of emergency department trolleys among hospitals 2005–2015.

Mid-West-regional distribution of emergency department trolleys among hospitals 2005–2015.
The pattern of emergency admissions for patients from Louth was investigated to assess whether this may have impacted on the regional distribution of regional trolleys observed. In 2009, the year prior to ED reconfiguration, 4891 emergency admissions (representing 51% of those from Louth) were to Our Lady of Lourdes Hospital, Drogheda, and 3229 (34% of all emergency admissions from Louth) were to Louth County Hospital. In 2011, following the Louth County Hospital ED reconfiguration, an additional 2000 patients from Louth were admitted on an emergency basis at Our Lady of Lourdes, Drogheda, indicating that 85% of all emergency admissions of patients from Louth were received at that hospital. In 2012, the number of emergency admission patients from Louth admitted to Our Lady of Lourdes had increased to over 10 000. A full breakdown of the distribution of emergency admissions across all regions is found in online appendix 3 table 3A–D.
Decomposition of observed trolley numbers
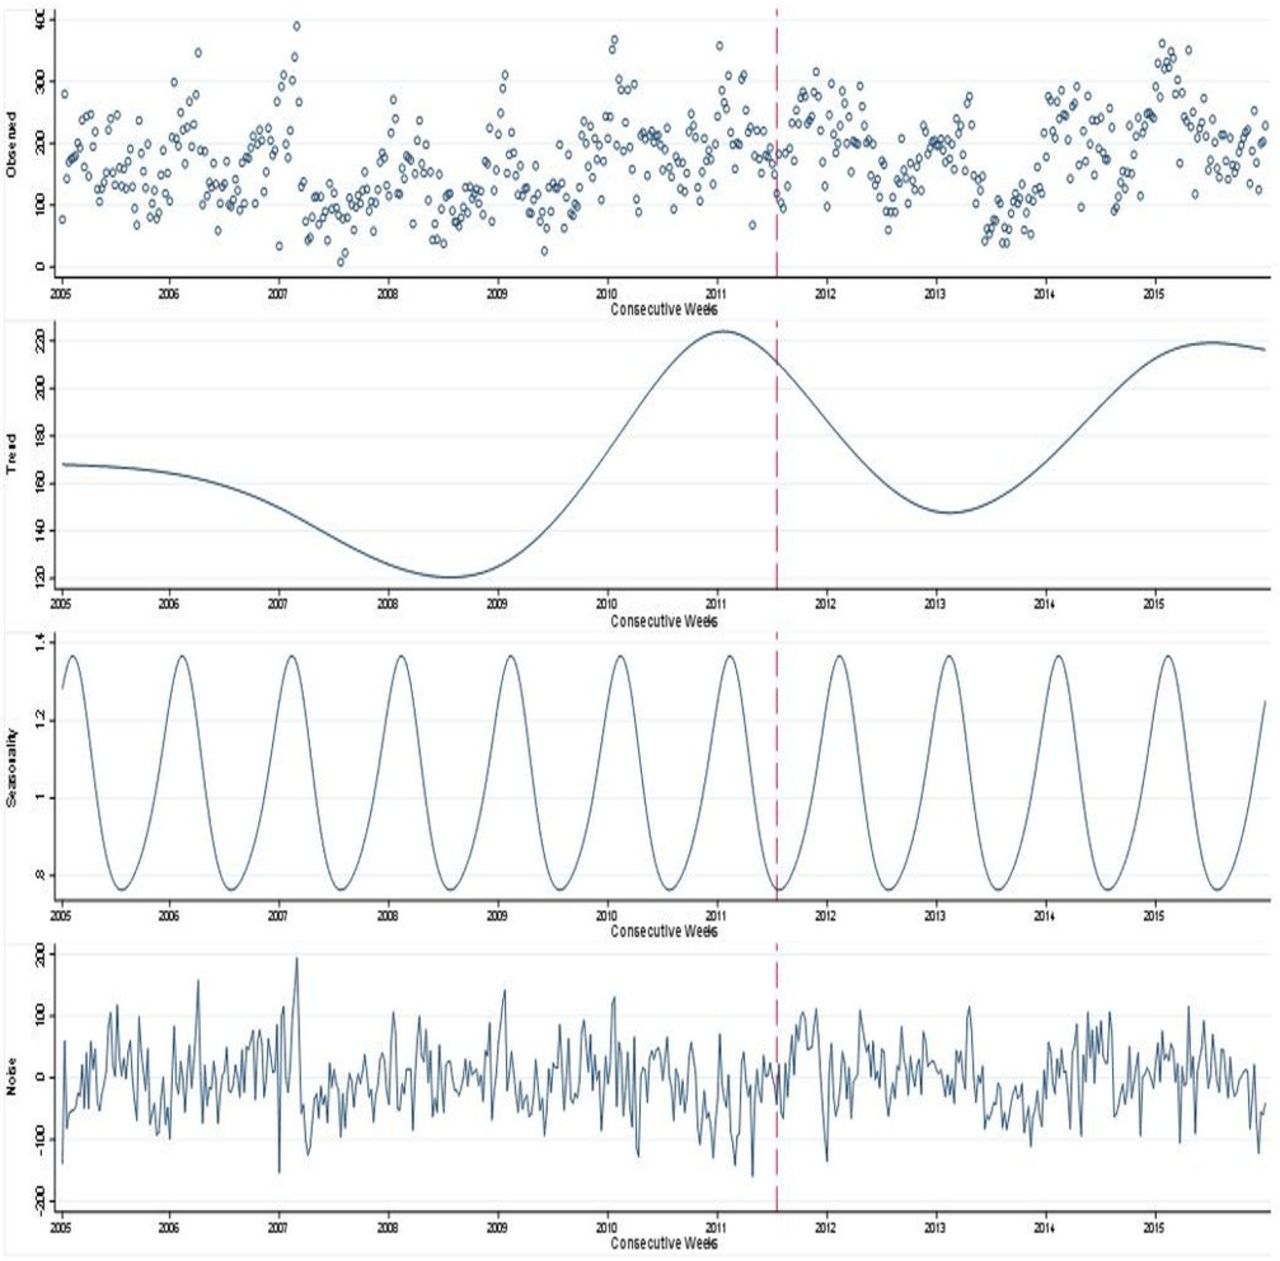
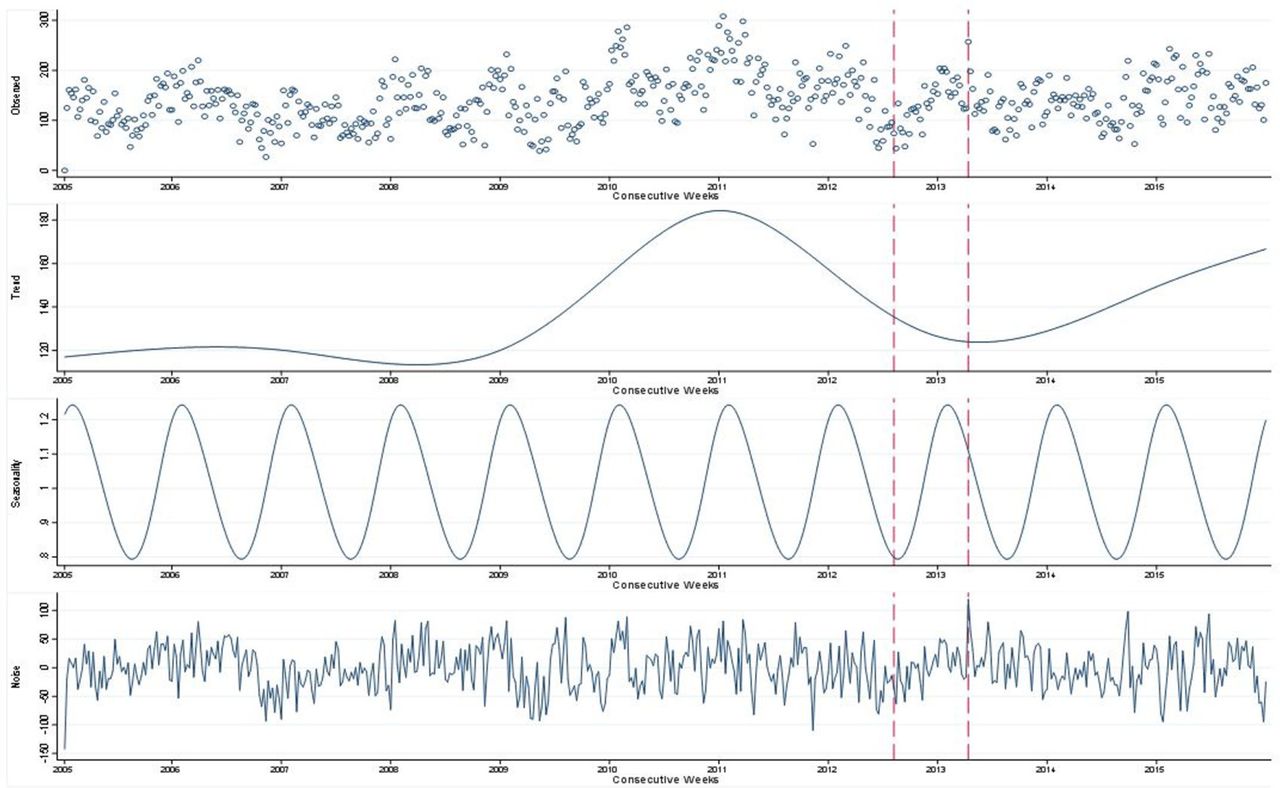
The decomposition of each region’s observed ED trolley numbers from 2005 to 2015 is shown in figures 6–9. The observed trolley numbers are seen in the first part of the graph, followed by the underlying trend, the observed seasonal component and finally the remaining, unexplained noise. The included red dash lines signify the reconfiguration of an ED.

West-regional decomposition of emergency trolleys: observed, trend, seasonality and noise, 2005–2015.

North-East-regional decomposition of emergency trolleys: observed, trend, seasonality and noise, 2005–2015.

South-regional decomposition of emergency trolleys: observed, trend, seasonality and noise, 2005–2015.

Mid-West-regional decomposition of emergency trolleys: observed, trend, seasonality and noise, 2005–2015.
The second component of each graph, identifying the trend, shows that the most substantial changes in the underlying pattern are witnessed in each region from 2009 onwards. Similar to the moving averages outlined in figure 1, peaks are seen in the observed trend around 2011–2012, with the exception of the Mid-West, which sees a peak in 2015. It is important to note the difference in scales across all four regional plots, with the lowest numbers seen in total in the Mid-West, which also has the smallest population.
Interrupted piecewise linear time series
The results of regional interrupted time-series analysis of trolley numbers are outlined in figure 10 and in table 2.

Regional piecewise linear analysis of emergency department closures.
Results of regional piecewise linear analysis of ED reconfiguration
In the West, the reconfiguration of Roscommon ED to a UCC was not found to have a statistically significant impact on either the level or slope of the observed deseasonalised trolley numbers. The deseasonalised observed trolley numbers did not have a significant trend in the 12 months prior to, or post, ED reconfiguration (annual incidence rate ratio (IRR) 1.03, 95% CI 0.920 to 1.16).
In the remaining three regions where there were two ED reconfigurations/closures, the impact of the second ED reconfiguration was found to have a significant impact on the observed trolley numbers, but not necessarily in the expected direction, and without a long-term continuation of the immediate change in trend.
In the North-East, there was a significant increase in the upward trend in trolley numbers in the 12 months following the reconfiguration of Louth County Hospital ED to a LIU (pre-reconfiguration of Louth ED annual IRR 0.88, 95% CI 0.77 to 1.02; post-reconfiguration of Louth ED annual IRR 2.53, 95% CI 2.03 to 3.15). However, there was no significant change in level or trend following the first ED closure (Monaghan—level change, p value=0.44; trend change, p value=0.21).
In the South, no significant change in the level or trend of the trolley numbers was observed following the closure of the first ED (South Infirmary—level change, p value=0.17; trend change, p value=0.10). However, there was a significant immediate increase in 68% to the level of observed trolleys following the reconfiguration of Mallow ED to a UCC (IRR 1.68, 95% CI 1.36 to 2.09). There was a subsequent significant downward trend (annual IRR 0.54, 95% CI 0.415 to 0.69) in the 12-month post-closure which causes the trend to converge with the predicted pattern if no reconfiguration had occurred (pre-reconfiguration IRR 0.795, 95% CI 0.701 to 0.90).
Finally, in the Mid-West, there was no significant change in level or trend associated with the first ED reconfiguration (Nenagh—level change, p value=0.64; trend change, p value=0.16), but there was a significant immediate fall of 42% in trolley numbers at the time of the reconfiguration of Ennis ED to a UCC (IRR 0.58, 95% CI 0.45 to 0.733). There was also a significant increase in the observed slope for the 12-month post-reconfiguration (annual IRR 1.81, 95% CI 1.30 to 2.51) which ultimately results in a convergence with the predicted pattern if no reconfiguration had taken place (pre-reconfiguration IRR 1.25, 95% CI 1.09 to 1.43).
Discussion
Summary of findings
The total regional emergency admissions to acute hospitals with full ED services have increased in Ireland since 2005. At the same time, the total number of in-patient beds available at these hospitals have not returned to their pre-recession levels.
Our analysis of the distribution of trolley numbers over time has highlighted increased short-term pressures on surrounding hospitals following the reconfiguration of ED services. This pattern is most specifically observed in the North-East region which saw a substantial increase in its observed trolley numbers following the closure of Louth County hospital.
All four regional ED trolley patterns reflect a non-linear underlying trend. In general, the findings show that the regionally observed ED trolleys follow a similar pattern; the lowest levels are seen around 2007, whereas peaks in the trend are observed in 2011–2012, with the exception of the Mid-West.
Analysis found that for three of the four regions (the South, the Mid-West and the North-East), the re-designation of the second regional ED had a significant immediate impact on ED trolley numbers at a regional level. The projected results showed that both the South and the Mid-West displayed a convergence within the 12-month post-reconfiguration between the observed trolley numbers and the expected trolley numbers if the ED reconfiguration had not taken place. However, the North-East shows a much steeper increase over time that does not display a short-term convergence with the expected trend if the ED reconfiguration had not taken place.
Interpretation
In three regions, the immediate impact of ED reconfigurations is either non-significant or associated with a short-term shock to observed ED trolley numbers followed by convergence with the pre-reconfiguration trend over the following 12 months.
Only the North-East region was subject to a longer-term shock after reconfiguration. The full long-term trend in the North-East, as seen in figure 7, shows that the number of trolleys continues to increase up to mid-2011, marginally beyond the 12-month post-ED reconfiguration. It is only from mid-2011 onwards that a gradual improvement is seen.
The anomalous results in the North-East cannot be explained by the unique background conditions reviewed for this study. Bed capacity in the North-East fell by 7% over the reconfiguration period (2009–2011) but larger decreases were seen in the West (9% from 2011 to 2012) and the Mid-West (29% from 2012 to 2014) and only the Southern region saw a rise in bed capacity during reconfiguration. Emergency admissions fell by 7% in the North-East over the reconfiguration period compared with rises in the West (8%) and South (9%) and a fall of 13% in the Mid-West. This may indicate that other factors, which we have not measured, such as efficiency of bed management within hospitals, may modify (or may lessen or offset) the effect of reconfiguration on overcrowding. The ability to ensure efficient bed management may be dependent on the case-mix within hospitals or the average lengths of stay experienced by patients. Significant differences across these characteristics may impact on the observed changes in trolley numbers in different hospitals.
It is also important to note that EDs in the North-East were reconfigured to LIUs only, with no MAUs provided within the hospitals to replace the ED services. In all other regions, EDs were reconfigured to UCCs incorporating both LIU and MAU facilities.
Strengths and limitations
A strength of this study is the wealth of data used in the analysis conducted: 11 years of weekly trolley data and emergency admissions and 10 years of monthly emergency attendance data. The granularity of this data allows for an analysis of seasonality which is an important consideration when studying the immediate impact of reconfiguration on ED overcrowding.
The models adopted to perform this analysis capture complex, non-linear underlying patterns within the data. The methods presented here illustrate how patterns in trolley data can be decomposed, allowing the identification of underlying trends. Since 2005, the INMO has collected information on trolley numbers in hospital wards and these are reported regularly in the media. Although the trolley data are freely available, it is largely underutilised. This is to our knowledge the first study to use this data together with a more sophisticated time series modelling to study the long-term trends in trolley numbers.
The inclusion of emergency admissions data at a population level has allowed us to capture whether emergency admissions to hospitals outside of the regions studied have changed as a result of ED reconfiguration, as outlined in online appendix 3 table 3A–D. The trends point to a generally consistent pattern in the numbers and proportions of emergency admissions to hospitals outside the region over time. Therefore, the risk that our study interpretations do not account for changes in inter-regional patient movements is minimal.
The limitations of this study include difficulty in separating and interpreting the impact of individual service changes when two ED reconfigurations occurred within the space of 12 months.
It is also possible that the trolley data are biassed in some way as it is not officially validated using an external source. However, it is collected using systematic methods across all hospitals and these methods have not changed over the study period. Therefore, the greatest risk is likely to be consistent over or under-estimation at a national level rather than in comparisons across hospitals or time.46 47
Our analysis may not have captured changes in population need for emergency services in a region. It is possible that reconfiguration may have reduced overall expressed need for ED services within parts of a region because some patients who would previously have travelled to an ED and been admitted may no longer do so because of the extra burden of travel.46 47 This might offset the increased need for beds in the hospitals with post-reconfiguration EDs. These patients are not captured within the data included here.
It is important to also acknowledge that conditions outside the hospital setting have an impact on the observed trend. For example, at the beginning of 2011, EDs across the country saw an increase in activity due to increased numbers of patients presenting with influenza, influenza-like symptoms and swine influenza.48 This also resulted in a sudden increase in the numbers on ED trolleys due to overcrowding. Such an incident highlights the difficulty of modelling complex temporal patterns that combine non-linear and seasonal pattern and are sensitive to the effects of national and local conditions.
Policy implications
ED reconfiguration is likely to continue, therefore, where possible, research should try to determine which service restriction is most likely to impact ED overcrowding at other locations.30 Increasing hospital bed access and the use of other hospital services such as acute medical units have been seen as possible ways to offset the impact of ED closures.22 Our findings suggest that other factors such as the efficiency of local bed management may also be important determinants. Increasingly operations research, queuing theory and computer simulation have been used to understand the causes of ED overcrowding and quantify the likely impact of changes to the delivery of emergency care.49–51 It is possible that trolley numbers may increase when there is below maximum hospital occupancy. This may occur if patients need care in specialised units, such as oncology wards. These may be fully occupied even when there is still capacity in the hospital as a whole.29
Admissions are usually done on a specialty basis and it is the availability of beds in specialty areas that may ultimately have an impact, rather than the total number of beds. There are also issues regarding the closure of beds due to infection and the increased need for specialised isolation facilities.52 Therefore, bed management forms an important component of the wider efficient use of hospital resources, a concern encapsulated by operational capacity planning and control.53–55 In general, operational capacity management is considered to be poorly developed in most acute hospitals.53 The operation functions of a hospital address activities such as scheduling and work flow to ensure the demands placed on resources are met in a way which maximises their efficiency53
However, in many cases, bed management is still reduced to finding beds in times of high demand, effectively firefighting once a crisis is occurring53 rather than contributing to crisis avoidance.53 56 It is recommended that better capacity management can increase ‘slack’ in system through lower bed occupancy, and operational research and planning can aid the anticipation of day-to-day needs.53 A combined approach of both demand and supply management is needed. From a demand management perspective, promoting the appropriate use of beds, reducing delayed discharges, gate-keeping GP urgent referrals, influencing the volume, timing and placement of elective services to match bed capacity is required. At the same time, supply management measures can establish and maintain a discharge focus.53
The pace at which changes are implemented should also be carefully considered, particularly if resource reductions are to occur at the same time. Ensuring the efficiency and capacity of remaining resources is maximised is vital to minimise the impact of closures.30 Certain patient management strategies have been highlighted as ways in which crowding may be reduced. Identifying non-urgent referrals, implementing ambulance diversion and destination control have been studied as means to achieve improvements.22
The full impact of system-level factors, such as service closures, on ED trolley numbers has been largely understudied.30 A study of service reduction in the USA found that only 80% of the predicted ED volume from hospital closures was seen in nearby ED’s.34 Many patients who may have attended an ED previously due to proximity may now decide that they do not need to access emergency care, potentially due to the increased distance.34 46 These patients might now attend an UCC or seek other alternatives to emergency care.34
Strategies that simply transfer the problem of trolleys from the ED to the ward should be avoided, as this does not present a solution.18 Since 2005, the INMO has collected information on trolley numbers in hospital wards, this seeks to prevent the movement of patients simply from one area of the hospital to another in an attempt to improve certain measures.
A growing contributor to the overcrowding in the ED is the large numbers of older patients awaiting discharge to a chronic care facility.57 These demographics will differ across hospitals; therefore, a one-size-fits-all approach to reducing trolley numbers should not be adopted.
Finally, it can be assumed that distributing a set of number of patients on trolleys across multiple EDs is less likely to result in unpleasant conditions than having the same number concentrated in one ED. Although unmeasured in this study, it is reasonable to suggest that the quality of patient care, stress on staff and overall time spent waiting on a trolley are worse when a high number of trolley patients are cared for in a single facility. This implies that harm may be caused by ED reconfiguration even if trolley numbers do not increase.
Conclusion
Our main findings suggest that the impact of ED reconfigurations at a regional level is either non-significant or cause a short-term shock to observed ED trolley numbers which will converge on the pre-reconfiguration trend over the following 12 months. The North-East has been identified as an exception with a longer-term impact on regional trolleys identified, specifically caused by increased pressures on one regional hospital.
References
Footnotes
Contributors All authors (BL, AF, PC, OH, CB and JB) made substantial contributions to the conception and design of this article. BL contributed to the acquisition of data; BL and AF contributed to the analysis and interpretation of the data. BL, AF and JB drafted the article; PC, OH and CB revised the article critically for important intellectual content. All authors give final approval of the version submitted. All authors agree to be accountable for all aspects of the work in ensuring that questions related to accuracy or integrity of any part of the work are appropriately investigated and resolved.
Funding Funding was received from the Health Research Board (HRB), 'Funding University College Cork Collaborative Applied Research Grant 2012' (CARG/2012/28). The HRB had no involvement in data collection, analysis or interpretation; or any aspect pertinent to the study. Payment has not been received from any pharmaceutical company or other agency.
Competing interests Dr OH is member of the Reconfiguration Forum for Cork and Kerry (having been a member of the Project Team 2008–2011).
Patient consent for publication Not required.
Ethics approval The trolley data used in this analysis are anonymised secondary data, publically available therefore ethics approval was not required. As previously outlined, hospital admissions data are available from the HIPE Health Atlas online portal, for which access must be approved on application to the Health Intelligence Unit of the Health Service Executive.
Provenance and peer review Not commissioned; externally peer reviewed.
Data availability statement Data are available in a public, open access repository.