The impact of removing financial incentives from clinical quality indicators: longitudinal analysis of four Kaiser Permanente indicators
BMJ 2010; 340 doi: https://doi.org/10.1136/bmj.c1898 (Published 11 May 2010) Cite this as: BMJ 2010;340:c1898
- Helen Lester, professor of primary care1,
- Julie Schmittdiel, research scientist2,
- Joe Selby, director2,
- Bruce Fireman, biostatistician2,
- Stephen Campbell, senior research fellow3,
- Janelle Lee, senior data analyst2,
- Alan Whippy, director of quality and safety4,
- Philip Madvig, associate executive director5
- 1NIHR School for Primary Care Research, Manchester M13 9PL
- 2Division of Research, Kaiser Permanente Northern California, Oakland, CA, USA
- 3National Primary Care Research and Development Centre, University of Manchester, Williamson Building, Oxford Road, Manchester M13 9PL
- 4Quality and Operations Support, Permanente Medical Group, Oakland, CA
- 5Permanente Medical Group, Oakland, CA
- Correspondence to: H Lester Helen.lester{at}manchester.ac.uk
- Accepted 16 January 2010
Abstract
Objective To evaluate the effect of financial incentives on four clinical quality indicators common to pay for performance plans in the United Kingdom and at Kaiser Permanente in California.
Design Longitudinal analysis.
Setting 35 medical facilities of Kaiser Permanente Northern California, 1997-2007.
Participants 2 523 659 adult members of Kaiser Permanente Northern California.
Main outcomes measures Yearly assessment of patient level glycaemic control (HbA1c <8%), screening for diabetic retinopathy, control of hypertension (systolic blood pressure <140 mm Hg), and screening for cervical cancer.
Results Incentives for two indicators—screening for diabetic retinopathy and for cervical cancer—were removed during the study period. During the five consecutive years when financial incentives were attached to screening for diabetic retinopathy (1999-2003), the rate rose from 84.9% to 88.1%. This was followed by four years without incentives when the rate fell year on year to 80.5%. During the two initial years when financial incentives were attached to cervical cancer screening (1999-2000), the screening rate rose slightly, from 77.4% to 78.0%. During the next five years when financial incentives were removed, screening rates fell year on year to 74.3%. Incentives were then reattached for two years (2006-7) and screening rates began to increase. Across the 35 facilities, the removal of incentives was associated with a decrease in performance of about 3% per year on average for screening for diabetic retinopathy and about 1.6% per year for cervical cancer screening.
Conclusion Policy makers and clinicians should be aware that removing facility directed financial incentives from clinical indicators may mean that performance levels decline.
Introduction
Many countries now use quality indicators to measure the standard of clinical care in both community and hospital settings. Some also attach monetary payments to the level of achievement, as measured by the indicator,1 since financial incentives have been shown to lead to improvements in clinical quality.2 3 In the United Kingdom, the quality and outcomes pay for performance framework was introduced into primary care in 2004. It includes the clinical care of people with chronic diseases such as diabetes, organisational issues such as the management of medicines and summarisation of patients’ records, patients’ experience of access to care and consultation length, and additional services such as screening for cervical cancer. Each indicator has several points attached to it, with each point equating to a payment of £126.77 (€142.36; $192.02). Currently the most a primary care practice can score in a year is 1000 points. The Quality and Outcomes Framework costs the UK economy about £1bn each year.
Although quality indicators could remain indefinitely within a pay for performance framework, this would restrict the potential benefits of providing a financial incentive to only a limited number of conditions. Additionally, achievement levels for these incentivised indicators could eventually reach a ceiling, with little further improvement over time.4 There has, however, been little empirical work on either the underpinning principles to guide removal of indicators from pay for performance frameworks or the effects of removing a financial incentive on doctor performance and therefore perhaps on patient care. The interactions between intrinsic motivation of doctors and extrinsic rewards such as financial remuneration are complex.5 6 It is hard to know when or if incentivised behaviours become so standard and routine that financial incentives are superfluous.
Understanding the effects of removing indicators has become a priority in the United Kingdom following a policy decision to remove indicators from the Quality and Outcomes Framework on a regular basis.7 8 Negotiations between the Department of Health and general practitioner representatives in autumn 2009 resulted in an agreement to remove eight clinical indicators from the framework in April 2011.
We evaluated the effect of removing financial incentives from clinical indicators on subsequent performance. The hypothesis was that removing the financial incentive would be associated with a subsequent decrease in performance levels compared with levels achieved while incentives were in place. No data on the removal of incentives for doctors for clinical quality were available in the United Kingdom (only three indicators have been removed from the Quality and Outcomes Framework since its inception in 2004, and achievement in those areas has not been routinely monitored); however, data were available at Kaiser Permanente in California where incentives directed towards medical facilities, rather than individual doctors, have been attached to several quality indicators and later were removed from a few. We examined four of the 20 prespecified indicators, choosing specifically those common to both the UK Quality and Outcomes Framework and the Kaiser Permanente Northern California: screening for cervical cancer, control of hypertension, diabetes control, and screening for diabetic retinopathy. Financial incentives were removed from two of these indicators during 1999 to 2007.
Within Kaiser Permanente, decisions to apply incentives to specific performance indicators were motivated by the potential clinical benefits to members, the interests of employer purchasers, the indicators used by external “report cards” and regulators, the gap between current Kaiser Permanente performance and high performing benchmarks, and the organisation’s “readiness” to change in a specific area. For instance, the presence of an obvious means for changing performance and of accountable, committed clinical leaders in an area would support use of an incentive. Similarly, decisions to drop incentives for a specific indicator would be motivated by changes in these considerations such that other indicators seemed to offer more population benefit or room for improvement.
Methods
The study population consisted of adult members of Kaiser Permanente Northern California, an integrated healthcare delivery system providing comprehensive medical care to about 3.1 million people in northern California. We included 2 523 659 adult patients whose primary source of care was one of 35 outpatient facilities owned and operated by Kaiser Permanente Northern California. Primary care is provided by general internists and family practitioners; specialty care is also provided at these facilities. To assess patient level diabetes glycaemic control (HbA1c <8%), screening status for diabetic retinopathy, hypertension control (systolic blood pressure <140 mm Hg), and whether a patient was up to date with cervical cancer screening we used automated data on health plan membership, diagnoses as inpatients and outpatients, radiology procedures, laboratory tests, and prescription drugs each year between 1999 and 2007. Performance measures based on these automated data have been found to be highly reliable.9 We aggregated the patient level data to produce quality indicators for each of the 35 medical facilities within the Kaiser Permanente Northern California region.
To assess glycaemic control, we examined the last recorded HbA1c value for each adult member aged 18-75 who met one or more of the following criteria: two or more outpatient visits with a diagnosis of diabetes in the past two years; one or more hospital discharges with a principal diagnosis of diabetes in the past two years; or at least one fill of a prescription for a diabetes drug (including insulin and oral agents) within the year before the assessment year. We excluded members with a diagnosis of gestational diabetes within 12 months before the reporting period. Members were considered to have glycaemic control of if their most recent HbA1c value in the year was less than 8%. Members who were not tested within the reporting period were presumed to have poor glycaemic control.
In the same population we assessed screening for diabetic retinopathy, restricted to members aged 31 or more (since the American Diabetes Association and American Academy of Ophthalmology recommend regular screening on diagnosis for patients aged >30). Patients were considered to have been screened if they recorded a visit to the optometry or ophthalmology department within two years of the end of the assessment year.
To assess rates of hypertension control, we examined the last recorded systolic blood pressure value in each year from 2002-7 for members aged 20 or more who met one or more of the following criteria for having hypertension in the previous two years: had at least one prescription for an antihypertensive drug plus an outpatient diagnosis of hypertension; had two or more outpatient diagnoses of hypertension; had a prescription for an antihypertensive drug plus one or more elevated outpatient blood pressure readings (systolic ≥140 mm Hg or diastolic ≥90 mm Hg); or had at least one outpatient diagnosis of hypertension plus at least one reading of ≥140 mm Hg for systolic blood pressure or ≥90 mm Hg for diastolic blood pressure. We excluded years 1999-2001 because blood pressures were not routinely included in the database until 2002. If the systolic blood pressure was <140 mm Hg we considered hypertension to be controlled.
For cervical cancer screening rates, we considered eligible for a cervical smear all women aged 21-64 at the start of the assessment year who were continuously enrolled for 34 of 36 previous months and had no evidence of a total hysterectomy. Cervical smears are recommended every three years in this age group in the United States. A cervical cancer screen was considered to have been done for that member if there was any record of a smear test in the laboratory database within the 36 months before the end of the assessment year.
Use of financial incentives
In each year from 1999-2007, the regional operations leadership of Kaiser Permanente Northern California offered financial incentives for achieving target goals on a select list of clinical quality indicators. These incentives were awarded to facilities rather than individual doctors and could be used to fund core facility operations, staffing, and quality improvement. Although incentives were at an organisational level, this created alignment of leadership and engagement in performance improvement and also resulted in major investments in redesign. Staff in turn appreciated that incentives could mean greater revenue to the medical centre. In 2006, $42 000 000 (£25 169 293; €31 120 332) was awarded as incentives across the 35 facilities. If an incentive was removed, the money was linked to performance on other indicators. The total funds that could be earned by a facility were relatively stable during this period, despite changes in the indicators that were incentivised.
Within Kaiser Permanente Northern California, quality indicators are typically supported by a range of interventions at system level.10 This includes the promotion of the quality goal by doctor champions; funding of non-doctor staff to carry out outreach and assist in management of the population; provision of information technology tools such as population tracking software and patient reminders; and development and dissemination of clinical guidelines. These system level supports may or may not remain if incentives are removed. In the case of screening for cervical cancer, for example, a “preventive health prompt” was in place. At each visit a list was printed out of the preventive measures that needed to be done—typically they gave the last date the test had been done and the date the next test was due—so the clinician could see what was outstanding. In addition, performance on cervical cancer screening continued to be measured and reported as part of the performance reports to facilities.
The list of indicators linked to financial incentives varied during the study period. Decisions to remove or add incentives were made by the leadership of Kaiser Permanente Northern California based on priorities for the coming year. During the study period, incentives were removed for screening for cervical cancer and for diabetic retinopathy. In both cases, rates were relatively high, incentives did not seem to be leading to further increases, and it was thought that there were better opportunities to improve care, such as greater focus on cardiovascular risk reduction. Doctors and clinical staff at each facility were informed of changes in the quality incentives.
Statistical analyses
For each of the four quality indicators we created a financial incentive variable for each year from 1999-2007: if a financial incentive was attached to a given indicator in a year, the variable was “Y”; if not, the variable was “N.”
We examined the annual regional performance for each indicator in relation to whether a financial incentive was in place, was not yet in place, or had been removed. Financial incentives were removed for screening for both diabetic retinopathy and cervical cancer. For each of these indicators we ran hierarchical regression models separately to estimate the effect of removing the incentive on year to year change in performance. In each model the unit of analysis was a facility during a year. The dependent variable was change in performance (expressed in percentage points) from the previous year. The main independent variable was whether the incentive was in place versus was removed. We examined facility effects as random effects and assumed the yearly change in scores to have a first order autoregressive structure. Because incentives were added or removed at all facilities simultaneously, we could not examine incentives as fixed effects at facility level.
In sensitivity analyses, we fitted similar models with alternative covariance structures. We also fitted models that further adjusted for fixed facility effects (such as the log of the number of people served by the facility). These analyses yielded estimates of the impact of removing the incentive that were similar to those in main regression analyses. All models were run using PROC MIXED in SAS v.9.2.
Results
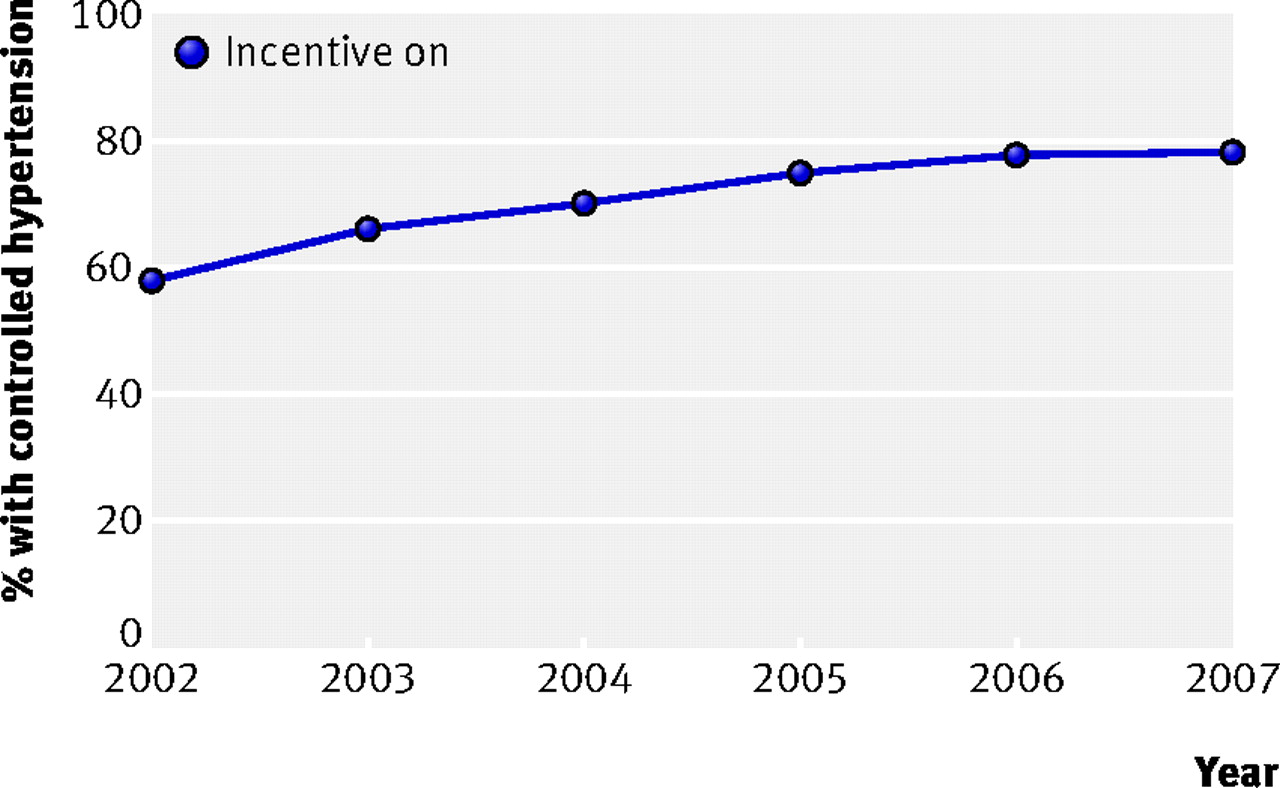
Control of hypertension was incentivised through the period of interest, but automated data were only available from 2002. The proportion of adults with hypertension whose systolic blood pressure was below 140 mm Hg increased from 58.3% in 2002 to 78.2% in 2007 (fig 1⇓).

Fig 1 Control of hypertension (systolic blood pressure <140 mm Hg) in relation to financial incentives in adults aged ≥20 (data only available from 2002)
Glycaemic control was not incentivised during 1999 and 2000 and levels of achievement were 44.2% and 46.8%, respectively (fig 2⇓). After the introduction of incentives in 2001, performance continued to improve, with levels of achievement increasing most years and reaching 69.8% in 2007 (fig 2).

Fig 2 Glycaemic control (<8%) in relation to financial incentives in adults aged 18-75
During the study period incentives were removed from screening for diabetic retinopathy and cervical cancer screening. During the five consecutive years when financial incentives were attached to screening for diabetic retinopathy (1999-2003), the proportion screened rose from 84.9% to 88.1% (fig 3⇓). This was followed by four years without incentives when the proportion screened fell year on year to 80.5%.

Fig 3 Percentage of adults aged ≥31 screened for diabetic retinopathy in relation to financial incentives
During the initial two years when financial incentives were attached for cervical cancer screening (1999-2000), screening rates rose slightly from 77.4% to 78.0% (fig 4⇓). During the next five years when no financial incentives were attached, rates fell year on year to 74.3%. Incentives were then reattached for two years (2006-7) and screening rates increased again (fig 4).

Fig 4 Percentage of women aged 21-64 screened for cervical cancer in relation to financial incentives
Analyses of the year on year changes at facility level suggest that after incentives were removed screening for diabetic retinopathy declined on average by about 3% per year and for cervical cancer by an average of 1.6% per year. Regression analyses of the year on year changes suggest that after incentives were removed, screening for diabetic retinopathy declined on average by about 3% per year (mean change 3.1%, 95% confidence interval 2.4% to 3.8%) and screening for cervical cancer by an average of about 2% per year (mean 1.6%, confidence interval 1.1% to 2.1%).
Discussion
Removal of system directed financial incentives for two quality indicators (screening for diabetic retinopathy and for cervical cancer) in Kaiser Permanente Northern California was associated with small declines in performance levels for those indicators in the following years.
This study addressed the relatively under-explored but important area of the effect of the removal of financial incentives within health care on performance. If removal of financial incentives means that performance levels, and therefore potentially patient care, decline, this may have direct practical implications for policy makers, clinicians, and patients.
Strengths and limitations of the study
This study has additional limitations owing to differences between Kaiser Permanente Northern California and the UK National Health Service. Within Kaiser Permanente Northern California, the payment attached to each indicator is directed to its relatively large medical care facilities rather than to individual doctors, and doctors’ income is not affected by the incentives. Furthermore, it is difficult to separate the impact of financial incentives from that of other regional efforts directed towards the same quality measures. In most instances, the organisation implements additional strategies along with incentives, such as development of computerised reminders for doctors or databases for direct outreach by non-doctor staff, and in some cases these strategies are scaled back when the incentives are removed. In the case of screening for diabetic retinopathy, regionally generated reminder lists to facilities were stopped at the time the incentive was withdrawn but supports were kept in place for cervical cancer screening.
In the United Kingdom, payment is directed to primary care practices and directly affects doctors’ income. Although many practices do implement reminders or other “system solutions” to improve performance on incentivised tasks, little other systemwide support exists to help embed indicators. It is difficult to predict whether use of or attention to these reminders would decline when incentives are removed, but it could be argued that attention would shift and performance levels would decline faster within a system where personal income was attached to newly introduced indicators than removed indicators such as in the Quality and Outcomes Framework.
While the data for each indicator suggest a general upward trend over time for incentivised indicators, no data are available for comparison from practices that are not incentivised that would allow distinction of effects due to underlying trends and secular influences such as publicity.
Comparison with other studies
Previous work has focused on the effects of the presence rather than the removal of financial incentives. While some studies have found a “halo effect” in which the quality of care can improve beyond the targeted indicators to other indicators within a given condition and perhaps to other conditions,11 others have found no such effect.4 Indeed, one study found that quality of care within a given condition not associated with a financial incentive declined for patients with asthma or with heart disease.12 It is possible that the effect of removing indicators is similarly complex with, for example, the effect of removing indicators where there is no associated financial incentive being different from removing one where there is an associated financial loss. In a non-health context, one study showed that if people are paid to do something they would otherwise have done out of interest (such as a clinical task that improved the quality of patient care), they would be less likely to do so in future without being paid.13 The study also adds weight to the assertion by another study14 that the absence of financial incentives within previous quality improvement strategies may have partially explained the failure of such strategies to lead to actual improvements in quality of care.
Conclusions and policy implications
If the findings of this study are confirmed across a wider range of indicators, clinicians need to be aware that if financial incentives are removed, their focus may change and they may need to think proactively about how to maintain previous levels of patient care. It could, however, also be argued that slightly lower levels of achievement in one area may be more than offset by improvements in care in a different clinical area to which incentives are shifted. Policy makers who intend to remove financially incentivised clinical indicators may need to consider a stepwise reduction of payments against indicators, rather than blanket removal. They may also need to introduce a system of monitoring achievement in areas where indicators have been removed, as Kaiser Permanente Northern California has, and perhaps decide a priori the level of decline in achievement that could trigger a review and possible reintroduction.
What is already known on this topic
Many healthcare systems now attach financial incentives to clinical indicators
Financial incentives can lead to improvement in clinical performance in a primary care setting
What this study adds
Removal of financial incentives for two quality indicators was associated with small declines in performance levels
Policy makers and clinicians need to be aware that removing financial incentives from clinical indicators may mean that recorded performance levels, and therefore potentially patient care, may decline over time
Notes
Cite this as: BMJ 2010;340:c1898
Footnotes
Contributors: HL had the original idea for the study and is guarantor. HL, JSch, and JS planned the study. BF and JL did the statistical analysis. All authors were involved in discussing the emerging data and in writing and revising the paper, had full access to all of the data (including statistical reports and tables) in the study, and can take responsibility for the integrity of the data and the accuracy of the data analysis.
Funding: None.
Competing interests: All authors have completed the Unified Competing Interest form at www.icmje.org/coi_disclosure.pdf (available on request from the corresponding author) and declare that all authors had: (1) No financial support for the submitted work from anyone other than their employer; (2) No financial relationships with commercial entities that might have an interest in the submitted work; (3) No spouses, partners, or children with relationships with commercial entities that might have an interest in the submitted work; (4) HL and SC are contracted to the National Institute for Health and Clinical Excellence to provide advice on removal of indicators and pilot new indicators for the Quality and Outcomes Framework. The views expressed are those of the authors and do not necessarily represent the views of NICE or its independent Quality and Outcomes Framework advisory committee.
Ethical approval: Not required.
Data sharing: The technical appendix, statistical code, and dataset are available from the corresponding author at Helen.lester{at}manchester.ac.uk.
This is an open-access article distributed under the terms of the Creative Commons Attribution Non-commercial License, which permits use, distribution, and reproduction in any medium, provided the original work is properly cited, the use is non commercial and is otherwise in compliance with the license. See: http://creativecommons.org/licenses/by-nc/2.0/ and http://creativecommons.org/licenses/by-nc/2.0/legalcode.