Article Text

Abstract
Since 1 July 2001 the Joint Commission on Accreditation of Healthcare Organizations (JCAHO) has required each accredited hospital to conduct at least one proactive risk assessment annually. Failure modes and effects analysis (FMEA) was recommended as one tool for conducting this task. This paper examines the limitations of FMEA and introduces a second tool used by the aviation and nuclear industries to examine low frequency, high impact events in complex systems. The adapted tool, known as sociotechnical probabilistic risk assessment (ST-PRA), provides an alternative for proactively identifying, prioritizing, and mitigating patient safety risk. The uniqueness of ST-PRA is its ability to model combinations of equipment failures, human error, at risk behavioral norms, and recovery opportunities through the use of fault trees. While ST-PRA is a complex, high end risk modelling tool, it provides an opportunity to visualize system risk in a manner that is not possible through FMEA.
- patient safety
- sociotechnical probabilistic risk assessment (ST-PRA)
- root cause analysis
- quality improvement
- risk management
Statistics from Altmetric.com
- patient safety
- sociotechnical probabilistic risk assessment (ST-PRA)
- root cause analysis
- quality improvement
- risk management
It is just 100 years ago that Orville and Wilbur Wright flew their inaugural flight at Kitty Hawk.1 There was a considerable degree of scepticism associated with that expedition. Each component of their aviation system represented a potential failure that might catastrophically end their historic 120 foot flight. While Orville and Wilber knew nothing about failure modes and effects analysis (FMEA) as a tool to assess risk, they attempted to manufacture and inspect each component carefully, to the best of their abilities, to ensure that the risk of a critical failure was minimized.
Nearly half a century after the Wright brothers’ first flight, more formalized methods of risk assessment appeared. FMEA emerged as a methodology for ensuring that potential failure modes are analyzed and their effects understood.2 FMEA is a process for identifying the failure effects associated with individual failures within a system. The design philosophy embodied in FMEA is that individual failures cannot be allowed to result in an adverse outcome.3 When a single failure is identified, the designer has two options—either to reduce the probability of failure to an acceptable level or to add redundant safety mechanisms to mitigate the effects of failure.
As aviation expanded beyond a military tool into a form of everyday travel, safety expectations also intensified. For an industry like aviation with a high degree of potential harm, former design requirements that served to mitigate single individual failures were no longer satisfactory. Reliability and safety analysts began to examine the contribution of multiple failures and combinations of failures that had the potential to lead to catastrophic occurrences. Designers turned to probabilistic risk assessment (PRA) as a tool that would allow risks to be analyzed in ways that were not previously possible with FMEA.3 PRA is a process for modelling the combinations of multiple failures leading to a specific undesirable outcome. When the modelling includes the contributions of behaviors or human error as a cause of the adverse outcome, it becomes known as “sociotechnical” probabilistic risk assessment (ST-PRA).
In the three years since the Institute of Medicine’s report on medical errors and patient safety was released, considerable attention has been drawn to the problem of iatrogenic injury.4 It has become clear that health care is a high risk, error prone industry. In this way, it is not dissimilar from other industries in which lives may be at risk. For example, innumerable “human factors” such as practitioner fatigue and overwork can contribute to poor patient outcomes. In addition, the use of technology in health care has expanded exponentially over the last quarter century. Matching the growing enthusiasm for interventions to improve safety for patients is an awareness of the need for further understanding of the ways in which other industries have dealt with similar low frequency, high impact situations in which technology and human error are contributors.4 In this context, it is apparent that health care has not fully embraced a systems approach to analyzing the innumerable patient care processes that contribute to medical errors.5 We must capitalize on the knowledge and tools provided by other industries to improve patient safety.
This paper gives healthcare providers, administrators, and researchers the opportunity to examine the benefits of ST-PRA as an alternative to FMEA for proactively identifying, prioritizing, and mitigating patient safety risk through its applicability to low frequency, high risk events in health care.
RISK MODELLING WITHIN HEALTH CARE: ANALYZING PROCESSES
Overview
The delivery of health care relies upon a complex series of interactions between practitioners and patients known as “processes”. The patient who moves through the healthcare system experiences these interactions from the onset of illness to the termination of the relationship—for example, medication delivery, transfusion of a blood product, completion of a surgical procedure (fig 1). In addition, the patient experiences interactions with a number of pieces of technology that assist practitioners in making a diagnosis or providing treatment—for example, radiology equipment, medication delivery pumps. Each piece of equipment also has its own intrinsic rate of failure. Systematically analyzing these interactions between patients, providers, and technology can be helpful in assessing how specific system components contribute to the risk of an adverse patient occurrence.

Clinical processes between providers and patients associated with medication delivery.
Examples of process analysis techniques
There are several examples of process analysis methods available in industry that may be relevant to healthcare. Root cause analysis (RCA) is a multidisciplinary method used to retrospectively identify aberrant processes that contribute to an adverse patient event.6 FMEA methodology was used initially in the automotive industry to identify problems in product design and manufacture (for example, shock absorbers) before a potential failure in production occurred.7 Given the retrospective nature of RCA, prospective process identification methods such as FMEA and ST-PRA are a necessary addition for improving safety in high risk healthcare settings. In fact, the JCAHO now requires the incorporation of prospective process analysis methods into organizational patient safety plans.8
Strengths of FMEA
FMEA is one example of prospective process analysis that has been used successfully in industry for a number of years to detect potential defects in products and production processes. The technique has a number of significant strengths. FMEA is a prospective process analysis technique.7 When a system designer introduces a new product or production process, FMEA provides the structured technique to aid the designer in understanding its potential failure effects. Applied to health care, for example, FMEA may be used to identify the potential failure effects of a new medication labelling system. In contrast, a retrospective process analysis technique such as RCA would wait for an adverse outcome with the medication labelling system before analyzing the process for potential change.7 FMEA is known as a “bottom up” approach. It begins by asking the question “what happens if the medication label printer loses power in the middle of a label run?” The model then seeks to identify all the potential effects that may result from this failure in the dispensing process.
Weaknesses of FMEA
Despite the strengths of FMEA as a process analysis technique, there are reasons to believe that these methods will fall short in being able to produce meaningful results in terms of patient safety interventions for the healthcare industry. Firstly, FMEA is generally used on a local level without the benefit of multi-institutional experiences to help guide the model.4–5,8,9 Secondly, individual healthcare institutions often limit their focus to their own safety problems and inadequacies. As a result, the institutions are concerned about allowing their data to become transparent to the public or other professionals because they may be exposing themselves to litigation or further public scrutiny.4,10 For example, if hospital X has had two serious events relating to child abduction in the last year, it may choose to improve the processes surrounding pediatric inpatient security in the institution using FMEA. However, even if it discovers important information that can assist other institutions and prevent duplication of effort, it is neither obliged nor is it likely to be interested in sharing that information publicly.4 Hence, patient safety interventions need to provide a broader view that takes into account the ideas and strategies of multiple institutions.4–5,8,9 Thirdly, even when FMEA or RCA are performed flawlessly, these qualitative tools are not designed to assist in identifying risk point combinations in complex systems that are more likely to lead to errors.11 For example, FMEA may identify both a certain physician order entry error and a specific pharmacist’s behavioral norm as recoverable events—that is, they would not individually lead to an adverse event. However, FMEA does not allow the analyst to model the effect of the combination of both the physician error and the pharmacist norm, a combination of two events that actually leads to an incorrect medication administration. Finally, these qualitative tools do not assist the institution in prioritizing interventions based upon quantitative risk. If the members of the FMEA team inappropriately assess the risk associated with a particular process, the institution may expend considerable resources correcting a problem that, in fact, may have little to do with the risk of a recurrent event.
PROBABILISTIC RISK ASSESSMENT (PRA): PROCESS ANALYSIS AND DECISION SUPPORT
Overview
Decisions in health care are made with a consideration of the risk, benefits, costs and outcomes.10 As far as possible, practitioners attempt to use the evidence base that has been evolving in the peer reviewed literature (although limitations of this evidence base are fully recognized).10 In decision analysis a problem is disaggregated into its component parts to allow for its improved understanding. A model is built in which the relationships and probabilities of the components are identified and linked. Many decision support models can alter inputs over a range in order to provide a sensitivity analysis of the problem under review.12
Probabilistic risk assessment (PRA) is a tool that is a hybrid between the process analysis techniques described above and decision support models.11,13 It originated in the mid 1970s as a tool to improve the safety of nuclear power plants14,15,16,17,18,19,20,21,22,23,24,25 and has been applied subsequently in a variety of settings ranging from aerospace to manufacturing and natural disasters.11,15,18–19,25–30
The broad scope of analysis afforded by PRA allows hospital management the opportunity to decide on organizational versus individual level interventions for safety.31–36 Decision making in complex healthcare systems requires a balance between safety improvements and their expected impact on other competing priorities in an organization such as cost, timeliness, technical feasibility, and other components of organizational behavior.35,36 PRA has the ability to model these complex systems, assess risk points, and develop strategies for intervention based upon the probability of an undesirable event occurring. In this way, ST-PRA advances the qualitative work of FMEA and RCA into a quantitative sphere.
THE PROCESS OF PROBABILISTIC RISK ASSESSMENT
Identifying the outcome of interest
Compared with FMEA, PRA uses a “top down” approach that identifies the undesirable outcome to be modelled first, and then investigates and models all combinations of process failures that may lead up to this event. This is what distinguishes ST-PRA from FMEA: FMEA starts with a process to be analyzed whereas ST-PRA starts with an undesirable outcome.
Assembling the fault trees
Fault trees are the tools used in PRA for visualizing risk. They begin with the identification of the “top level event” or outcome of interest. Fault trees are then populated by three principal elements: basic events, “AND” gates, and “OR” gates. Figure 2 represents a simple fault tree that models the undesirable outcome of a medication pump failing to deliver medication. This fault tree models three combinations of failures leading to the top level event. Immediately below the top level event is an “AND” gate which indicates the two functional failures that must occur to create an undetected stop in medication delivery. The pump must stop “AND” the alarm must fail to notify the practitioner that the pump has stopped in order for the top level event to occur. Neither one of these events is sufficient by itself to cause the next higher failure state. Directly below the event “Pump stops” is an “OR” gate, meaning that any individual item below the gate is sufficient by itself to cause the next higher level failure state. For example, an electrical power failure, a pump motor failure, and tubing occlusion are each independently associated with the pump failing to deliver the medication. “Basic events” are the fundamental failures or conditions that can be combined either by “AND” or “OR” gates to create higher level states. Examples of basic level events include human error and equipment failures. These three components—“AND” gates, “OR” gates, and basic events—are the principal elements of any fault tree. Fault trees can illustrate both the robustness and the vulnerability of the system just by the very shape of the tree. In our example the pump and the alarm work together. Two independent failures are therefore required to cause the top level event. This is an example of a robust system because the system is tolerant of any individual failure of its components. Alternatively, a vulnerable system is one in which the system is at risk because any of its components individually can lead to system failure. Designing system components so that they perform as expected a high proportion of the time is an example of how reliability can be built into system design and how patients can be protected from harm. For example, if a blood product filter is only 50% reliable at removing white blood cells, then susceptible patients will be at risk for a transfusion reaction half the time. The outcome of interest is a transfusion reaction and the filter is a component that contributes to the vulnerability of the system.

A simple fault tree depicting an undetected medication pump failure.
Developing the model
One useful method for developing fault trees in health care involves assembling a multidisciplinary team familiar with the processes and outcomes under analysis to act as the model builders. The work then proceeds in two steps. First, the team works with a fault tree software package to identify the combinations of failures that can lead to the undesired outcome as described above. If, for example, the top level outcome of interest is “medication delivered to the wrong patient”, the team begins by brainstorming all the potential process steps that can lead to this outcome. This allows the team to recognize where risk points in the process may occur and to build opportunities for mitigating those risk points. An interdisciplinary group focused on this process failure would expect to allocate approximately 1–2 weeks to build this model. For “medication delivered to wrong patient” the typical hospital model would include more than 500 errors, contributing behaviors, and equipment failures, and 150–250 combinations of failures that would lead to wrong medication delivery.
Adding probability estimates
The real power of fault trees and the major advantage of PRA over FMEA is in performing probabilistic analyses. Once the tree structure is developed, the team begins the second part of model development by adding probability estimates to the basic events. In practice, most healthcare systems do not have actual rate data for the underlying events. In addition, the top level events can often be benign or masked by the patient’s illness and thereby tend to be underestimated in occurrence data. Furthermore, the teams often have limited information on human error and equipment failure rates available to them. Nonetheless, the risk modelling team must estimate the rates of occurrence based upon the experience of the team and/or the published rates in the literature. Probability estimates grounded in the experience of the team, while highly variable, are better than no probability estimates at all. When there is clearly no consensus related to estimated rates, the team’s discussions can be facilitated by “anchoring” the probability estimate around a starting point such as one error per 1000 attempts (1×10⁻³). The team will then adjust its estimate in an upward or downward direction through an iterative process before deciding on a final estimate. Teams often begin their assignment of probabilities in PRA as simply too unlikely to occur. In these cases, establishing the ground rules for the assignment of probabilities can be helpful. For example, every basic event must have a non-zero probability of occurrence. In practice, teams quickly gain comfort in the task of estimating error rates and at risk behavior rates.37
As one example of the probability estimation task performed in teams, consider the challenge of arriving at a rate for failure for checking armbands when dispensing medications. This is a commonplace at risk behavior that is not easy to identify in post-event investigations, particularly in terms of a normative rate for a group as a whole. Nurses spend long shifts getting to know their patients, their patients’ diagnoses, and their patients’ medications. Despite policies and procedures to direct the checking of a patient identification band prior to medication administration, nurses admit that, in practice, for a variety of reasons, they fail universally to accomplish this safety check. The team can be questioned about whether they fail to check identification in 1 in 100 doses, 5 in 100 doses, or 50 in 100 doses. Through this repetitive process the interdisciplinary team will arrive at an estimate for the local cultural norm. Experience indicates that these team estimates are more accepted than rates derived from event data and, unfortunately, are often more accurate than the rates predicted by senior management within the hospital.37
Once the probability estimates are assigned throughout the fault tree, the probabilities for each gate and the top level event on the tree are calculated based upon how the events are related to each other through the “AND” and “OR” gates. These gates in the tree provide the mathematical basis for analyzing combinations of failures. For the “AND” gates, the probabilities of basic events are multiplied together, and for the “OR” gates the probabilities are added together, with the overlap then subtracted so as not to double count for the condition when both failures occur simultaneously. Many fault tree programs create a cut set report (a cut set is one of the failure combinations leading to the top level event) which identifies and ranks the combinations of failures leading to the top level event based upon the probability estimates included in the model.38 It is this report that allows the modelling team to identify commonalties across failure combinations and prioritize their risk reduction strategies.
Figure 2 shows the fault tree analysis with the probabilities added to the model. In this sample tree the probability of undetected pump failure is derived at 3 × 10⁻⁶ (a low rate because two independent failures were required). Fortunately, the fault tree software easily computes these complex mathematical computations.38 In practice, once the teams identify the combinations of failures, they have three options available to them for intervention:
-
Intervene through human factors methodologies—for example, by changing system incentives that promote at risk behaviors to alter basic human error rates and at-risk behavior rates.
-
Alter the structure of the fault tree itself by building into the system opportunities for double checks and recovery, thereby making the system less vulnerable and more robust.
-
Create “forcing functions” which are system design creations that cannot be overlooked or bypassed—for example, the creation of different connectors on intravenous pump tubing and enteral feeding pump tubing will prevent catastrophic events related to tube feeds being infused into the venous system of patients, regardless of how tired the practitioner may be.
These system redesigns in health care are powerful tools for improving the safety of patients.
Improving the model
Once the interventions for particular risk combinations are identified, the fault tree model can be updated to reflect the relative influence of the team’s specific interventions on the probability of the top level event. Additionally, as the healthcare system begins to collect actual occurrence data related to the events of interest, the model can be updated with these data to provide real time estimates. In this way, events that occur within the system, even after the model is built, serve to inform and update the risk model. The result is a “living document” that can be updated as continuing event, audit, or focus group data shed new light on the risk being evaluated. One hospital regularly reviews its medication model against reported events to be sure that the model is an accurate reflection of medication delivery in the organization.37 By asking a series of questions such as: “Did the model predict the failure path represented by the event?” and “Does the event provide any information to update the risk model?”, risk management decisions are made from the risk model and not merely by reacting or overreacting to a single event.
Pointers for future research
-
Research is needed to improve methodologies for making a priori estimates of human error rates and at risk behavior rates when actual event rate data are unavailable.
-
Research is needed to develop improved event investigation methodologies that are better suited to feeding organizational risk models (such as collected at risk behavior rate data during an event investigation).
Adding sociotechnical components to the fault tree
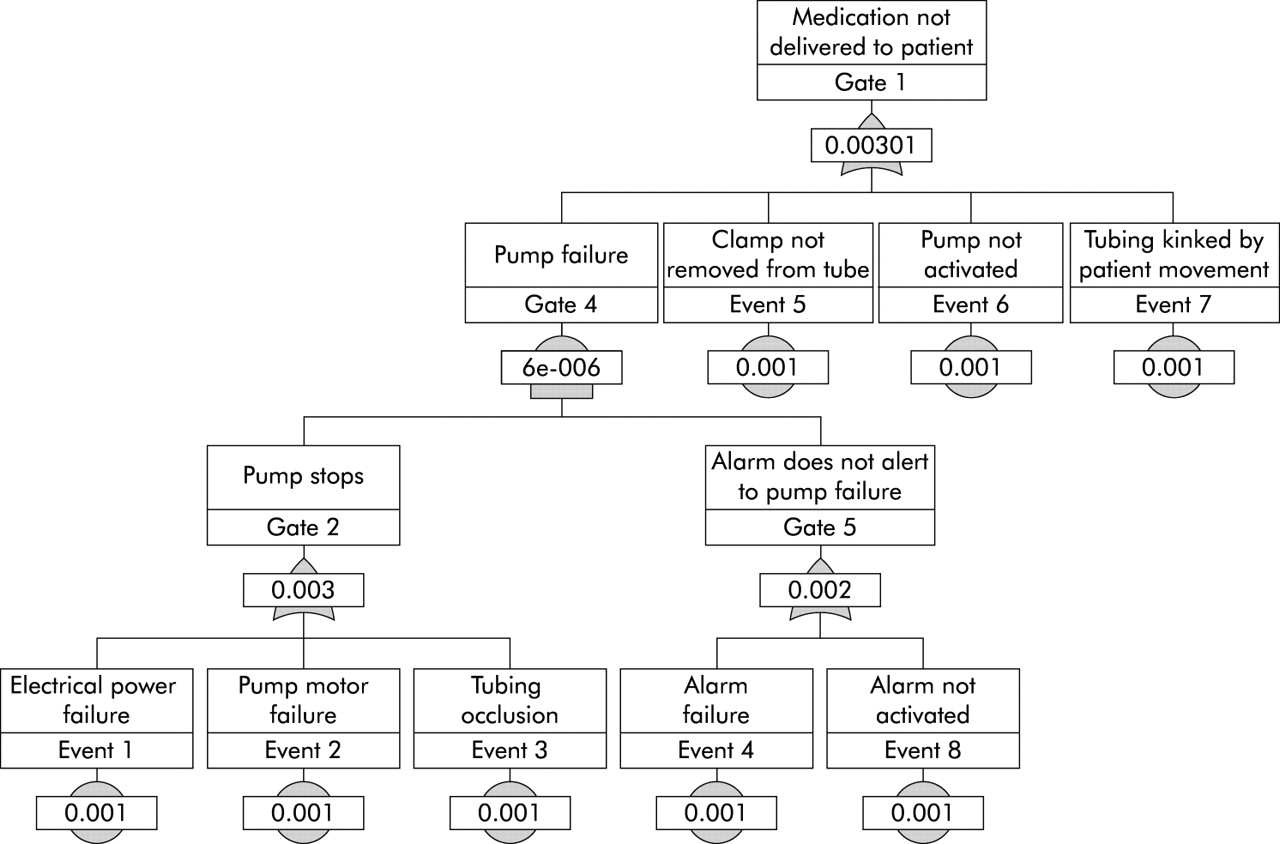
The fault tree in fig 2 is typical of how the equipment designer might see the problem. The designer has produced an outstanding product design whose output is concordant with a six sigma level of reliability (three defects per million). For the equipment manufacturer, a pump failure (undetected stopping of the pump) is the top level event of interest. In the healthcare setting, human behaviors and errors are very important contributors to failure of the system. As a result, the fault tree looks quite different from one from manufacturing because it needs to include the contributions of behaviors and practice variability into the modelling of the top level event. In the hospital the top level event is generally characterized as a failure to provide the patient with the intended care. Figure 3 shows how a medication pump failure might be merged into a broader model that considers the human factors that contribute to failure to safely deliver medication to a patient. In this fault tree we have added three human errors plus one patient factor, all estimated for the purpose of this exercise at 1 × 10⁻³. In this new fault tree the probability of the top level event is increased from 3 × 10⁻⁶ to 3 × 10⁻³ based on the model showing two human errors and one patient factor that can all independently lead to the medication not being delivered. While the numbers may not reflect the actual rate of occurrence, the analysis does illustrate the influence of single dominant human errors against the more robust design of the pump. These human components are important considerations in the vulnerability of a healthcare system. Incorporating them into the PRA model constitutes a transformation from equipment PRA to sociotechnical PRA.

A complex fault tree that incorporates human error into the design of the PRA.
DISCUSSION
PRA is a tool that allows an assessment of risk and a prioritization of risk reduction interventions based upon sequences that have the highest probability of occurrence.39 It also allows for the testing of the reliability of a complex system to achieve risk reduction.24,31,40,41 These models detail all of the steps of a particular process prospectively like the FMEA described above. However, PRA significantly improves upon FMEA by calculating the conditional probabilities associated with health outcomes in complex systems with multiple interactions and dependencies as occur in health care.27,28,29,30,31,32,33,34,35,36,37,38,39
Medical errors are dependent upon systems of care that require redundancy in order to achieve reliability and improve patient safety.42,43 These systems themselves are threatened by the very elements that have made them great.42,44 Healthcare is in many ways different from other industries. It depends upon human interaction between a patient and a practitioner during illness and recovery.42–44 This interaction is emotional, significant, and, some would argue, essential for recovery. However, it is this “humanness” in health care that is also responsible for some of the safety problems.4,42–44 Practitioners are not computers and have a limited ability to process multiple pieces of often-contradictory information. Practitioners need to eat, drink, sleep, and have bathroom breaks. They also have personal lives and stresses that may alter their focus or influence their attention while they are caring for patients. These “human factors” are important considerations when mapping patient safety problems. The ability to include these “sociotechnical” effects into the PRA model improves its use as a tool to facilitate patient safety interventions.15,18,25,30,45–47
Key messages
-
Patient safety problems are a major concern for healthcare institutions around the world. The health care community must learn from other industries that are concerned with low frequency, high risk events if it is to achieve success in reducing medical errors.
-
Clinical processes are a series of interactions between patients, providers, and technologies. An analysis of these processes can provide insights into variability of care and the potential for medical errors.
-
A number of tools exist to prospectively analyze processes in health care. Each of them has its own advantages and disadvantages. Two major tools—failure modes and effects analysis and probabilistic risk assessment—have previously been used in industry.
-
PRA has advantages over FMEA in that it considers multiple combinations of failures and allows identification of critical failure paths.
ST-PRA offers hospitals another tool to have a more risk based patient safety system immediately. For example, with a medication PRA in hand, healthcare providers can view events from a new perspective. New events provide an opportunity for the hospital to update its risk model continuously. The living risk model then becomes the basis for decision making, allowing hospital administrators and practitioners the opportunity to quantify system risk and to identify, before implementation, the relative merits of any patient safety change.
CONCLUSIONS
Much has been learned about patient safety in the complex systems of health care since the release of the Institute of Medicine report. Despite these lessons, low frequency, high risk events continue to occur with some regularity. In order to identify risks, improve system design, and ameliorate the complications in medical care, healthcare providers, administrators and researchers need to consider the use of unconventional tools. Many of these tools, including FMEA and PRA, are borrowed from industry and may provide opportunities for improving patient safety. Each one has its strengths and limitations, but ST-PRA is a more robust tool than FMEA for modelling the complex interaction of multiple failures within a system.
REFERENCES
Footnotes
-
Outcome Engineering is a Dallas, Texas based risk management firm building risk management methodologies for the aerospace and healthcare industries. Mr Marx is a principal in Outcome Engineering LLC.