Article Text

Abstract
Background Diagnostic error is commonly defined as a missed, delayed or wrong diagnosis and has been described as among the most important patient safety hazards. Diagnostic errors also account for the largest category of medical malpractice high severity claims and total payouts. Despite a large literature on the incidence of inpatient adverse events, no systematic review has attempted to estimate the prevalence and nature of harmful diagnostic errors in hospitalised patients.
Methods A systematic literature search was conducted using Medline, Embase, Web of Science and the Cochrane library from database inception through 9 July 2019. We included all studies of hospitalised adult patients that used physician review of case series of admissions and reported the frequency of diagnostic adverse events. Two reviewers independently screened studies for inclusion, extracted study characteristics and assessed risk of bias. Harmful diagnostic error rates were pooled using random-effects meta-analysis.
Results Twenty-two studies including 80 026 patients and 760 harmful diagnostic errors from consecutive or randomly selected cohorts were pooled. The pooled rate was 0.7% (95% CI 0.5% to 1.1%). Of the 136 diagnostic errors that were described in detail, a wide range of diseases were missed, the most common being malignancy (n=15, 11%) and pulmonary embolism (n=13, 9.6%). In the USA, these estimates correspond to approximately 249 900 harmful diagnostic errors yearly.
Conclusion Based on physician review, at least 0.7% of adult admissions involve a harmful diagnostic error. A wide range of diseases are missed, including many common diseases. Fourteen diagnoses account for more than half of all diagnostic errors. The finding that a wide range of common diagnoses are missed implies that efforts to improve diagnosis must target the basic processes of diagnosis, including both cognitive and system-related factors.
PROSPERO registration number CRD42018115186.
- diagnostic errors
- hospital medicine
- adverse events, epidemiology and detection
Statistics from Altmetric.com
Introduction
Diagnostic error may be defined as a missed, delayed or wrong diagnosis1 and has been described as one of the most important patient safety hazards.2 Harmful diagnostic errors are diagnostic errors that result in patient harm.3 In one of the first studies to report the incidence of diagnostic errors in hospitalised patients, The Harvard Medical Practice Study, 14% of all adverse events were classified as harmful diagnostic errors.4 Diagnostic errors have also been reported to account for the largest category of medical malpractice high severity claims and total payouts.5
Despite the importance of diagnostic errors, authors have pointed out the lack of attention the problem has received compared with other patient safety issues.6 7 One basic question that has not been systematically evaluated is the prevalence of diagnostic errors. Prior narrative reviews have estimated that 10%–15% of all diagnoses are erroneous.8 9 The 2015 National Academy of Medicine report Improving Diagnosis in Healthcare concluded that most people will experience at least one diagnostic error in their lifetime.6 Two prior systematic reviews of autopsies reported rates of diagnostic error of 8%–9% for major diagnoses that may have impacted the patients’ survival.10 11 Nevertheless, no prior review has systematically reviewed the literature of hospitalised patients to determine the overall rate of harmful diagnostic error or to describe the range of diagnoses that are commonly missed. Both the prevalence and description of diagnostic errors are fundamental information for understanding and potentially improving the diagnostic process. Given the large literature on inpatient adverse events, we undertook a systematic review to estimate the prevalence and nature of diagnostic errors in hospitalised patients.
Methods
The Meta-analysis of Observational Studies in Epidemiology12 and the Preferred Reporting Items for Systematic Reviews and Meta-Analyses13 statements for reporting systematic reviews were used for our study.
Data sources and searches
With the assistance of a research librarian we conducted a literature search using Ovid Medline All, Ovid Embase, Web of Science and the Cochrane Library from database inception through 9 July 2019. We also reviewed the reference lists of included studies. Details of the full search strategy are listed in online supplementary appendix table 1.
Supplemental material
Study selection
Five reviewers (CGG, BR, PN, PC, LAB) independently screened all titles and abstracts for inclusion. Two reviewers (CGG, BMC) subsequently screened all full-text manuscripts from the accepted title and abstract search. For title and abstract review, articles identified by either author were included in full-text review. For full-text review, differences were resolved by consensus. Inter-rater reliability was assessed using the kappa statistic.14
We included all studies of hospitalised adults that used physician reviews and reported the frequency of diagnostic error. Non-English studies were included and translated using Google Translate.15 We primarily searched for studies of consecutive or randomly selected cohorts, and included studies with patient selection criteria and analysed these separately. We included studies regardless of the timing of the actual occurrence of the diagnostic error if it was evident during the admission. Studies of hospitalised patients that included diagnostic errors that occurred while the patient was an outpatient or during a prior admission were therefore included. We excluded studies that did not rely on physician review to determine diagnostic errors, such as studies based on surveys or administrative data. Studies of consecutive or randomly selected cohorts that included paediatric, obstetric or psychiatric patients were included, but studies limited only to these populations were excluded as were studies limited to single diagnoses, such as tuberculosis or trauma. The later categories were excluded because our primary research question was the overall prevalence of diagnostic errors in hospitalised patients and these populations are less representative of the general hospital population.
Data extraction and quality assessment
Two reviewers (CGG, VPB) extracted all study data. A standardised data extraction form was used to document study characteristics including year of publication, country of study, setting, study design, whether patients were consecutive or randomly selected, definitions of adverse events and diagnostic errors, how the occurrence of adverse events and diagnostic errors were determined, whether adverse events and diagnostic errors occurring prior to or after the admission were included, cohort exclusions, total number of admissions, total number of adverse events, and total number of harmful diagnostic errors.
Two authors (CGG, JLH) independently assessed risk of bias using the Joanna Briggs Institute Checklist for Prevalence Studies.16 Differences were resolved by consensus. For the third item on the checklist related to sample size, if studies did not report a sample size calculation we used the recommended formula for sample size calculation by Naing et al 17 and assumed a prevalence of 1%, and precision of 0.5% and determined the sample size should be 1521 patients. For the sixth criterion, objective standards, we required studies to explicitly define adverse event and diagnostic error and to use a Likert scale to determine causality. For the seventh criterion, we required studies to describe reviewer training and to report a measure of inter-rater reliability.
Five studies separately reported rates of overall adverse events related to diagnosis and preventable adverse events related to diagnosis.18–22 For these studies, we used the rate of preventable diagnostic adverse events per our protocol and report a sensitivity analysis comparing overall diagnostic adverse events and preventable diagnostic adverse events.
Data synthesis and analysis
For studies of random or consecutive case series, the rate of diagnostic error and 95% CI was calculated using the score method.23 Diagnostic error rates were pooled using a random-effects model as described by DerSimonian and Laird.24 Because the rates were often <1%, we used Freeman-Tukey double arcsine transformation.25 Between-study heterogeneity was estimated using the I² statistic. I² values of 25%, 50% and 75% were considered low, moderate and high heterogeneity.26 Subgroup analysis was performed for study variables including geographic location (North America, Europe, remaining countries), decade, single hospital versus multiple hospital, exclusion criteria, type of screening criteria for physician review, method of assessment for adverse event, number of categories of adverse event, whether events prior to and after admission were reviewed and study risk of bias. The same variables were assessed using meta-regression. For meta-regression, between-study variance was estimated using restricted maximum likelihood.27 Small-study effects were assessed by inspection of a funnel plot and Egger’s test.28 The influence of individual studies on the prevalence of diagnostic error was assessed using sensitivity analysis. Statistical analysis was performed using metaprop, metareg and metafunnel commands in Stata/MP, V.15.1 (StataCorp, College Station, Texas).
Results
The initial electronic search found 10 003 manuscripts, of which 2037 were duplicates (figure 1). Additionally, 7 studies were found from other sources including review of the references of included studies, for a total of 7973 studies, of which 7753 were excluded based on title and abstract, leaving 220 for full-text review. Of these, 46 studies met study inclusion criteria. The most common reason studies were excluded after full-text review was that they did not report the number of diagnostic errors, that they were duplicate publications or that they were based on patient or physician surveys. Sixteen of the studies from full-text review were non-English, including six that were ultimately included.29–34 The inter-rater reliability for title and abstract review was moderate (kappa 0.58 (95% CI 0.51 to 0.65)) and substantial for full-text review (kappa 0.72 (95% CI 0.62 to 0.82)).14

Evidence search and selection.
Of the 46 studies that met study inclusion, 24 studies were of random or consecutive cohorts of hospitalised patients,18–22 31–33 35–50 and 22 studies had selection criteria.4 29 30 34 51–68 Online supplementary appendix table 2 describes the characteristics of the random or consecutively selected cohorts. In general, all 24 studies used similar methods to the Harvard Medical Practice Study4 to first determine the rate of adverse events in hospitalised patients, and then categorise the types of adverse event, including diagnostic errors. Twenty-two of the studies were retrospective cohort studies and two were cross-sectional studies that reported 1 day prevalence of adverse events.49 50 Geographically, the studies varied with two studies from the USA,35 41 two from Canada,20 37 five from Central or South America,33 40 43 47 50 eight from Europe,21 22 31 32 36 38 46 48 three from Asia,39 44 45 two from Africa42 43 and one each from Australia18 and New Zealand.19 Seven studies were from single hospitals21 32 33 39 42 45 48 while the remainder were from multiple hospitals. Although cohorts were of random or consecutive admissions, most studies had some exclusion criteria, including 12 that excluded psychiatric admissions,18–22 32 35 37 40 41 46 48 8 that excluded admissions <24 hours,18–20 22 38 40 41 46 5 that excluded obstetric patients20 21 36 46 48 and 8 that excluded paediatric patients.20 21 32 36 37 40 41 46 In terms of how adverse events were determined, 23 studies used a two-stage review process whereby nurses screened admissions with specific criteria and then physicians reviewed the screen-positive charts to determine whether an adverse event had occurred and the type of adverse event, including diagnostic error. The remaining study used a three-stage review,45 in which medical record administrators performed the first screen, then nurses checked the positive screens and then physicians reviewed the positive second screens. Twenty-one of the studies used screening criteria based on the Harvard Medical Practice Study, two used the Institute for Healthcare Improvement Global Trigger Tool39 41 and one did not describe the screening criteria used.32
Supplemental material
All 24 studies defined adverse events as injuries due to healthcare instead of the patients’ underlying disease, but studies varied somewhat on how injuries were defined. Seven studies used the definition of injury used by the Harvard Medical Practice Study, which included prolonged length of stay, death and disability at the time of discharge.20–22 35 36 38 46 The remaining studies used less restrictive definitions of injury without specifying persistent disability at the time of discharge. Studies also operationally defined adverse events somewhat differently. Nineteen of the 24 studies used the same 6-point Likert scale to assess causality with a score of ≥4 corresponding to a >50% chance that the event was caused by medical management counting as an adverse event. The remaining five studies39 41 42 45 48 had the physicians assess yes/no whether an adverse event had occurred. In all studies, once an adverse event was determined to have occurred, the reviewer categorised the type of adverse event, including the diagnostic error category. The studies varied by the number of categories of adverse events however, ranging from 5 to 11. All studies included operative and procedure-related adverse events, diagnostic errors and medication errors. Twenty studies included errors in patient care,18–21 31–33 35 36 38 39 41–44 46–50 13 included hospital-acquired infections,21 31–33 37–39 41 44 45 47 49 50 8 included anaesthesia-related complications,18 20 35–37 40 43 46 7 included obstetrical complications,18 20 35 37 40 43 46 6 included systems errors,18–20 37 40 45 6 included falls,18 21 35 41 43 44 4 included neonatal complications,18 35 43 47 13 had a miscellaneous category20 21 31–33 35 40–42 45 46 49 50 and 1 each included errors related to the discharge process,36 pressure ulcers,44 emergency response39 and preoperative evaluation.36 One last difference among the included random or consecutive cohorts is whether the studies included events prior and after the hospitalisation. Twenty-one of the studies reviewed in some way events prior to the admission, including 12 that included events before and after,18–22 36 38 40 42 43 45 48 and 9 that just included events prior.21 31–33 35 37 41 47 50
Online supplementary appendix table 3 describes the 22 studies with non-random/non-consecutive cohorts. Thirteen studies were retrospective,4 29 51 52 55–57 59 60 63–66 eight were prospective30 34 53 58 61 62 67 68 and one study prospectively screened patients and then later performed retrospective chart reviews.54 Twelve studies were from Europe,29 34 54 56 59–64 66 four from the USA,4 51 57 65 three from Canada,53 55 58 and one each from Asia,68 Australia52 and Africa.67 Eleven of the studies were from a single hospital.29 34 52–55 57 58 62 66 68 All study cohorts had selection criteria, most commonly a limitation on the types of patients reviewed, including only surgical patients,54 internal medicine patients,58 ICU patients,57 64 65 rapid response patients62 and unplanned urgent transfers.68 Two studies consisted of convenience samples.51 58 The Harvard Medical Practice Study oversampled certain high-risk specialties, such as neurosurgery.4 Three study cohorts were half admissions and half inpatient deaths.56 59 63 In terms of how adverse events were determined, 12 of the 22 studies4 30 34 51 54 56 58 59 61 63 66 67 used the same two-step approach as the random/consecutive cohorts with nurses screening admissions for certain criteria and then physicians doing a record review of positive screens. Eight of the 12 studies using a two-stage approach used criteria based on the Harvard Medical Practice Study,4 54 56 59 61 63 66 67 3 did not describe the screening questions30 34 51 and 1 developed their own criteria.58 The remaining 10 studies did not use a screening step and instead had physicians review all the included patients.29 52 53 55 57 60 62 64 65 68 In terms of how the physician determined whether an adverse event occurred, 12 of the 22 studies used the same 6-point Likert scale for causality,4 53 54 56 58 59 61–65 68 7 used yes/no determination52 53 55 62 64 65 68 and 3 did not assess for adverse event occurrence and instead had the physician reviewer directly assess whether a diagnostic error had occurred.29 57 60 Lastly, seven of the studies included events before and/or after the admission,4 52–54 56 59 63 whereas seven did not29 30 57 60 65–67 and nine were unclear.34 51 55 58 61 62 64 68
Supplemental material
Online supplementary appendix table 4 describes the study risk of bias using the Joanna Briggs Institute Checklist for Prevalence Studies. Inter-rater reliability for total risk of bias score was moderate (kappa 0.58 (95% CI 0.41 to 0.76)). The biggest area of bias was in representativeness, largely because most of the studies used screening criteria before physician review and only a fraction of admissions was therefore reviewed and assessed for adverse event and diagnostic error. All the studies reporting random or consecutive cohorts used screening criteria as did 13 of the non-consecutive/non-random cohorts. The 10 studies that did not use screening criteria were limited to select patient populations, including admissions to ‘hospital in the home’,52 adverse events discovered postdischarge,53 intensive care unit admission,55 57 64 65 68 rapid responses,62 admissions with dyspnoea to internal medicine60 and admissions to internal medicine limited to emergency room admissions.29
Supplemental material
The other areas with common study limitations were objective standards for defining adverse events and diagnostic errors and reviewer training. To meet the criterion for objective standards, we required studies to explicitly define adverse events and diagnostic error and to use a Likert scale to determine causality. Only 17 of the 46 studies (37%) met this criterion. To meet the criterion for reviewer training, we required studies to describe efforts at reviewer training and to report a measure of inter-rater reliability. Only 22 studies (48%) met this criterion. Lastly, many of the non-consecutive/random sampling studies also did not meet the criterion for sample size.
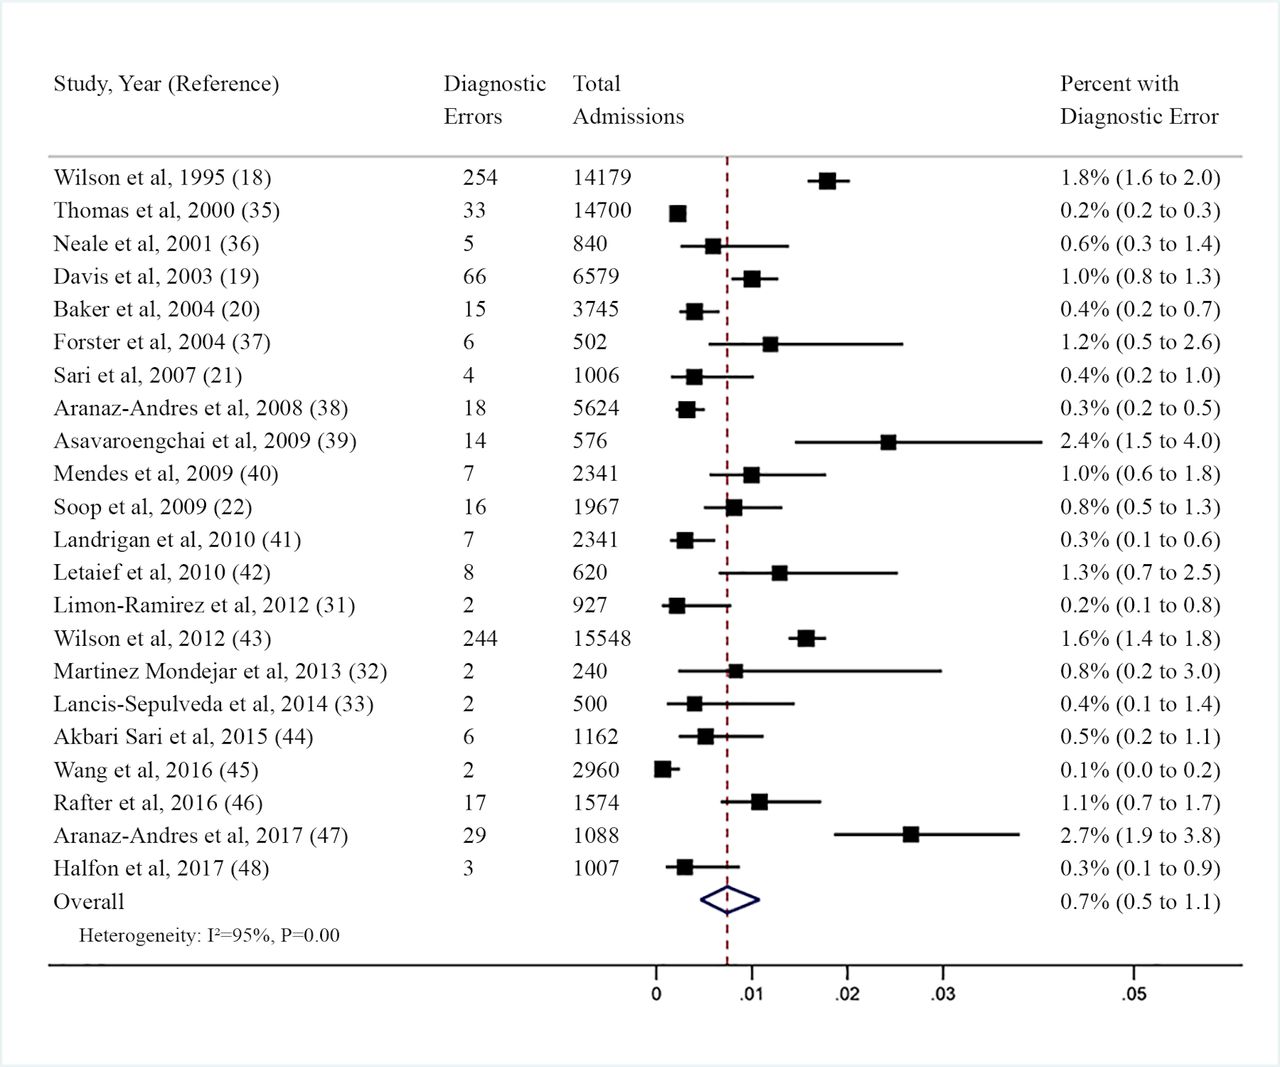
Figure 2 is a forest plot of 22 of the studies of random or consecutive cohorts using random-effects meta-analysis. The two studies that reported 1 day prevalence of diagnostic errors were not pooled with the studies that reported rates for the full hospitalisation. The overall pooled rate of diagnostic error was 0.7% (95% CI 0.5% to 1.1%). Because the studies of random or consecutive cohorts all defined diagnostic errors as subtypes of adverse event and therefore required patient harm to have occurred, our rate only includes harmful diagnostic errors.3 Individual study rates ranged from 0.1% to 2.7%. Studies with patient selection criteria that were not included in the meta-analysis reported more variable rates of diagnostic error, ranging from 0.02% of admissions from a New York State insurance database51 to 8.0% of patients that either died or were transferred to the intensive care unit within 24 hours of admission (online supplementary appendix table 3).68 In general, studies with high-risk selection criteria such as rapid response team calls,62 intensive care unit transfers64 or non-elective admissions29 reported higher rates of diagnostic errors. The three studies that directly assessed diagnostic error without first categorising it as a subtype of adverse event reported rates of 0.7,57 2.4660 and 4.6%,29 although the study with the higher rate reported total diagnostic errors instead of harmful diagnostic errors.

Forest plot of prevalence of diagnostic errors.
For the 22 studies in the meta-analysis, we found high heterogeneity (I²=95%, p<0.001). All subgroups still had high heterogeneity except the five studies that excluded obstetric patients and the eight studies that excluded paediatric patients (table 1).
Subgroup analysis
We performed meta-regression with each of these study variables as well as number of categories of adverse event and found that only study geographic location was statistically associated with diagnostic error (p=0.03, R²=0.35). Studies from countries outside Europe or North America reported higher rates of diagnostic error. To further explore the overall heterogeneity, we then separated out the rate of diagnostic error into three steps—the rate of patients that were screen positive using the screening criteria, the rate of screen-positive patients that were found to have adverse events by physicians and the rate of diagnostic errors among patients who were found to have adverse events. Using these three rates in meta-regression, we found that 19% of the heterogeneity was due to variation in rate of positive screens, 31% was due to variation in the physicians determining adverse events and 49% was due to the division of adverse events into diagnostic errors. Sensitivity analysis removing individual studies or subgroups did not influence the overall pooled result or heterogeneity. Sensitivity analysis using total diagnostic errors instead of preventable diagnostic adverse events from the five studies that reported preventable diagnostic adverse events found an unchanged overall pooled rate of 0.7% (95% CI 0.4 to 1.3). There was evidence of small study effects on the prevalence of diagnostic error (p=0.003), with small studies reporting lower rates of diagnostic error (online supplementary appendix figure 1).
Supplemental material
Most studies did not describe the diagnostic errors in detail, although 8 studies described 136 delayed or missed diagnoses (online supplementary appendix table 5). Table 2 lists the delayed or missed diagnoses that occurred more than once.
Supplemental material
List of the most frequent delayed or missed diagnoses
The most common delayed or missed diagnoses were malignancy, pulmonary embolism, aortic aneurism, congestive heart failure, urinary tract infection and gastrointestinal perforation. Most of the missed cancers were gastrointestinal, including five missed colorectal cancers, and one each of appendiceal, oesophageal, pancreatic, gastric and duodenal cancers. Additional missed cancers were gastric metastases, uterine, renal cell and chronic myeloid leukaemia. The 14 diagnoses listed in table 2 constitute more than half of the total number of missed diagnoses.
Discussion
In total, we found 22 studies of consecutive or randomly selected admissions that reported rates of harmful diagnostic errors. The overall pooled rate using random-effects meta-analysis was 0.7% of admissions. In 2016, there were 35 700 000 admissions in the USA.69 If the number of admissions is multiplied by our estimate of the frequency of diagnostic errors, it equates to 249 900 harmful diagnostic errors annually.
Our estimate differs from prior estimates of the frequency of diagnostic errors that studied different patient populations and used different study methods. Two prior systematic reviews of the autopsy literature reported rates of missed diagnoses that may have impacted patient survival of 8%–9%.10 11 A prior report based on three outpatient studies estimated that the rate of diagnostic error for outpatient visits was 5.08%.70 Prior narrative reviews have estimated that 10%–15% of all diagnoses are erroneous.8 9 The National Academy of Medicine 2015 report Improving Diagnosis in Healthcare reported that ‘the best estimates indicated that all of us will likely experience a meaningful diagnostic error in our lifetime’.6
Our estimate differs from these prior estimates because it is derived from studies of a specific patient population and used a specific methodology to assess the frequency of adverse events and diagnostic error. Because the studies of random or consecutive cohorts all defined diagnostic errors as subtypes of adverse event and therefore required patient harm to have occurred, our rate only includes harmful diagnostic errors. Some diagnostic errors may not result in patient harm.3 Also, many of the included studies used a relatively specific definition of adverse event that required injury to the patient that involved prolonged length of stay or disability at the time of discharge. One prior systematic review of eight studies of adverse events in hospitalised patients found a median of 9.2% of patients suffered an adverse event, of which 7.5% were diagnostic errors.71 Although these authors did not perform meta-analysis, the product of these two unweighted medians is very similar to the current estimate. A more recent systematic review that included patients in varied settings found a pooled rate of adverse events of 6%, of which 16% were related to diagnosis.72 Although these authors did not perform meta-analysis of the prevalence of diagnostic errors, this equates to a rate of approximately 1%.
Another finding of our review is the relative frequency of certain delayed or missed diagnoses, although we were disappointed that only a minority of studies included an actual description of the missed diagnoses and even fewer described the initially incorrect diagnoses. Here, we found that 14 diagnoses made up more than half of the delayed or missed diagnoses and that many of them are relatively common such as malignancy, pulmonary embolism, congestive heart failure, urinary tract infection and sepsis. Many of these diagnoses have previously been reported to be commonly missed including cancer,73 colorectal cancer,74 pulmonary embolism,75 aortic aneurism,76 congestive heart failure,77 gastrointestinal perforation,78 appendicitis,79 subarachnoid haemorrhage80 and subdural haematoma,81 skeletal fracture,82 acute coronary syndrome83 and delirium.84 Urinary tract infection has been previously associated both with underdiagnosis85 and overdiagnosis.86
Although based on a relatively small proportion of the included studies, this is the first list based on the published literature that synthesises the range of delayed or missed diagnoses in hospitalised patients. The fact that a wide variety of relatively common diagnoses are included implies that improving diagnosis needs to involve improving the basic clinical process of diagnosis, which may involve both the clinicians’ cognitive skills as well as system-related factors.1 85 On the other hand, it is also noteworthy that certain missed diagnoses were relatively common which potentially offers opportunity to target certain diseases. Colorectal cancer, for example, was found to be one of the most common missed diagnoses. Although unfortunately no details were provided in the included studies about the circumstances related to these missed diagnoses, a wide range of factors are known to be associated with missed or delayed diagnosis of colorectal cancer, including poor access to care,87 health disparities,88 poor clinician knowledge related to screening,89 poor shared decision making,90 low health literacy91 and technical issues related to colonoscopy including missed or incomplete polypectomy, incomplete prep and missed cancers.92 The Colorectal Cancer Control Programme by the Centers for Disease Control and Prevention in the USA93 is an example of a multifaceted programme that seeks to improve colorectal cancer screening among underserved populations. Guidelines have also been published recommending the adoption of certain quality measures to improve the performance of colonoscopy.92 94
Our estimate of the rate of diagnostic error has three major limitations based on the limitations of the literature. The most basic is that the included studies used physician review to determine whether an adverse event had occurred and to categorise the type of adverse event, including diagnostic errors. The accuracy of this approach is unknown since there is no alternative gold standard. Physician review has multiple potential biases that can affect the determination of adverse events, such as hindsight bias after poor outcomes.3 95 Twenty-two of the studies from the meta-analysis were retrospective, and important information pertaining to adverse events and diagnosis may be missing from medical records.4 35 Another limitation of physician review of adverse events is limited inter-rater reliability. Twelve of the studies reported kappa statistics, ranging from 0.4 to 0.87, generally falling in the moderate range.96
A second major limitation of our study is that the included studies in the meta-analysis all used a multistage review process in which nurses used initial screening criteria. Not all studies reported the proportion of admissions that were positively screened for review, but the reported range was 5%–62%, with most falling in the 15%–45% range (online supplementary appendix table 2). To construct our estimate for the prevalence of diagnostic error, we divided the number of diagnostic errors identified by the total number of admissions screened as was done by prior studies of adverse event rates.35 71 97 This method assumes that patient records that were not positive for one of the screening criteria were all without adverse event, which is unlikely to be true. This means that our estimated frequency of diagnostic errors should be interpreted as the minimum prevalence.
The third major limitation of our estimated rate is the finding of high statistical heterogeneity. This likely reflects both clinical and methodological differences between the included studies. As previously discussed, studies varied somewhat by geography, year, exclusion criteria, screening criteria, method of defining causality and adverse events and risk of bias. Another unavoidable source of potential heterogeneity is that the different studies used different reviewers. To try to understand the heterogeneity, we performed subgroup analyses and meta-regression using these variables and found that only geographic location was significantly associated with rate of diagnostic error, accounting for 35% of the variation. Using meta-regression we found that approximately half of the variation occurred at the step where adverse events were categorised into diagnostic error or other types. This step was commonly poorly described in the included studies because the focus of these studies was identifying adverse events rather than categorising the types of adverse events, such as diagnostic errors. Statistical heterogeneity is common in meta-analysis of observational studies and is not surprising given our research question. We followed recommended approaches for exploring heterogeneity using prespecified subgroup analysis and meta-regression.98 We also very carefully explored sources of heterogeneity such as subtle differences in how adverse event and diagnostic error were defined (online supplementary appendix table 2). Because we expected heterogeneity, we used random-effects meta-analysis which does not assume that true effect size is the same in all included studies and results in a wider CI. Ultimately, our pooled result should be viewed as the best estimate given the available literature of the true rate of harmful diagnostic error in hospitalised patients.
An additional limitation is that we used Google Translate for non-English studies, although Google Translate has been reported to be accurate for extracting data for systematic reviews.15 A final limitation is that our search preceded the publication of a recent systematic review of the adverse event literature, which may have improved our search terms and yielded additional studies.72
Conclusion
In conclusion, we found that a minimum of 0.7% of hospitalised adult patients have harmful diagnostic errors. A wide range of diseases are missed, including many common diseases. Although a relatively limited number of included studies described the missed diagnoses, 14 diagnoses accounted for more than half. The fact that a wide range of common diseases are missed implies that efforts to improve diagnosis must ultimately target the basic processes of clinical diagnosis, including both cognitive factors as well as system-related factors. The finding that 14 diagnoses account for more than half of all diagnostic errors also suggests opportunity for certain diagnoses to be targeted.
References
Footnotes
Contributors All authors participated in the design of the study and in the writing of the manuscript and have seen and approved the submitted version. No author received any funding related to this report or its publication.
Funding The authors have not declared a specific grant for this research from any funding agency in the public, commercial or not-for-profit sectors.
Competing interests None declared.
Patient consent for publication Not required.
Provenance and peer review Not commissioned; externally peer reviewed.
Data availability statement All data relevant to the study are included in the article or uploaded as supplementary information. No additional data available.