Article Text

Abstract
Objectives—The purpose of this study is to demonstrate to what extent an evidence based decision model can improve physicians' decisions and whether a selective use of the decision model is feasible.
Methods—Four experienced vascular surgeons were asked to make a treatment decision for 137 “paper patient” cases with asymptomatic abdominal aneurysms. Their decisions were compared with the optimal treatment as calculated by a computerised evidence based decision analytical model.
Results—Surgeons agreed with the model's advice based on life expectancy in 81% of the cases, and decided to operate in only 12% of the cases for which there was no agreement. Surgeons' decisions differed from the decision model's calculated optimal treatment, in particular, for older patients with aneurysms of intermediate size and with many risk factors, and for younger patients with small aneurysms and few risk factors. Not all these decisions, however, were reported to be more difficult.
Conclusion—Use of a decision analytical model might lead to more appropriate decisions and a better quality of care. Selective use of the decision tool for difficult decisions only would be more efficient but is not yet feasible because reported decision difficulty is not strongly related to disagreement with the decision tool.
- physicians' decisions
- decision support
- decision analysis
- quality of care
Statistics from Altmetric.com
Key messages
-
An evidence based decision analytical model can be used to individualise treatment plans for patients and to make more appropriate treatment decisions leading to a better quality of care.
-
Such a tool can be used to improve clinical decision making by helping to analyse why a physician's decision based on clinical intuition disagrees with the decision tool's advice.
-
Selective use of the decision tool for difficult decisions only would be more efficient than using the tool for all decisions, but this is not yet feasible because reported decision difficulty is not strongly related to disagreement with the advice of the decision tool.
What this paper adds to the subject
This study shows that the use of evidence based decision analytical tools for individualising treatment plans for patients can be helpful in improving clinical decision making by showing physicians why their clinical decisions deviate from the advice of the decision tool, and by identifying those cases for which it would be wiser to use the model than relying on clinical intuition only.
Clinical guidelines are becoming increasingly important for providing good quality care.1–3 These guidelines are preferably based on empirical evidence: a decision problem is first analysed and the available empirical evidence from the literature is evaluated and incorporated into a guideline. Another approach is the explicit method.4 For different groups of patients the outcomes of possible treatment options are estimated and quantified. The outcomes of several treatment options are based on individualised risk factors of patients, such as in the revised Dutch guideline for the management of increased levels of cholesterol.5 These individualised treatment plans might differ from the treatment indicated by general guidelines, as was reported by Protheroe et al in a study on the treatment of atrial fibrillation.6 It is to be expected that the increasing amount of epidemiological and genetic evidence about individual risk factors for a disease or treatment will lead to more individualised treatment plans for patients, and hence to more appropriate treatment decisions and a better quality of care. Trials often do not have enough patients included to allow analysis of subgroups, as is the case in the small aneurysm trial.7 Decision analysis is one of the methods which can be used to calculate individualised risk profiles of patients.8 This is likely to become more common with the development of increasingly more sophisticated computer software.
A possible drawback of these types of guidelines and models is that they cost more time and effort from physicians than using no or general guidelines because an individualised risk profile should be made for each patient (although computerisation can reduce the extra effort needed). It is therefore unlikely that a decision analytical model will be used in daily practice for all patients. In addition, compliance with the advice of the decision model might be problematic if it disagrees with the clinical intuition of the surgeon.910 If it is possible to determine situations for which clinical intuition is inadequate for patient specific treatment plans, guidelines with individualised risk profiles could be used only in these instances which might lead to a more efficient use of the guidelines. In addition, discrepancies between physicians' decisions and the calculated optimal treatment according to a decision analytical model can be used in teaching physicians to make better decisions.
In the Leiden University Hospital a decision tool for constructing individualised risk profiles is used to improve the treatment of patients with asymptomatic abdominal aortic aneurysms. A computerised evidence based decision analytical model was developed to calculate the optimal treatment for each patient. In order to evaluate the quality of physicians' decisions and to determine for which patients clinical experience is inadequate, we studied the agreement of treatment decisions between surgeons and the decision analytical model. We further aimed to determine whether the decisions on which surgeons disagreed with the decision model were reported to be more difficult.
Methods
RESPONDENTS
Four surgeons from the University Hospital of Leiden with 5–15 years' experience in a teaching and tertiary referral hospital participated in the study which was performed in 1994.
DECISION ANALYTICAL MODEL
An abdominal aortic aneurysm is a potentially life threatening disorder because of the gradual increase in the size of the aneurysm with time and hence the risk of rupture. Two management strategies are available: elective surgery or watchful waiting. The decision as to which of these two strategies to use depends mainly on the mortality risks involved—the risk of surgical mortality or the risk of dying from rupture of the aneurysm when the decision is not to operate. The generally accepted policy for large aneurysms (>5–6 cm diameter) is prophylactic surgery, while for small aneurysms a more conservative approach is preferred. This diameter threshold is a matter of debate, especially in patients with an increased risk of operative mortality.1112 A decision analytical model was developed which incorporated the various risk aspects of this decision.1314 The model is a Markov decision tree that simulates both the natural history of disease and the effects of watchful waiting and surgery. The literature on the natural history and treatment of abdominal aortic aneurysms was used to quantify the analysis. At the time of the study data from about 30 articles were included in the analysis and, currently, data from 139 articles are included. Although the database has increased over time with additional literature becoming available, this has not changed the assumptions of the model. We compared data from publications up to 1990 with those published earlier and found no change over time in mortality from either elective surgery or from emergency surgery (means of 0.052 and 0.054 for elective surgery (p=0.77) and 0.446 and 0.475 for emergency surgery (p=0.048)). Likewise, data from the recent “small aneurysms trial”7 did not change the evidence base of the model, nor its advice.
Data obtained from the literature were aggregated into several variables: (a) patient characteristics (age, sex, general condition described by risk factors such as hypertension); (b) aneurysm characteristics (measured diameter, expansion rate, rupture risk); (c) mortality rates (mortality after elective surgery, mortality from rupture); (d) aneurysm diameter threshold for watchful waiting; and (e) long term outcome variables (such as risk of prothesis infection). The optimal strategy was calculated by maximised life expectancy. When calculating the optimal policy, decision analysts often take into account the quality of life after treatment and include a discount factor for the value of later life years (under the assumption that later life years are of lesser value).15 The optimal policy was therefore also calculated for maximised discounted quality adjusted life expectancy with time discounting 5% for later life years. The quality adjustment was for the lower quality of life after emergency surgery for ruptured aneurysms when a policy of watchful waiting was chosen.
MATERIAL
We designed 137 patient cases of which 121 cases were based on real patient data and 16 were constructed cases. The cases were characterised by the same factors as were used in the decision analytical model—patient characteristics and diameter of aneurysm as determined by ultrasound (see box 1 for an example of a case). Data from the actual patients were derived from their case histories from the database in the department of vascular surgery.1316 Patients were treated between 1977 and 1984 so the surgeons could not remember a specific patient. Because all patients in our study had undergone surgery, constructed cases were added to enlarge the variation in patient characteristics.
Box 1 Patient 123.
-
General information: age 79 years; male
-
Cardiopulmonary risk:
-
Cardiac: Decompensation (yes); hypertension (no); myocardial ischaemia (yes); previous myocardial infarction (no).
-
Pulmonary: Chronic obstructive pulmonary disease (yes).
-
Renal function: creatinine level 83 mmol/l Diameter of aneurysm: 6.0 cm
PROCEDURE
Surgeons were asked to evaluate the 137 cases in five sessions. They first read the description of the patient, then estimated the operative mortality risk, chose the optimal treatment (surgery or watchful waiting), and indicated the difficulty of the decision on a scale from 1 (very easy) to 7 (very difficult). Their choices were then compared with the calculations of the decision analytical model.
DATA ANALYSIS
Agreement between the surgeons' treatment decisions and the model's calculations of the optimal treatment policy were determined based on maximised life expectancy and discounted quality adjusted life expectancy (that is, adjusted life expectancy). In cases for which there was no agreement the percentage for which the surgeons were more aggressive—that is, chose surgery in preference to watchful waiting—were calculated. In addition, the agreement between these two ways of calculating the optimal treatment was determined. It was anticipated that surgeons' treatment decisions would be more in accordance with the optimal treatment as calculated by maximised life expectancy than by adjusted life expectancy because it was felt that surgeons would find it too complicated to take account of this quality adjustment while making their decision. Kappa coefficients were used as measures of agreement between the surgeons and the model.
To determine the cases in which surgeons disagreed with the recommended treatment of the decision model, the following categories of decisions were made: (1) both the surgeons and the model recommended surgery; (2) both the surgeons and the model recommended watchful waiting; (3) the surgeons chose surgery and the model recommended watchful waiting; (4) the surgeons chose watchful waiting and the decision model recommended surgery. This categorisation was used in the maximised life expectancy model only. All risk factors except age and size of aneurysm were combined into one variable—that is, the number of risk factors present (maximum 7). For simplicity, comparisons were restricted to a simple count of risk factors and were not expanded to a weighted analysis as this was beyond the scope of the study. The mean age of the patients, mean aneurysm size, average number of risk factors present, mean operative mortality risk, and mean risk of rupture of the aneurysm within 1 year and within 5 years as estimated by the decision analytical model were compared in order to describe the differences between patients in the four categories. This was done for each of the four surgeons. Multinomial logistic regression was used to determine which patient characteristics predicted the category in which a patient would be classified. Analysis of variance was used with reported decision difficulty as the dependent variable, decision category as the fixed factor, and the surgeon as the random factor to test the differences in reported decision difficulty between the patient categories.
Surgeons' risk estimates of operative mortality and the model's calculations were compared with the actual data of the 121 paper cases (which were based on real patient data) as follows: (1) mean estimates of operative mortality by the surgeons and the model were compared with the frequency of patients who died during the operation; (2) mean estimates of operative mortality by the surgeons and by the model for the group of patients who died were compared with mean estimates for the group of patients who survived the operation—that is, discrimination (using t statistics to test the difference); (3) a receiver operating characteristic curve (ROC) was calculated for the model and for each of the surgeons to get an indication of how well surgeons as well as the model were able to discriminate between patients who were going to die and those who were not.
Results
SURGEONS' DECISIONS AND THE OUTCOMES OF THE DECISION MODEL
Table 1 shows the percentages of the optimal treatments calculated by the decision analytical model and chosen by the four surgeons for the 137 paper cases for each surgeon separately and for all surgeons together. Only the overall results of all surgeons are discussed here.
Treatment choices for the 137 patient cases of each of the four surgeons and of all surgeons together and the calculated optimal treatments of the maximised life expectancy model (I) and adjusted life expectancy model (II) in percentages
Overall, surgeons decided to operate less often than was advised by the model based on maximised life expectancy (72% versus 85%). On average, surgeons agreed with the model's choice in 81% of cases (69% of the cases for surgery and 12% for “watchful waiting”). When we analysed those cases for which surgeons disagreed with the model's choice we found that surgeons chose more aggressive treatment in 15% of these cases—that is, 3% of the 19% of cases on which they disagreed with the model. When analysing the 121 cases based on real patient data only, the percentage of cases in which surgeons agreed with the model was almost the same. The four individual surgeons disagreed with the model in 24%, 15%, 21%, and 17% of cases, respectively. Agreement between the surgeons and the model as measured with the kappa coefficient was 0.42, 0.46, 0.38, and 0.54 for surgeons 1, 2, 3, and 4, respectively.
Based on adjusted life expectancy, surgeons chose surgical treatment more often than the model (72% versus 49%).The striking shift from a more aggressive surgical approach when policy is based on absolute life expectancies to a considerably more conservative approach on the basis of adjusted life expectancy may seem surprising. This difference is caused by the discounting effect more than by adjusting for quality of life. Discounting leaves intact the full impact of elective surgical mortality while reducing the weight of long term mortality risk of rupture by 3% per year—that is, by 23% over a period of 10 years. Thus, the gains of elective surgery are underweighed compared with the risks, which explains the more conservative choice in a considerable number of patients.
There was agreement between surgeons and the model in 76% of cases (48% for surgery and 28% for “watchful waiting”). Surgeons' treatment decisions were more aggressive in 98% of the cases on which there was disagreement (23.5% of the 24% of cases on which they disagreed). Individual surgeons disagreed with the adjusted life expectancy model in 17%, 32%, 25%, and 23% of the cases, respectively, and were more aggressive than the model in only two cases (both of surgeon 1). The measures of agreement (kappa) between the model and the four surgeons were 0.66, 0.38, 0.51, and 0.55 for surgeons 1, 2, 3, and 4, respectively.
When comparing the maximised life expectancy model with the adjusted life expectancy model, the maximised life expectancy model advised surgery in 37% of the cases in whom the adjusted life expectancy model advised “watchful waiting”. The reverse situation did not occur, so for the remaining cases the advised treatment was the same.
DISAGREEMENT BETWEEN SURGEONS' DECISIONS AND CALCULATED OPTIMAL TREATMENTS BY MODEL, REPORTED DECISION DIFFICULTY AND PATIENT CHARACTERISTICS
We calculated the mean patient characteristics for the four decision categories and the four surgeons. In addition, the mean mortality risks for the patient cases were calculated by the decision model on the basis of patient characteristics. For the sake of clarity, the patient characteristics and mortality risks for the four surgeons were averaged as shown in table 2.
Patient characteristics and mortality risks of cases for which surgeons agreed and disagreed about treatment choice with the maximised life expectancy model
As can be seen in table 2, surgery was recommended by surgeons and calculated as optimal by the maximised life expectancy model (category 1 in table 2) for patients with an average age of 66, large aneurysms and thus a high risk of rupture, and fewer than three risk factors and thus a fairly low operative mortality risk. Patients for whom both surgeons and the maximised life expectancy model recommended watchful waiting (category 2) had an average age of 71, small aneurysms and thus a low risk of rupture, and more than four risk factors suggesting a fairly high operative mortality risk. When surgeons were more aggressive than the model (category 3), patients were older, had aneurysms of intermediate size, a higher risk of rupture, had more than four risk factors, and a high risk of operative mortality. The category of patients for whom the surgeons preferred watchful waiting and the model recommended surgery (category 4) were younger, had small aneurysms, a low rupture risk, less than two risk factors, and a low operative mortality risk.
A multinomial logistic regression analysis was performed to determine which patient characteristics predicted the category in which a patient would be classified. In the nominal regression model category 1 is taken as the reference category and surgeon 4 as the reference surgeon. The nominal regression model predicted best for categories 1, 2, and 4 in table 2 and predicted badly for category 3. All terms (age, size of aneurysm, number of risk factors present, and surgeon) are needed in the final model to estimate the distinction between the four categories. Age is not strongly predictive for the classification. Odds for categories 2, 3, and 4 are 1.12, 1.65, and 1.67, respectively, implying larger differences between category 1 and categories 3 and 4 than between the first two categories. The predictive value of aneurysm size is quite large. Odds for categories 2, 3, and 4 are 1013.07, 26.36, and 46.34, respectively, implying that there are large differences between the four categories. The odds for number of risk factors present for categories 2 and 3 were 33.40 and 11.63, respectively, and were not significant for category 4. Thus the number of risk factors present in cases in category 1 is not significantly different from those in category 4 but is significantly different from those in categories 2 and 3.
There were also some differences between surgeons. Surgeon 1 had more patient cases in category 4 than surgeon 4 (odds ratio 6.35). Surgeon 2 had more patient cases in category 1 than surgeon 4 (odds ratio 4.67). There were no differences between surgeons 3 and 4 and no differences between any of the surgeons with respect to the two middle categories.
Decision difficulty was evaluated as being rather easy with an overall mean of 2.8 on a 7 point scale. Analysis of variance with reported difficulty as the dependent variable revealed significant differences between surgeons (F(3,526) = 3.5, p<0.05) and an interaction effect for surgeons and decision categories (F(3,526) = 5.8, p<0.001). Thus, surgeons differed significantly in reported decision difficulty overall and with respect to the four decision categories. As can be seen in table 3, the reported decision difficulty for categories 2 (both model and surgeons chose watchful waiting) and 3 (surgeons chose surgery, model chose watchful waiting) was evaluated by all surgeons except surgeon 4 to be the most difficult. Surgeon 4 found both the categories on which he disagreed with the model to be most difficult.
Reported decision difficulty by each of the four surgeons for patient cases for which surgeons agreed and disagreed about treatment choice with the maximised life expectancy model's outcomes
ACTUAL FREQUENCY OF OPERATIVE MORTALITY
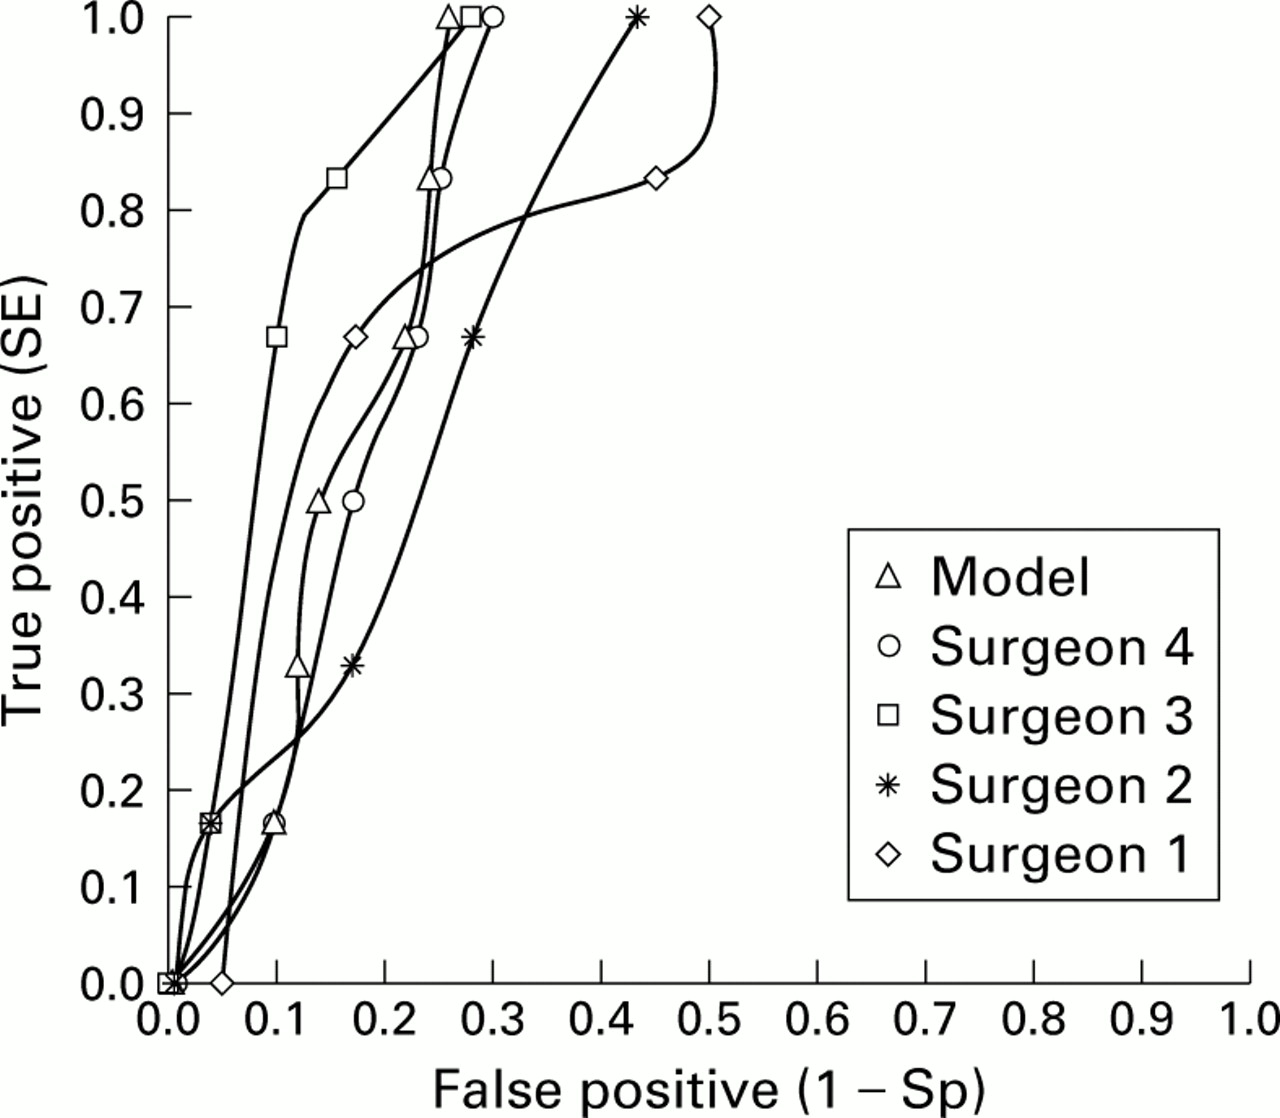
To validate the decision analytical model and the surgeons' decisions we compared the calculated operative risk with the actual percentage of patients who died (based on the 121 cases with real patient data). As can be seen in table 4, the mean estimate of the model is better than the mean estimates of the surgeons (5.6% versus 7.1%), mainly because of the rather high average estimated operative mortality risk of surgeon 4. The actual frequency of operative mortality was 6.1%. The mean estimates of operative mortality by surgeons 1, 2, 3, and 4 were 6.6%, 6.4%, 6.0%, and 9.3%, respectively. When the difference in the mean probability estimates between the group of patients who died and those who survived is taken as a measure of accuracy, the model discriminated better than the surgeons between patients who died and those who survived.17 The difference in the mean estimates of operative mortality risk of the patients who died and those who survived is 12.9% for the model and 2.9%, 1.9%, 4.2%, and 10.7% for surgeons 1, 2, 3, and 4, respectively. In an earlier study ROC analysis of the performance of the model for predicting operative mortality for 283 patients in the Leiden University Hospital resulted in an area under the curve of 0.83.13 This is considered to be rather good.18 In fig 1 ROC curves are shown for the maximised life expectancy model and for each surgeon separately. It can be seen that the accuracy of the model is comparable with that of surgeons 3 and 4. Areas under the curve are 0.84, 0.81, 0.79, 0.90, and 0.82, respectively, for the model and for surgeons 1, 2, 3, and 4.
Mean risk estimates of operative mortality for patients who died (6.1%) and those who survived based on the 121 cases constructed with real patient data
Receiver operating characteristic (ROC) curves for the model and the individual surgeons.
Discussion
Surgeons agreed with the calculated optimal treatment for asymptomatic abdominal aortic aneurysms based on the model of maximised life expectancy in the majority of cases. They displayed different decision behaviour, particularly for older patients with aneurysms of intermediate size with many risk factors and for younger patients with small aneurysms and few risk factors. For both groups of patients there are conflicting indications for surgery—for example, for larger aneurysms and for younger patients surgery is preferred, but for older patients and for smaller aneurysms watchful waiting is preferred. Because of these conflicting indications for surgery, it might be expected that reported decision difficulty for these cases would be higher. However, this was only partly the case. In younger patients with smaller aneurysms this was not so. Surgeons might not realise that, in these patients with a relatively high life expectancy, the cumulative risk of rupture of the aneurysm in the long term is higher than the risk of operative mortality. Reported difficulty of a treatment decision cannot therefore be used as a straightforward indication for a selective use of the decision model. It is notable, however, that the surgeons in this study decided to perform surgery less often than was actually done in the past.
In an earlier study the maximised life expectancy model had been shown to be a good predictor of operative mortality13 and comparable accuracy was found in this study. Two surgeons seemed to be as good or even better than the model. However, this analysis is based on only a few patients who died during the operation and needs to be studied further. A multicentre trial is currently underway to validate the decision model.
A possible limitation of our study is that we used only four experienced surgeons from one hospital. The results of our study cannot therefore be interpreted as a description of how surgeons in general decide about the management of patients with asymptomatic aortic abdominal aneurysms. In particular, the results might be different for less experienced surgeons. Our study showed that the cases about which the surgeons disagreed with the model were those for which the indications for operating versus not operating were in conflict. It is thus not surprising that surgeons disagreed with the model for these cases and it might be expected that other surgeons (more or less) do the same. In addition, our analyses showed that there were few differences between surgeons in patient characteristics in the four decision categories, which suggests that the decision policies were fairly similar.
A decision tool is developed to support the decisions of physicians. It should therefore always be possible for physicians to deviate from the model's advice. The decision model can be helpful in analysing the reasons why a physician disagrees with it. It might be the case that the physician is wrong—for example, in our study surgeons did not take into account the long term risk of rupture. It might also be the case that the model is wrong because the model does not include patient specific risk factors such as diabetes or patient preferences. In this way, the model can be used by (inexperienced) surgeons to learn to make better decisions and to learn when it is advisable to use the model. Our study also shows that it is likely that surgeons will make decisions more in accordance with the model as they gain more experience, as was the case with one of the more experienced surgeons in our study (surgeon 4).
In conclusion, an evidence based decision analytical model for treatment decisions can be used to increase the quality of clinical decisions and as a teaching tool to make better decisions.19 This might lead to better quality of care.
Acknowledgments
The authors would like to thank the surgeons of the Leiden University Hospital for their participation in this study, Profes-sor Dr G van der Wal for his comments on an earlier version of this paper, and Drs H J Ader and D Bezemer for their statistical advice.