Article Text

Abstract
Objectives—To test the feasibility of deriving comparative indicators in all the practices within a primary care group.
Design—A retrospective audit using practice computer systems and random note review.
Setting—A primary care group in southern England.
Subjects—All 18 general practices in a primary care group.
Main outcome measures—Twenty six evidence-based process indicators including aspirin therapy in high risk patients, detection and control of hypertension, smoking cessation advice, treatment of heart failure, raised cholesterol levels in those with established cardiovascular disease, and the treatment of atrial fibrillation. Feasibility was tested by examining whether it was possible to derive these indicators in all the practices; the problems and constraints incurred when collecting data; the variations in indicator values between practices in both their identification of diseases and in the uptake of various interventions; the possible reasons for these variations; and the cost of generating such indicators.
Results—It was possible to derive eight indicators in all practices and in three practices all 26 indicators. The median number of indicators derived was 12 with two practices able to generate eight. There was considerable variation in the use of computers between practices and in the ability and ease of various practice computer systems to generate indicators. Practices varied greatly in the identification of diseases and in the uptake of effective interventions. Variation in identification of ischaemic heart disease could not be explained by a higher prevalence in practices with a more deprived population. The cost of generating these indicators was £5300.
Conclusion—Comparative evidence-based indicators, used as part of clinical governance in primary care groups, could have the potential to turn evidence into everyday practice, to improve the quality of patient care, and to have an impact on the population's health. However, to derive such indicators and to be able to make meaningful comparisons primary care groups need greater conformity and compatibility of computer systems, improved computer skills for practice staff, and appropriate funding.
(Quality in Health Care 2000;9:90–97)
- performance indicators
- primary care
- primary care groups
- feasibility study
- clinical governance
Statistics from Altmetric.com
Introduction
PRIMARY CARE GROUPS AND CLINICAL GOVERNANCE
In England 481 primary care groups have been charged with promoting the health and improving the health care of their local population.1 Each group, involving all primary care professionals, provides and commissions health care for a population of approximately 100 000 in their locality (box 1). The Government has stated that “primary care groups will need to demonstrate that they have a systematic approach to monitoring and developing clinical standards in practices”1 and also that “primary care group members will need to support each other in developing the quality of primary care services they provide (for example, through clinical audits covering the whole primary care group)”.1 The Government intends to manage the performance of the “new NHS”.1 Indicators to compare “performance” between practices will be an essential part of clinical governance, a local system for quality improvement and accountability that is the core component of the new quality programme for the NHS (box 2) 23 Primary care groups will be judged to have “performed” well on the basis of indicators in the national framework for assessing performance,4 other frameworks such as the coronary heart disease framework,5 and targets in “Our Healthier Nation”.6
In 1999 the UK government established primary care groups with the aim of bringing together general practitioners and community nurses in each area to work together to improve the health of the local population.1 These replaced multifunds, locality commissioning groups, individual fund holders, and total purchasing projects. The main functions of these groups are to:
contribute to the health authority's health improvement programmes on health and health care;
promote the health of the local population;
commission health services for their populations;
monitor performance;
develop primary care by joint working across practices;
better integrate primary and community health services.1
Primary care groups are accountable to health authorities and “agree targets for improving health, health services and value for money”.1 There are several primary care groups in each district health authority. This new approach offers primary care the opportunity to further combine health and health care needs at the i ndividual and population levels.
In the UK clinical governance is the framework within which healthcare organisations at every level of the National Health Service are “accountable for monitoring and improving the quality of services”. Clinical governance is intended to “safeguard high standards of care by creating an environment in which excellence in clinical care will flourish”.2 Others have compared clinical governance with other approaches to measuring and improving quality of care.3
PRIMARY CARE GROUP PERFORMANCE INDICATORS
In a previous paper we presented a method for identifying primary care interventions of proven efficacy and importance and suggested performance indicators that could be used to monitor their uptake.7 Our method estimates the impact of the optimal use of these interventions in terms of reduced mortality or non-fatal events in a primary care group population of 100 000, taking into account the local prevalence of conditions and uptake of these interventions. Whilst recognising the potential constraints in using our indicators,8–11 we suggested that these indicators could be one way of promoting the use of evidence-based interventions which would improve the quality of patient care and have a considerable impact on the health of the population.7 We have used our suggested indicators in this study (table 1).
Indicators tested and data sources
FEASIBILITY OF DERIVING INFORMATION TO COMPARE PERFORMANCE BETWEEN PRACTICES
In order to have comparable information, primary care group practitioners need to detect and accurately diagnose various diseases and to enter the correct Read codes (a comprehensive, hierarchically arranged thesaurus of terms used in health care) for these conditions into their computer systems. They will need to be able to monitor the use of effective interventions for patients with these diseases, and then be able to easily access this information electronically. Computerised records in highly selected practices are reasonably complete and accurate.12–14 However, there may be variations between practices in their level of computerisation, use of Read coding, ability to access meaningful data, and experience in auditing their own clinical practice. This is in spite of many requests and attempts to standardise data recording in primary care.15–17 No one has yet tested the feasibility of deriving information to produce indicators on which to assess standards from all the practices in a primary care group.
This study aimed to test the feasibility of deriving performance indicators in all 18 practices within a primary care group. Of the many dimensions to consider when testing feasibility we examined:
-
whether it was possible to derive these indicators in all the practices;
-
the problems and constraints incurred when collecting data;
-
the variations in indicator values between practices in both their identification of diseases and in the uptake of various interventions;
-
the possible reasons for these variations;
-
the cost of generating such indicators.
In another study we have evaluated the data credibility of our indicators and have determined whether they had stimulated change in each practice.18
Methods
THE PRIMARY CARE GROUP
The study was conducted in 18 practices comprising one primary care group in southern England (table 2). We chose the primary care group because, of those available locally, we believed that it was typical of many in English urban areas. The primary care group and all the practices agreed to be involved.
Characteristics of the 18 practices in one primary care group serving a patient population of 137 000
THE INDICATORS
We used the indicators presented in table 1 together with their data source. Full details of definition, numerator and denominator used, and data source for each indicator are available from the authors. In response to recent evidence on the importance of blood pressure control in people with diabetes,19 we added three indicators (indicators 12–14) to our previous list.7 We excluded the indicator on influenza vaccination as we started data collection before the 1998 vaccination programme and because very few of our practices recorded influenza vaccination on their computers.
DATA COLLECTION
AM and a field worker collected data from all the practice computers. They were assisted by at least one member from each practice who had a key role in computer data entry and extraction. Table 1 lists the data source for each indicator. Indicators 2, 4, 10, 11, 17–20, 23, and 24 were derived from random note review. Our random samples from each practice for note review included at least 25% of their patients with ischaemic heart disease (from indicator 1) and 50% of those with ischaemic stroke or transient ischaemic attacks (from indicator 3). In smaller practices we had sufficient time to review a greater proportion of such patients. This pragmatic approach gave us sufficient numbers to detect significant differences between practices using 95% confidence intervals and allowed us to collect most of the data in a 3–4 hour practice visit. All patients from each practice with ischaemic heart disease and ischaemic stroke or transient ischaemic attacks were included in sampling frames. We then used the random number generation function in Microsoft Excel 5.0 to determine our random sample. We reviewed 353 notes of the former patients in 18 practices (mean 19.6) and 101 notes of the latter patients in 10 practices (mean 10.1). AM and a field worker experienced in medical audit together reviewed notes using the practice computer to obtain additional information.
These indicators were derived for those aged 45–69 years (45–74 years in the indicators for heart failure and atrial fibrillation). We chose these age ranges because randomised controlled trial evidence applied to these ages and there were likely to be sufficient numbers in each group at a practice level. The data were analysed using Microsoft Excel 5.0 and SPSS for Windows 6.1.2. For direct standardisation we used the European standard population and replicated the methods of the Public Health Common Data Set.20
The feasibility of deriving these indicators was examined in all the practices and the problems and constraints incurred when collecting data were recorded. We examined and attempted to make sense of the variations in indicator values between practices in both their identification of diseases and in the uptake of various interventions. We anticipated that some variation would be expected in the identification of all the diseases reviewed because prevalence is higher in practices in more deprived areas.21 To examine whether there was an association between deprivation and identification rates we obtained the Townsend score for each practice from the local health authority. This score was readily available locally and practices were familiar with its use.
To estimate the total cost of generating and presenting the indicators back to each practice we recorded the time spent at each practice and other costs linked to the project. This included the time spent by the note reviewing research assistant and the lecturer in collecting data from practice computers, analysing the data from each practice, and selecting random patients for note search, reviewing practice notes, analysing data from note review, administration to coordinate these activities, and travel.
Results
ABILITY TO DERIVE INDICATORS
The number of indicators derived ranged from all 26 in three practices to only eight in two practices (median 12). Table 3 lists, for each indicator tested, the number of practices for which we were able to derive each indicator and the mean values. Seven of the 18 practices in our study had few Read code data on their computers. Indicators based on the uptake of effective interventions would become more meaningful when practices identify more of the relevant patients. For example, when trying to derive the proportion of the population with heart failure who have a prescription for ACE inhibitors, three of the 11 practices identified fewer than four patients. Five of the 10 practices that were able to identify those with non-valvular atrial fibrillation identified fewer than four patients.
Indicators tested, number of practices for which we were able to derive each indicator, and mean values
PROBLEMS AND CONSTRAINTS INCURRED WHEN COLLECTING DATA
The diversity of the different computer systems was a major obstacle to deriving these indicators. For example, we could not determine the proportion of the population who had had their blood pressure recorded in the previous five years using the VAMP Medical 6.0, VAMP Vision 2, or EMIS systems. We could not determine the proportion of the population who are current smokers and have received smoking cessation advice using VAMP Medical 6.0, VAMP Vision 2, EMIS, or the LK Global Clinical systems. In addition, we were unable to generate indicator numbers 8, 9, 10, 13, or 14 using the VAMP Medical 6.0 system.
VARIATION IN INDICATOR VALUES BETWEEN PRACTICES
There was a wide variation in indicator values between practices. Figure 1 highlights the variation between practices in the identification of ischaemic heart disease using Read codes and additional patients on nitrates. There was a sixfold variation in the identification rates between the practices with highest and lowest rates.

Identification of ischaemic heart disease (in those aged 45–69 years) using Read codes and additional patients on nitrates. Patients identified using Read codes who were also on repeat prescription nitrates were recorded only under “% using Read codes (on nitrates)”.
The box plots in fig 2 show the considerable variation between practices in the identification of ischaemic heart disease, ischaemic stroke and transient ischaemic attack, hypertension, diabetes mellitus, heart failure, and non-valvular atrial fibrillation. These box plots show the maximum and minimum values together with the median and first and third quartile values.

Variation between practices in the identification of diseases (directly age standardised rates as % by indicator number): 1 = ischaemic heart disease (n = 18 practices), median 4.3%, expected 6–7%; 3 = ischaemic stroke or transient ischaemic attacks (n = 10 practices), median 1.0%, expected 1%; 6 = hypertension (n = 14 practices), median 10.6%, expected up to 30% depending on how hypertension defined; 12 = diabetes mellitus (n = 17 practices), median 2.9%, expected 1–2%; 21 = heart failure (n = 11 practices), median 0.3%, expected 2–3%; 25 = non-valvular atrial fibrillation (n = 11 practices), median 0.7%, expected 2%.
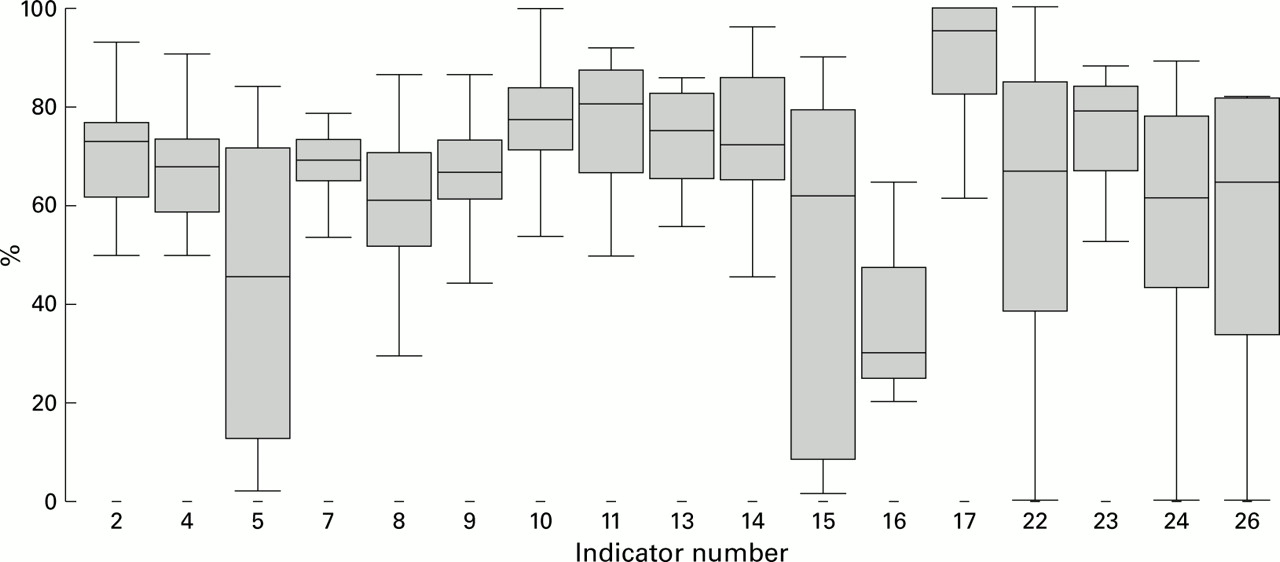
Figure 3 presents, again using box plots, the variation between practices in the percentage uptake of various interventions.

Variation between practices in the uptake of interventions (% by indicator number): 2 = % with ischaemic heart disease (IHD) who take aspirin (n = 18 practices); 4 = % with ischaemic stroke or transient ischaemic attacks (TIAs) who take aspirin (n = 10 practices); 5 = % who have had their BP recorded in the previous five years (n = 15 practices); 7 = % identified as hypertensive whose most recent systolic BP was <160 mm Hg (n = 12 practices); 8 = % identified as hypertensive whose most recent diastolic BP was <90 mm Hg (n = 12 practices); 9 = % identified as hypertensive who have had their BP recorded in the previous year (n = 12 practices); 10 = % with IHD who have had their BP recorded in the previous year (n = 18 practices); 11 = % with ischaemic stroke or TIA who have had their BP recorded in the previous year (n = 10 practices); 13 = % with diabetes mellitus whose most recent systolic BP was <160 mm Hg (n = 12 practices); 14 = % with diabetes mellitus whose most recent diastolic BP was <90 mm Hg (n = 12 practices); 15 = % who have their smoking status recorded (n = 17 practices); 16 = % who are current smokers and have received smoking cessation advice (n = 3 practices); 17 = % with IHD who have their smoking status recorded (n = 18 practices); 22 = % with heart failure who have a prescription for ACE inhibitors (n = 11 practices); 23 = % with IHD who have had a cholesterol measurement (n = 18 practices); 24 = % with IHD with a raised cholesterol who are prescribed lipid lowering drugs (n = 18 practices); 26 = % with a diagnosis of NVAF who have a prescription for anticoagulants or aspirin (n = 10 practices).
POSSIBLE REASONS FOR THESE VARIATIONS
Note review of randomly selected patients did highlight the problems of defining disease. For example, over 7% (26/353) of patients with a Read code for ischaemic heart disease had either “angina?” recorded in their notes without having had any subsequent diagnostic tests or had a negative exercise electrocardiogram. We recommend that practices enter a Read code for a disease when the diagnosis is likely rather than possible and that Read codes are reviewed and deleted if entered prematurely or in error. It is difficult to delete or change Read codes once entered in many systems. We were not able, using Read codes or practice notes, to differentiate ischaemic from haemorrhagic stroke in the majority of cases. Aspirin should not be prescribed to the latter.
There were also problems with defining thresholds for interventions. For example, in our indicator for the proportion of those with a diagnosis of ischaemic heart disease with a raised cholesterol level who are prescribed lipid lowering drugs we defined “raised” as a last total cholesterol of over 5.2 mmol/l. Some general practitioners considered this controversial.
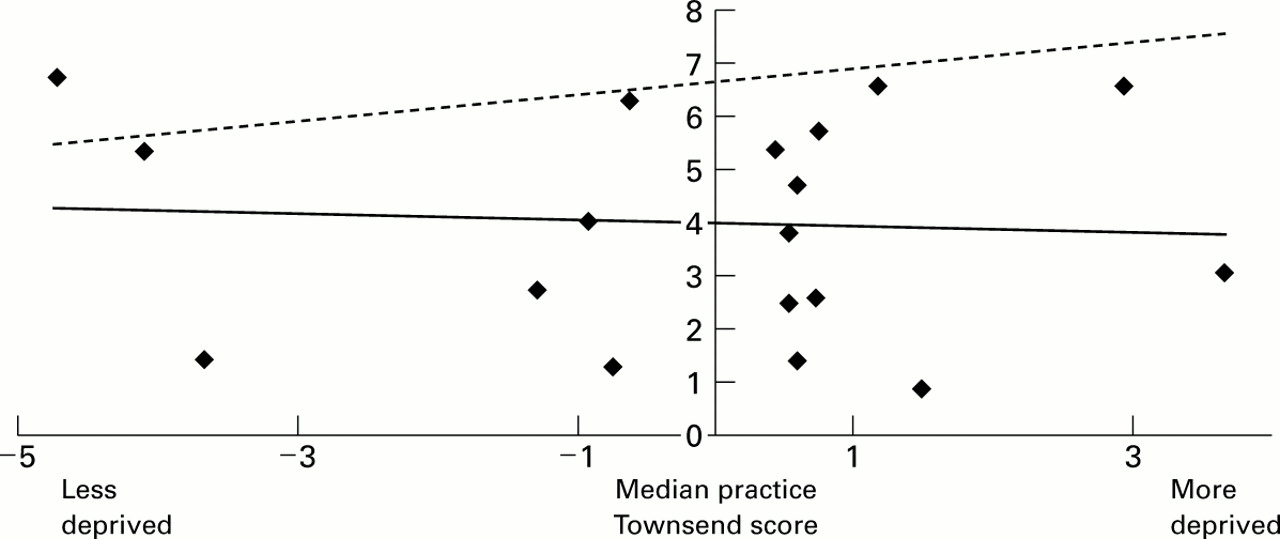
Figure 4 shows the variation in the identification of ischaemic heart disease by practice deprivation score. The linear regression line for our data is shown in black. We have estimated an expected linear regression line (broken line) assuming that mean UK values in this age group is 6–7% and that the rate of ischaemic heart disease is a third higher in more deprived than in less deprived populations. In our study variation in identification of ischaemic heart disease could not be explained by a higher prevalence in more deprived practices.

Scatter diagram of directly age standardised rates of identification of ischaemic heart disease (in those aged 45–69 years) by practice median Townsend deprivation score.
COST OF GENERATING INDICATORS
We estimate that the overall cost of generating our indicators was £5300 (table 4). This included the additional costs for piloting data collection and developing an audit form for the practice note reviews. Presenting the results to practices cost almost an additional £1000. This did not include the cost of the time to the practice staff, providing lunch for practice meetings, or postgraduate education approval. Three practices did not want a presentation and we posted their results to them instead.
Estimated cost of generating and presenting indicators (in pounds sterling)
Discussion
ABILITY TO DERIVE INDICATORS
It was possible to derive eight indicators in all practices and in three practices all 26 indicators. We believe that all our indicators are appropriate for primary care groups and all except indicators 18 and 20 (because of the small numbers involved) for individual practices. Because seven practices in our study had few Read code data on their computers, we had to review practice notes. We felt it was important to include these practices although we could only generate eight indicators in two such practices. Five of these had reasonable coding for their patients with diabetes because all the data had been entered by their practice nurses. Although we do not know about the level of computerisation within other primary care groups, we believe ours is typical of many in urban areas. The cost of improving the confidence and competence of key practice staff in using their computers could be considerable. Many practices preferred paper based systems for recording and audit.
There are other important criteria for formally evaluating performance indicators.22 We have previously shown that these suggested indicators reflect important primary care conditions and that they contributed to effective health care.7 They did identify opportunities for improvement and variation across practices. However, the reliability of the indicators and the extent to which they identify the population of interest need further evaluation in primary care groups.
PROBLEMS AND CONSTRAINTS INCURRED WHEN COLLECTING DATA
The different computer systems all had their own strengths and weaknesses but we were unable to derive indicators on some systems. Users of indicators will want to export the results of their searches onto spreadsheets to facilitate random note selection, standardisation, and analysis. We were not able to do this with the Microdoc or VAMP systems. Practice staff spoke to these two suppliers to confirm this.
When patients change their registration to another practice it is not even routinely possible to transfer their computerised records within the same computer system, yet alone to transfer from one system to a different system. At least five practices complained that they had lost patient data when changing computer system provider. In one practice we found over 100 patients who had a Read code for chronic rheumatic heart disease. The general practitioners blamed this on a faulty transfer of data.
We hope that, if the government uses performance indicators for primary care such as the ones we have proposed, software providers will quickly develop straightforward mechanisms for data capture and retrieval as happened following the introduction of health promotion banding. The practices in our primary care group varied greatly in their use of computers. Those with currently little information on their computer systems need to identify the nature and format of important clinical data and prioritise its entry. There was also variation within practices as to where in the computer system various patient specific data were recorded. For example, smoking cessation advice on some systems could be recorded on a variety of screens within each patient record, and on some systems it could not be Read coded and had to be entered in text format. It was not possible on many systems to list the repeat prescriptions of patients with certain Read coded diseases. There should be Read codes to distinguish between ischaemic and haemorrhagic stroke because aspirin should not be prescribed to the latter.
POSSIBLE REASONS FOR VARIATION IN INDICATOR VALUES
The variations between practices in the identification of disease and in the uptake of interventions can partially be explained by variation in computerised coding of diagnoses. However, there were considerable variations in patients with ischaemic heart disease identified using repeat prescriptions for nitrates whether or not they had a Read code. Using repeat prescription, nitrates were highly specific for ischaemic heart disease but the sensitivity varied between practices. We hope to explore this unexplained variation further.
Variation can be due to chance. When we presented comparative indicators back to each practice we used 95% confidence intervals, especially in those indicators based on small numbers.
Practice populations in some primary care groups may differ markedly in their age structures, and standardisation of indicators reflecting the prevalence of disease may be required. Direct standardisation of the rates of detection for diseases had little effect on the ranking of our practices. However, it did make a difference to the prevalence of ischaemic heart disease (indicator 1) where values changed by more than 10% in relative terms in four practices. There would be an even greater need for standardisation if national performance indicators had wider age groups than our indicators.
The prevalence of all the diseases we reviewed is higher in more deprived areas.21 However, we found no significant association between the median practice Townsend score and the identified prevalence in the diseases, even when excluding the data from the seven practices with few Read code data. The uptake of interventions was also not associated with deprivation. There were practices in deprived areas that had a high identification of diseases and also a high uptake of effective interventions (fig 4). We aim to determine how such practices are successful and pass on their lessons to the practices that cope less well. A review suggested that, for NHS interventions to reduce variations in health, they had to be precise and to focus intensively on their target group.23The Independent Inquiry into Inequalities in Health recommended that the national service frameworks should address inequities in access to effective primary care.24 A comparison of observed and expected practice rates for deprivation score could be as useful a mechanism for primary care groups as using clinical governance to improve quality of care, to validate indicators, and to target help to practices in more deprived areas with low rates of identified disease.
Note review also highlighted the potential difference between what is recorded and current behaviour. For example, we recorded patients with ischaemic heart disease as being on aspirin if the only evidence of this was from hospital letters several years old. We may therefore have overestimated the true rate. It may be both more accurate and cost effective to derive indicators such as aspirin use in those with ischaemic heart disease by asking such patients to complete a questionnaire. We need a method of identifying whether an intervention is contraindicated. For example, aspirin should not be prescribed to patients with ischaemic heart disease if they are allergic to it or have had previous gastrointestinal haemorrhage. Patients with ischaemic heart disease are also unlikely to take aspirin if they are taking warfarin, perstantin, or clopidogel. It is important to examine practice based indicators for the uptake of interventions for a particular disease, as well as the observed prevalence of that disease.
COST OF GENERATING INDICATORS
Costs will depend on how indicators are generated and whether those responsible for clinical governance within a primary care group decide to ask individual practices to generate their own indicators, employ individuals within a primary care group to collect such data, or purchase outside expertise. We would recommend that data collection across a primary care group is supervised by one individual rather than relying entirely on practices to calculate their own indicator values because of the difficulties in extracting data and in defining the numerators and denominators of indicators. The difficulties of coordination and communication with some practices should not be underestimated; for three practices we made over 30 telephone calls and sent numerous letters and faxes before we were able to collect and present their data to them.
The costs will be higher in primary care groups with a large number of small practices. Funding is already available for audit and half of the practices in our study had an “audit coordinator” whose salary was partly covered by an annual allowance from the local medical audit advisory group. The opportunity costs of random note searching may increase the incentives for practices to make enhanced use of their computers. Five of the practices had branch surgeries and this made random note review more onerous. We revisited surgeries to examine notes missing on the first visit. Excluding notes not available on the first visit would have underestimated the uptake for all practice interventions. As in hospital based note reviews, it is the patients being actively managed whose notes are likely to be missing from record storage.25 We did not include the cost of training someone to coordinate data collection.
Conclusions
There are other important primary care projects focusing on data collection17 but ours is the only example of which we are aware of an attempt to collect data in all practices in a primary care group. It was possible to derive our indicators in some but not all practices. Initial results suggest that these indicators meet many of the feasibility criteria but that there are problems in identifying diseases and in the reliability of the indicators. We believe that our experience is generalisable and anticipate that these indicators will be useful for primary care groups engaging in clinical governance. However, practices will need greater conformity and compatibility of computer systems, improved computer skills for their staff, and appropriate funding to derive indicators. Evidence-based indicators have the potential to turn evidence into everyday practice, to improve the quality of patient care, and to have an impact on the health of the population. This potential must be confirmed in future studies.
Acknowledgments
The authors thank Amyn Kadri for his advice and Ann Penfold and Lesley Dunn for their help with data gathering.