Article Text

Abstract
Background: The current awareness of the potential safety risks in healthcare environments has led to the development of largely reactive methods of systems analysis. Proactive methods are able to objectively detect structural shortcomings before mishaps and have been widely used in other high-risk industries.
Methods: The Leiden Operating Theatre and Intensive Care Safety (LOTICS) scale was developed and evaluated with respect to factor structure and reliability of the scales. The survey was administered to the staff of operating rooms at two university hospitals, and intensive care units (ICUs) of one university hospital and one teaching hospital. The response rate varied between 40–47%. Data of 330 questionnaires were analysed. Safety aspects between the different groups were compared.
Results: Factor analyses and tests for reliability resulted in nine subscales. To these scales another two were added making a total of 11. The reliability of the scales varied from 0.75 to 0.88. The results clearly showed differences between units (OR1, OR2, ICU1, ICU2) and staff.
Conclusion: The results seem to justify the conclusion that the LOTICS scale can be used in both the operating room and ICU to gain insight into the system failures, in a relatively quick and reliable manner. Furthermore the LOTICS scale can be used to compare organisations to each other, monitor changes in patient safety, as well as monitor the effectiveness of the changes made to improve the level of patient safety.
- ICU, intensive care unit
- LOTS study, Leiden Operating Theatre Safety study
- LOTICS scale, Leiden Operating Theatre and Intensive Care Safety scale
Statistics from Altmetric.com
- ICU, intensive care unit
- LOTS study, Leiden Operating Theatre Safety study
- LOTICS scale, Leiden Operating Theatre and Intensive Care Safety scale
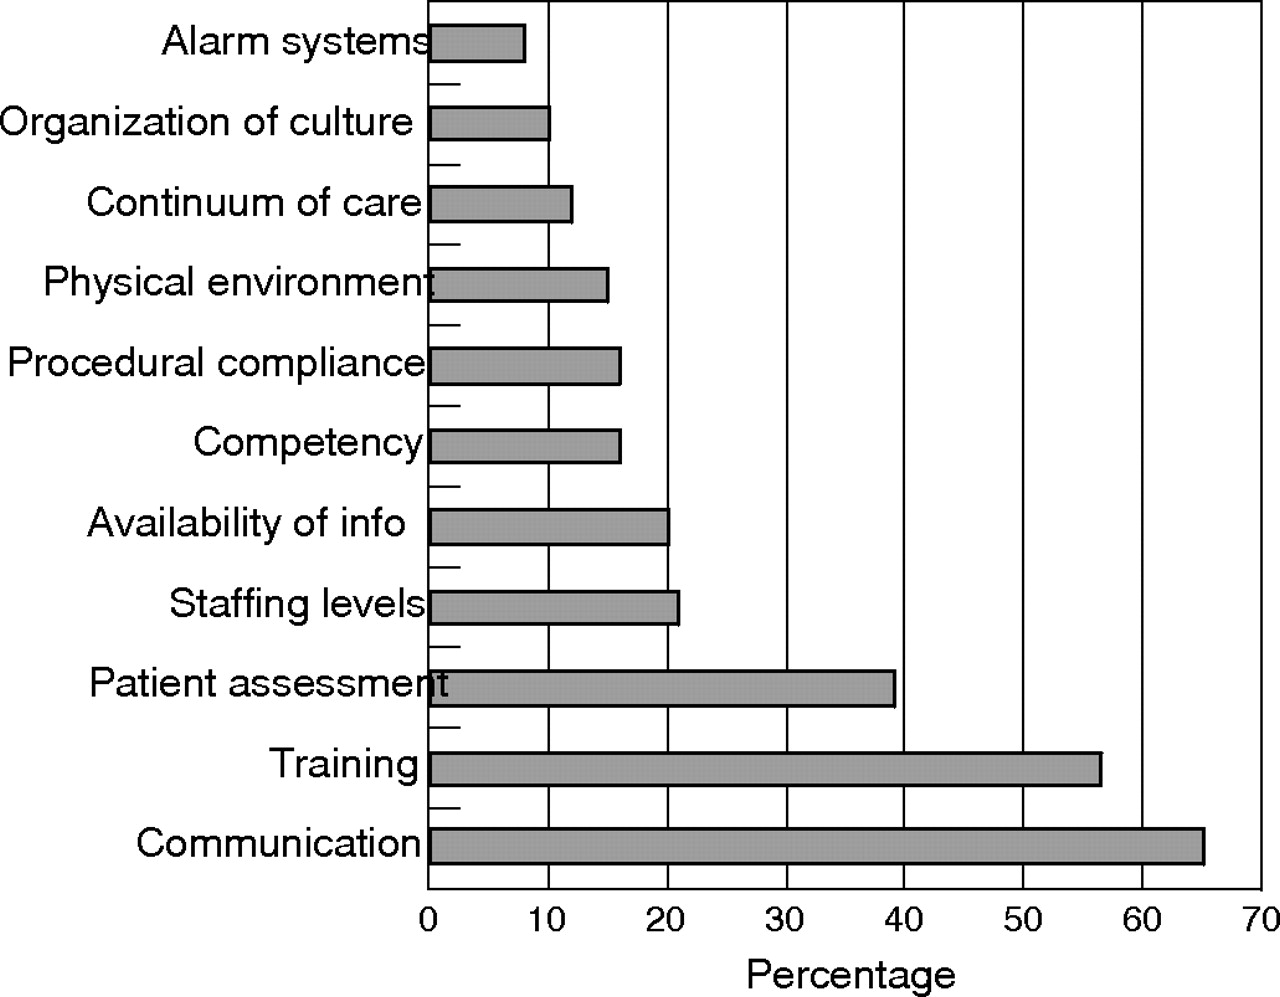
Since the publication of the Institute of Medicine report To err is human in 2000, improving patient safety has become a core issue for many modern healthcare institutes.1 According to this report and other studies conducted around the globe, approximately 10% of all patients admitted to hospital suffer some kind of harm, about half of which is preventable with current standards of treatment.2–6 The question arises of how systematic action can be taken to avert these preventable errors. For a long time a person-aimed analysis and prevention approach has been the dominant approach to improve patient safety in health care. In this approach the focus is directed at the ever-present “human factor”, being the individual responsible for making the error. Medical errors are considered the result of forgetfulness, inattention, lack of motivation and neglect.7–9 Despite the fact that accidents are to a significant extent caused by human failure, approaches directed to human shortcomings seldom solve the problem.10,11 There is widespread evidence from research in several domains that indicates that individual errors are often the result of structural system failures.12 This implies that incident investigations should not be limited to the description of unsafe acts and/or situations that preceded the accidents, the active failures. Instead, investigations should particularly be directed to the identification of the system factors that contributed to the adverse event—the latent failures—which are frequently the result of management decisions.13,14 Several studies have shown that latent failures can be grouped into a limited number of classes. Analysis of major disasters, shipping accidents, accidents in the exploration and oil production, railway operations and aircraft engineering showed 11 classes of so-called General Failure Types.8,14 In a study conducted by the Joint Commission on Accreditation of Healthcare Organizations (JCAHO; http://www.jcaho.com) into the root cause analyses of 2500 incidents, 10 classes of underlying causes were discerned (fig 1).

Most importance root causes of 2500 incidents reported to the Joint Commission on Accreditation of Healthcare Organizations (JCAHO) (reprinted with permission from JCAHO, 2004).21
In recent years health care has increasingly accepted a systems approach for the analysis of incidents and identification of the latent and environmental conditions that lead to adverse events.7,15–17 The translation of this approach in the medical world evolved largely to reactive methods and, in only a handful of cases, to more proactive methods.18,19 In safety-critical domains other than health care, techniques have been developed that objectively detect structural shortcomings before they can lead to incidents and that can be used to assess and monitor the safety situation within an organisation.20 In this study we aim to develop a comprehensive survey instrument that measures system factors contributing to adverse events (latent risk factors) in the operating theatre and intensive care unit and which identifies specific areas of concern by comparing staff reactions on system factors across units and medical disciplines. The development of the instrument is part of the Leiden Operating Theatre Safety (LOTS) study. The LOTS study aims to improve the quality of patient safety by identifying system failures and facilitating the development and evaluation of corrective actions to reduce the risk of future errors. The present article reports details of the development and the psychometric properties of the Leiden Operating Theatre and Intensive Care Safety (LOTICS) scale. In addition to the psychometric aspects of the LOTICS scale its validity was studied in more detail by including work-related safety goals as a criterion measure. It was expected that subgroups with significantly lower than average scores on latent risk factors (LRFs) would report more safety goals in the areas related to the LRFs on which they were less favourable than on LRFs for which their scores were equal to or above the average score. Further it was expected that subgroups with lower than average scores on LRFs would mention more safety goals than subgroups with equal to or higher than average scores on LRFs. We also investigated the relation between LRFs, safety culture and perceived error rate. After all, in a reporting and learning culture, system weaknesses should “decrease” over time as corrective actions are implemented.8 In a similar vein, a more positive safety culture and fewer system weaknesses should eventually result in a reduction in error rates. Unfortunately, errors in health care are strongly underreported.1,22 Moreover, the tendency to underreport errors has been found to be inversely related to safety culture.23 Given these findings we expected significant correlations between LRFs and safety culture, but no significant correlation for LRFs and safety culture with perceived error rate.
METHODS
Study sample
Staff from two university hospitals and one teaching hospital in the Netherlands participated in the study. In one of the university hospitals both the operating room centre and the intensive care unit (ICU) participated. In the other university hospital only the operating room participated, and in the teaching hospital only the ICU. All nurses and medical specialists, both staff and trainees, who had been in their job three months or more were approached and invited to participate in the study. Of the 782 who met this criterion (485 from the operating theatre and 297 from the ICU) 344 completed the inventory. Of the 344 returned survey forms 330 (42%) were suitable for further analysis (40% in operating theatres, 47% in ICUs). The demographic data, working hours and working experience are given in table 1.
Demographics
Survey instrument
The questionnaire comprises four parts (99 items) and has an additional demographic section where respondents fill in their department or ward, job position, contracted hours per week, job tenure, age group and gender.
I. Latent risk factors
A multidisciplinary team consisting of four employees from the operating theatre, ICU and management, two anaesthesiologists and two surgeons was asked to make an inventory of possible process failures in the operating theatre and the ICU. The inventory was reviewed by the 10-member multidisciplinary supervising board of the LOTS study, to ascertain the completeness of the inventory. A total of 50 potential process failures were identified. Next, the members of the supervising board were interviewed to identify possible underlying causes and effects of these failures. Finally, the investigators categorised the underlying causes, defining 10 item categories: Staffing Resources, Communication, Planning and Coordination, Training, Procedures, Design, Material Resources, Maintenance, Teamwork and Situation Awareness. Two of these item categories were measured with scales of the Leiden Quality of Work Scale (LQWS) for Hospitals:24 Staffing Resources (6 items) and Material Resources (5 items). Table 2 shows the items with the LQWS factor loadings and Cronbach alpha. Responses were given on a four-point Likert-type scale as follows: 1 (totally disagree), 2 (disagree), 3 (agree) to 4 (totally agree), with higher scores indicating more resources. To measure the other eight item categories a pool of 90 items was developed, and reviewed by the supervising board on phrasing (readability and applicability) and validity (completeness and relevance). Some items were deleted leaving a total pool of 74 items. Respondents indicated their agreement with each item on the four-point scale.
Factor structure, factor loadings and internal reliability (Cronbach’s alpha) of the LOTICS scale
II. Safety culture
In this study safety culture was defined as the willingness to report, analyse and learn from errors and adverse events, which Reason called a “reporting and learning safety culture”.8 Safety culture was measured with nine items based on a checklist to evaluate interventions to strengthen a culture of safety25 (for example, “After an incident not much is done”; α = 0.77). Responses were given on a four-point Likert-type scale ranging from 1 (totally disagree) to 4 (totally agree).
III. Perceived rate of errors
The third section asked respondents to report how often errors, near-misses and incidents occurred in their departments. The three items were scored on a six-point scale ranging from 1 (never) to 6 (very frequently).
IV. Safety goals
The fourth section asked respondents to report in free text the three most important work goals they wanted to attain in the coming year to improve patient safety in the operating room/ICU.
Data analysis
The data were analysed using the statistical software package SPSS version 10. Exploratory factor analyses were conducted to assess the underlying factor structure of the 74-item questionnaire. The scale reliability was assessed by Cronbach’s alpha. Bivariate correlations were calculated to examine the pattern of direct relationships between the LRFs, safety culture and perceived rate of errors. To examine the discriminative value of the LOTICS scale, differences in LRFs across different operational units and different medical disciplines were evaluated using one-way analyses of variance (ANOVAs) for each of the LRFs, followed by planned linear comparisons. To facilitate the analyses the study sample was divided according to operational unit: operating theatre (OR1 and OR2) and intensive care unit (ICU1 and ICU2), and by medical discipline: theatre nurses, anaesthesia nurses, operatin room trainees, operating room recovery nurses, physicians, and intensive care nurses. To examine the relation between staff’s reported number and type of safety goals and perceptions on the latent risk factors, the subgroups by medical discipline were further divided to operational unit. Finally, subgroup means and overall means on each of the 11 LRFs were calculated. Subgroup means were then compared to the overall mean using Student’s t test to define those subgroups answering favourable/unfavourable on LRFs.
RESULTS
Psychometric characteristics of the LOTICS scale
An exploratory factor analysis was conducted on the 74 latent risk items using principal components extraction with varimax rotation and the scree-test criterion.26 The analysis revealed a solution with nine factors explaining 48% of the total variance. Using as criterion a cut off point of 0.40 for item loadings in the rotated factor loading matrix and interpretability of the scales, 47 items loaded unambiguously and meaningfully on one of the nine factors and with reasonable congruence with a priori content areas. The nine factors were labeled: Task-related Communication, Teamwork, Team Instruction, Training, Procedures, Situation Awareness, Planning and Coordination, Maintenance and Design. To increase the internal reliability of four scales seven items were excluded, leaving 40 items to measure the nine components. The final subscale internal consistencies are moderate to high (Cronbach α varied between 0.75–0.88). Table 2 shows the items with their factor loadings and the Cronbach value for each of the LOTICS subscales.
Correlations
Table 3 provides the correlations among all variables. Correlations between the LOTICS subscales and safety culture were all significant and positive with highest correlations found between safety culture and Training (0.40) and safety culture and Planning and Coordination (0.43). Correlations between the LOTICS subscales and perceived error rate were generally not significant. Safety culture and perceived error rate correlated statistically significantly, but correlations were weak (0.21).
Intercorrelations between the LOTICS subscales, safety culture and perceived rate of errors
Discriminative value
Operational units
According to one-way ANOVA, eight of the 11 LOTICS dimensions discriminated significantly between different operational units (table 4). For two scales the differences between the operational units approached significance (Situation Awareness, p = 0.062, Procedures, p = 0.054). Compared with OR1, OR2 and ICU2, ICU1 reported significant more problems for Material Resources (mean difference ICU1 v OR1 0.20, 95% CI 0.04 to 0.35, mean difference ICU1 v OR2 0.17, 95% CI 0.01 to 0.34, mean difference ICU1 v ICU2 0.59, 95% CI 0.41 to 0.77), and for Maintenance (mean difference ICU1 v OR1 0.07, 95% CI 0.00 to 0.13, mean difference ICU1 v OR2 0.11, 95% CI 0.04 to 0.17, mean difference ICU1 v ICU2 0.18, 95% CI 0.11 to 0.26). ICU1 also reported more problems for Design than did OR1 and ICU2 (mean difference ICU1 v OR1 0.15, 95% CI 0.01 to 0.30, mean difference ICU1 v ICU2 0.34, 95% CI 0.17 to 0.50). Compared with the ICUs, the operating theatres encountered more problems with Teamwork (mean difference OR1 v ICU1 0.15, 95% CI 0.03 to 0.28, mean difference OR1 v ICU2 0.18, 95% IC 0.01 to 0.33, mean difference OR2 v ICU1 0.14, 95% CI 0.01 to 0.28, mean difference OR2 v ICU2 0.18, 95% CI 0.03 to 0.33). Operating theatre staff also had more problems with Training (TR) and Communication (CO) than ICU staff, with OR1 reporting more problems than ICU1 and ICU2 (TR: mean difference OR1 v ICU1 0.24, 95% CI 0.09 to 0.40, mean difference OR1 v ICU2 0.38, 95% CI 0.20 to 0.55, and CO: mean difference OR1 v ICU1 0.34, 95% CI 0.19 to 0.49, mean difference OR1 v ICU2 0.54, 95% CI 0.38 to 0.71), and with OR2 reporting more problems than ICU2 (TR: mean difference OR2 v ICU1 0.10, 95% CI 0.07 to 0.27, mean difference OR2 v ICU2 0.23, 95% CI 0.05 to 0.42, and CO: mean difference OR2 v ICU1 0.16, 95% CI 0.00 to 0.33, mean difference OR2 v ICU2 0.37, 95% CI 0.19 to 0.55).
ANOVA mean LOTICS subscale scores for each of the operational units, with standard deviations and degrees of freedom in parenthesis: OR1, OR2, ICU1 and ICU2
Medical discipline
One-way ANOVA showed that all LOTICS dimensions, except for Procedures, discriminated significantly between staff in different job positions (table 5).
ANOVA mean LOTICS subscale scores for each of the medical disciplines, with standard deviations and degree of freedom in parenthesis
Anaesthesia nurses reported more problems for LRFs than the other medical disciplines, while physicians and intensive care nurses reported fewer problems for LRFs. Inspection of the data for unit differences showed, however, that it was foremost anaesthesia nurses in OR1 and intensive care nurses in ICU2 who accounted for the significant findings.
Criterion validity
The participants mentioned a total of 545 work goals to improve patient safety on their respective departments. Two people (one research staff member and one member of the supervisory board of the LOTS study) categorised the goals according to one of the 11 LOTICS subscales it referred to. The categorisation found 412 goals related to the LOTICS subscales. Safety goals that did not concern LRFs were categorised as “safety culture” (41), “hygiene” (10), “work space” (27), “work climate” (19) and “miscellaneous” (36).
On average 10.1 safety goals were reported for LRFs, with unfavourable scores against 3.2 goals for LRFs with favourable scores. A relatively large part of the reported safety goals (30%) were concerned with the factors communication and training, even if the factors’ scores did not lag behind the average.
On average the subgroups which were less favourable on LRFs—anaesthesia nurses in OR1 and nurses in ICU1—mentioned more safety goals than the other subgroups (2.32 v 1.58 (p<0.01) and 1.98 v 1.51 (p<0.01), respectively). Most safety goals were mentioned in the areas related to the LRFs on which they were less favourable. On average the nurses in ICU2 reported more favourably on LRFs and on average mentioned fewer safety goals than the other subgroups (0.98 v 1.72 (p<0.001)). These nurses, however, had a lower score on Situation Awareness and mentioned more often safety goals that relate to this aspect than on average (13% v 3%). Although nurses in ICU2 reported more favourably on Safety Culture than most other medical disciplines they reported less favourably on perceived rate of errors.
DISCUSSION
If system-directed methods are used in health care to monitor and improve patient safety generally reactive methods are used.27 Several factors influence the adequacy of these methods to identify the sensibility of the system to errors and the underlying causes of incidents. The most important factor is the level of reporting of incidents and errors. In healthcare underreporting of incidents and errors is a common phenomenon. A second factor is that most incident analyses describe only “who” was involved and “what” occurred with limited attention paid to the underlying latent failures. Even if errors and incidents are reduced to system factors, the identified failures that have led to that specific incident are not necessarily indications of weaknesses in the organisation as a whole, restricting lessons to be learned about the prevention of future similar occurrences.14,28 Consequently, a large number of incidents has to be analysed, as in the JCAHO study, to get a reliable impression of the organisation’s system weaknesses. Finally, the lack of standardised reporting and analysis precludes sharing data for benchmarking.
Given the limitations of the reactive approach the current study aims to identify system failures in the operating room and ICU, irrespective of the errors and incidents that occur by using the purposely-developed instrument, the LOTICS scale. The LOTICS scale seems to be a reliable and valid diagnostic tool with the ability to identify system failures and to differentiate between units and medical disciplines. The items are representative of the construct to be measured and they address various parts of the construct. The groups which report less favourably on LRFs mention more safety goals than groups with favourable scores and the reported goals particularly involve LRFs with unfavourable scores. Apparently absolute values matters more than relative scores, since even for those scales with only average scores (Communication and Training) the respondents suggested safety goals. Similarly, JCAHO observed that in the incident analyses of 2500 incidents over the last 10 years Communication and Training were mentioned as (additional) causes in the incidents (fig 1). Problems with communication played a role in 65% of the incidents, while training deficiencies were mentioned in 56% of cases.18,29–33 The significance of the other LRFs in our study—Staffing Resources,34 Procedures,31,35 Situation Awareness,36,37 Teamwork,15,19,31,34,38 Team Instructions,19 Design and Maintenance of equipment,18,19,39,40 Planning and Coordination13,39—was also observed in other studies.
Correlations between the LOTICS subscales and safety culture were generally moderate and in the expected direction, indicating that individuals reporting fewer problems with LRFs scored higher on safety culture. Correlations with the perceived rate of errors were generally not significant. The correlation between safety culture and perceived rate of errors was significant but also very weak. These findings are in line with the results of another study indicating that if systemic factors and safety culture are rated favourably the probability of incidents is low but the willingness to report incidents (and the ability to recognise near-misses and incidents) is high.23 Reversely, in organisations in which the scores on safety culture and systemic factors are more negative, more incidents occur, but the willingness to report these incidents is lower. The fact that organisations with more positive scores on safety culture are more prepared to report errors and (near) incidents may explain why the group “nurses in ICU2” with the most favourable LRFs has a higher perceived rate of errors than the other groups.
There are limitations to our study. The response rate varied between 40–47% and thus we may have introduced a response bias. However, there were no differences between responders and the total population on sex, age and function. This suggested that the overall results would probably not be affected by non-response bias. The results of the data set support the construct validity of the LOTICS, which needs to be confirmed in replications of this research and comparison with other measures. Further work is also necessary to examine the test-retest reliability of the LOTICS and its predictive validity.
In conclusion, we believe that the LOTICS scale can be used in both the operating room and ICU to gain insight into the system failures, in a relatively quick and reliable manner. Furthermore the LOTICS scale can be used to compare organisations with each other, monitor changes in patient safety, as well as monitor the effectiveness of the changes made to improve the level of patient safety.
Acknowledgments
The authors thank Professor H Kerkkamp, Professor of Perioperative Care and H Langeweg, location manager of the day care centre, University Medical Centre Utrecht, H van Dis, medical psychologist, C J Schuijt-Nederlof, charge nurse ICU, OLVG, Amsterdam, AAM Keijzer, charge nurse and manager ICU, Leiden University Medical Centre, Leiden and the employees of the centres for their cooperation in the study.
REFERENCES
Linked Articles
- Quality Lines