Article Text

Abstract
Background—Reporting systems in anaesthesia have generally focused on critical events (including death) to trigger investigations of latent and active errors. The decrease in the rate of these critical events calls for a broader definition of significant anaesthetic events, such as hypotension and bradycardia, to monitor anaesthetic care. The association between merely undesirable events and critical events has not been established and needs to be investigated by voluntary reporting systems.
Objectives—To establish whether undesirable anaesthetic events are correlated with critical events in anaesthetic voluntary reporting systems.
Methods—As part of a quality improvement project, a systematic reporting system was implemented for monitoring 32 events during elective surgery in our hospital in 1996. The events were classified according to severity (critical/undesirable) and nature (process/outcome) and control charts and logistic regression were used to analyse the data.
Results—During a period of 30 months 22% of the 6439 procedures were associated with anaesthetic events, 15% of which were critical and 31% process related. A strong association was found between critical outcome events and critical process events (OR 11.5 (95% confidence interval (CI) 4.4 to 27.8)), undesirable outcome events (OR 4.8 (95% CI 2.0 to 11.8)), and undesirable process events (OR 4.8 (95% CI 1.3 to 13.4)). For other classes of events, risk factors were related to the course of anaesthesia (duration, occurrence of other events) and included factors determined during the pre-anaesthetic visit (risk of haemorrhage, difficult intubation or allergic reaction).
Conclusion—Undesirable events are associated with more severe events and with pre-anaesthetic risk factors. The way in which information on significant events can be used is discussed, including better use of preoperative information, reduction in the collection of redundant information, and more structured reporting.
(Quality in Health Care 2000;9:203–209)
- reporting system
- correlation analysis
- quality assessment
- adverse events
- anaesthesia
Statistics from Altmetric.com
Systematic and structured efforts to improve the quality of anaesthetic care, based on examination of the circumstances surrounding undesired events, have a long history. In 1984 the use of reporting by practitioners of untoward events was popularised in the study of “mishaps”' and “near mishaps”1 and it has been widely adopted since then.2–5 In such systems very serious adverse outcomes—including cardiac arrest, respiratory arrest, myocardial infarction, and death—are used to trigger detailed investigations of anaesthetic procedures to identify active and latent errors,6 and thus enable appropriate corrective action to be taken. The incidence of such events has also been used as an indicator of the quality of anaesthetic care.7
Today, anaesthesia is measurably safer, and very serious events are becoming rarer in the population. In western countries the mortality rate for anaesthesia is approximately one in 20 000 procedures in the general population8 and in healthy young subjects it is much lower—for example, during caesarean section it is only 1.7 per million.9 The incidence of cardiac arrest during anaesthesia ranges from 0.4 to 2.6 per 1000 anaesthetic procedures.2 Thus, the practical value of using such infrequent critical events as a tool for triggering investigation of active and latent system errors in single institutions is limited. Significant changes would take an unacceptably long time to demonstrate, making rapid detection and response impossible.10 Indeed, assuming a rate of one cardiac arrest per 2000 procedures and one death per 20 000 procedures, in an institution where 20 000 anaesthetic procedures are performed each year it would take four years and 80 years, respectively, to prove that the rates were halved, and two months and two years, respectively, to react to a doubling of these rates.
A practical approach to measuring the performance of anaesthetic care and to triggering the investigation of possible systematic errors would be to define a broader range of relevant events to include those that are less serious but occur more frequently. There are many outcome and process events that might be relevant—for example, hypotension, bradycardia, or transfer to the ICU. No controlled study has so far been undertaken to ascertain the relationship between such events and the quality of anaesthetic care, nor has the correlation between events of low severity and those of higher severity been assessed. It has been difficult to establish the relationship between the less serious but more frequent events and very serious events because, although in a voluntary reporting system of untoward events the serious events tend to be adequately declared, those considered less serious are significantly underreported.11
A project supported by ANDEM (former French National Agency for Evaluation in Medicine) was set up in our department to develop standardised approaches for preoperative patient assessment and assessment of anaesthetic procedures, and to monitor the performance of anaesthetics using a voluntary reporting system of significant events occurring during the anaesthetic procedure. We used this opportunity also to ascertain the relationship between the more frequent but less serious anaesthetic events and the more serious but less frequent ones, as reported in the voluntary reporting system, and to assess whether these less serious events are useful triggers for further investigations. The way in which the information on significant events can be used and methods for increasing the informative value of reported events are discussed.
Methods
SIGNIFICANT ANAESTHETIC EVENTS
Thirty two types of significant anaesthetic events (SAEs) occurring during anaesthesia and while in the recovery room were defined and monitored (table 1). These events were chosen as critical points identified in our analysis of the anaesthetic process, were related to continuously monitored vital signs, or were present in previously described reporting systems. We distinguished between critical anaesthetic events (CAEs) and merely undesirable anaesthetic events (UAEs). Ten types of events were considered serious enough to be critical, and the other 22 were undesirable. This classification conveyed an implicit chronological ordering of the SAEs, critical events being expected later in the anaesthetic process than undesirable events.
Frequencies of the 2012 significant anaesthetic events (SAEs) reported during 6439 anaesthetic procedures. SAEs are listed by severity (critical/undesirable) and nature (process/outcome)
The SAEs were also classified as “process” or “outcome”. “Process” events represented a departure from the normal course of the anaesthetic procedure—for example, all unplanned actions taken by the staff during and after a procedure such as a blood transfusion or transfer to the ICU, and all unexpected results from a technical procedure such as a difficult intubation, failure to intubate, or failure of local anaesthesia. All events that corresponded to changes in the state or vital signs of the patient were termed “outcome events”. Twenty one events were classified as outcome, and 11 as process.
MANAGEMENT OF THE PROJECT AND DATA COLLECTION
In 1996, after development of a reporting sheet for SAEs as part of the larger ANDEM study and its approval by all members of the department, a voluntary reporting system for all SAEs was started for all elective surgical procedures. Six adjoining operating theatre rooms were included in the study where, on average, 70 anaesthetic procedures were performed every week. Eight anaesthetists (full or part time), assisted by five nurse anaesthetists, were in charge of monitoring the patients in the operating rooms. Two recovery room nurses monitored the patients in the recovery room. An individual sheet was started for every patient on entry to the operating theatre and was completed by the anaesthetist or by the nurse anaesthetist under the supervision of the anaesthetist. Administrative and pre-anaesthetic data were taken from the medical record and SAEs occurring at any stage (induction of anaesthesia, intraoperatively, or postoperatively) were recorded by ticking relevant boxes on the patient form until the patient left the recovery room. Each day the recovery room nurses entered the completed forms into a computerised database. Statistics were produced monthly and included use of the operating theatres, type of anaesthetic procedures performed and their duration, frequency charts for SAEs, and a control chart for their monthly frequency. These were made public to the department and were discussed monthly in staff meetings but also informally among the staff.
Starting in 1996, several multiprofessional working groups comprising 2–5 people (anaesthetists, nurse anaesthetists, nurses, surgeons, methodologists) were also set up to address the other specific issues of the project—for example, the development of tools for preoperative assessment, the scheduling of procedures, the design and maintenance of emergency carts, and the improvement of communication between anaesthetists and surgeons.
TRENDS IN REPORTED SIGNIFICANT ANAESTHETIC EVENTS
The fluctuations in the monthly average number of SAEs per procedure were estimated from a control graph12 automatically generated from the data recorded in the database using software developed by one of us. In this approach it is assumed that the number of SAEs varies from month to month around a fixed theoretical mean with variance depending on the natural variability of monthly measurements and on the number of procedures in the month. The “theoretical” mean and variance were not known for the SAEs. As is usual with control charts, these quantities were estimated from the first 18 months of reporting (August 1996 to December 1997) after verifying that no seasonal variation was present in the incidence of SAEs. Control limits were defined so that the value of a given month may fall outside by chance in 1‰ of the cases.
STATISTICAL ANALYSIS
For a given SAE, risk factors may include the duration of the procedure, the type of surgery and anaesthesia, as well as potential risks identified during the pre-anaesthetic visit such as difficulty of intubation. Furthermore, SAEs recorded earlier or during the same stage of anaesthesia for the same patient may also influence the occurrence of other SAEs. Conditional asymmetrical modelling13 enables logistic regression to be performed while including the known occurrence of some SAEs as independent variables, together with patient and procedure characteristics, when analysing the probability of a given SAE.
We classified the risk factors for SAEs according to their severity and nature. CAEs were not included as dependent variables in the analysis of UAEs, to respect the implicit ordering of the events. For example, to model the risk of an outcome UAE we included the occurrence of process UAEs as well as duration of the procedure and characteristics of the patient identified during the pre-anaesthetic visit, but not the occurrence of CAEs. In each class of SAE we investigated an event in greater detail to determine the association with other SAEs, as well as with patient and procedure characteristics. All analyses were standardised for the type of surgery and method of anaesthesia. A univariate analysis was performed for each independent variable and only those showing an association (p<0.20) were retained and included in the multivariate regression. The final model was built using backward selection at the p = 0.05 level.
Results
Over a 30 month period from August 1996 to December 1998 6439 anaesthetic procedures were included in the database, corresponding to all elective surgical procedures and 97% of all procedures. These comprised 2157 ENT procedures (33.5%), 2891 urological procedures (44.9%), and 1391 vascular surgery procedures (21.6%). General anaesthesia was used in 5106 cases (79.3%), regional anaesthesia in 1211 (18.8%), a combined technique in 63 (1.0%), and simple sedation in 45 (0.7%). Fourteen procedures (0.3%) were cancelled before induction of anaesthesia. Upper airways management used orotracheal intubation (79.3%) and other methods of intubation including fibreoptic (2.5%), laryngeal mask (12.2%), facial mask (4.2%), and tracheotomy (1.8%). Intubation was performed in 4222 patients of whom 352 (8.3%) were considered to be difficult to intubate. Non-orotracheal intubation techniques, including fibreoptic intubation, were used in 52 (14.7%) of these patients but in significantly fewer patients at low risk of difficult intubation (1.7%, p<0.001). The median (range) duration of the interventions was 90 minutes (5–790) for ENT operations, 95 minutes (5–750) for urological operation, and 130 minutes (15–790) for vascular procedures.
SIGNIFICANT ANAESTHETIC EVENTS
A total of 2012 SAEs were reported in 1433 patients (table 1). Of these, 1034 (72.1%) had one SAE, 281 (19.7%) had two, and 118 (8.3%) had three or more. These were mostly of low severity and were classified as “outcome” rather than “process”. Only 247 (12.2%) were considered to be critical and process events accounted for 546 (27.1%) of the total. The five most frequent SAEs were hypotension (n=723, 35.9%), bradycardia (n=320, 15.9%), nausea/vomiting (n=146, 7.2%), delayed discharge from recovery room (n=120, 6.0%), and difficult laryngoscopy (n=89, 4.4%).
TREND IN REPORTED SAES
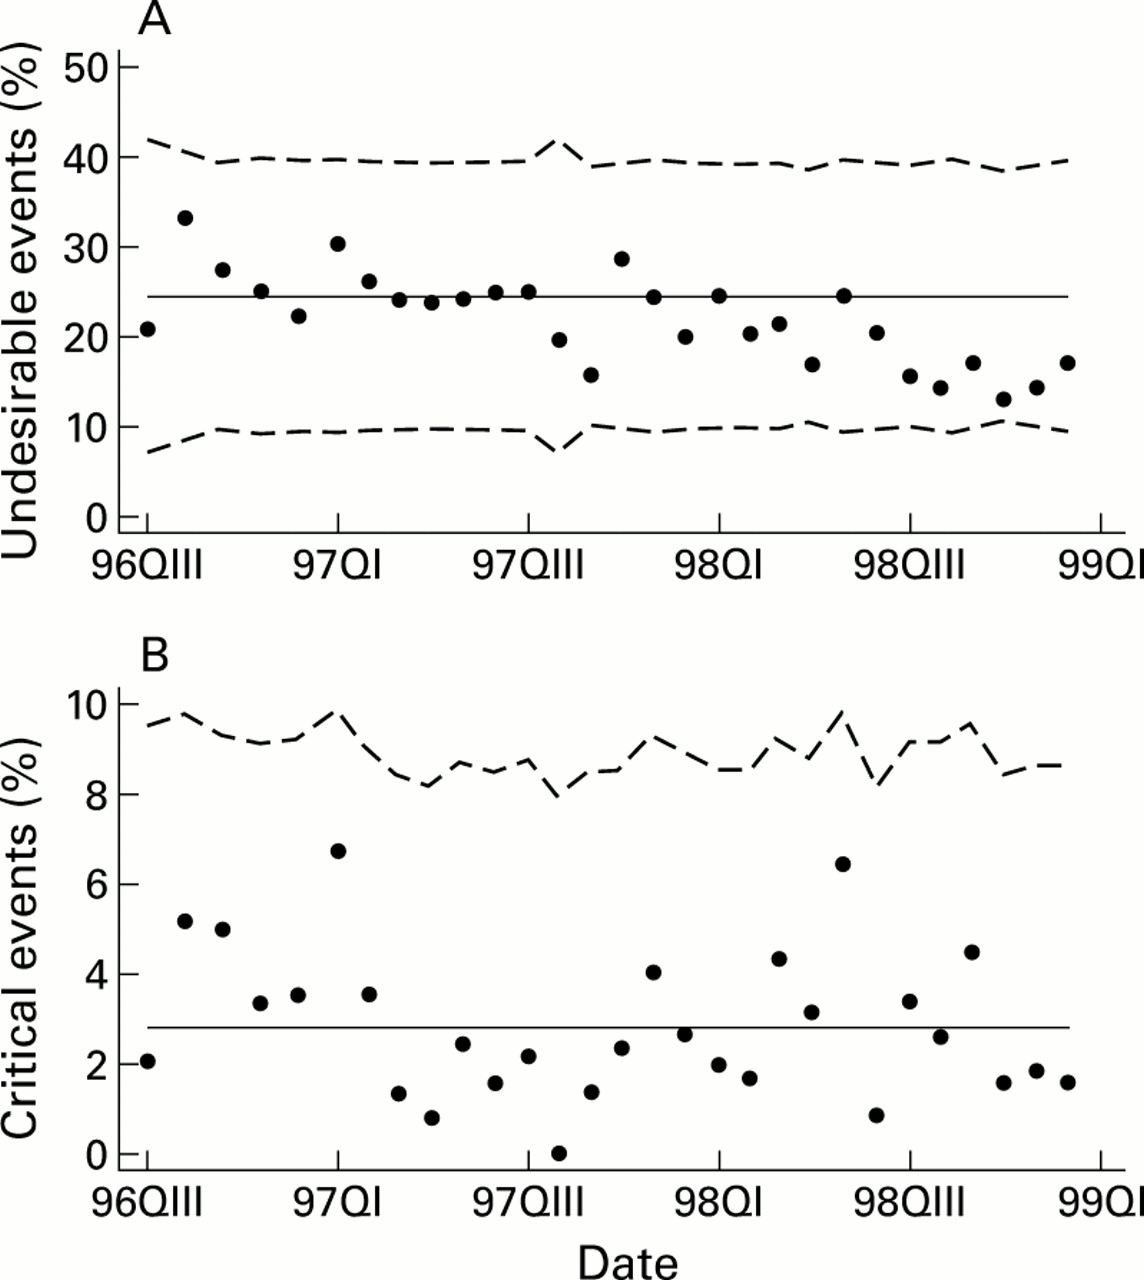
Figure 1 displays the control chart for the incidence of SAEs according to their severity. The rate of CAEs appears to have been stable during the period of the study, occurring in approximately 3% of the procedures. The rate of UAEs fluctuated around 24% of the procedures in the first 18 months of the study, but decreased during 1998. A more detailed analysis showed that this decreasing trend was caused by a significant reduction in the frequency of nausea/vomiting and cutaneous rashes during these months.

Control chart for the incidence of (A) undesirable and (B) critical significant anaesthetic events (SAEs). The mean monthly percentage of procedures with at least one SAE is plotted against time (•). In a stable situation all points are expected to fit around the “theoretical” average incidence (solid line) and within control limits (dashed lines) constructed after the natural variability of the monthly percentages so that there is only a very small probability (∼1‰) of falling outside by chance. Because it is very unlikely in a normal situation, a point outside the control limits is used to trigger investigation for a specific cause, eventually leading to intervention or correction in the anaesthetic process to regain stability. “Theoretical” values were obtained by averaging the values in the period from 96QIII to 98QI.
The proportion of procedures with at least one SAE did not exhibit a seasonal pattern, even if the number of procedures was reduced during summer months. Using the average number of SAEs by procedure to construct the control chart, very similar control graphs were produced with a fluctuation of about 0.3 SAE per procedure. Thus, in addition to the stability of the overall incidence, the number of reported events per procedure was also stable.
RISK FACTORS OF SIGNIFICANT ANAESTHETIC EVENTS
Table 2 shows the results of the multivariate logistic models for the four classes of SAEs.
Risk factors for significant anaesthetic events (SAEs) from multivariate conditional regression
Process UAEs
The potential risk of difficult intubation detected during a pre-anaesthetic visit was the strongest predictor for the occurrence of a process UAE. In this category, patients were nearly five times more likely to experience a process UAE. These were also associated with outcome UAEs but with a smaller odds ratio (OR) of 2.0.
Further analysis of the risk factors associated with oesophageal intubation indicated that previous occurrence of difficult laryngoscopy (OR 13.7) and difficult intubation (OR 7.4) were the most strongly associated. Patients who underwent oesophageal intubation were also more likely to experience pharyngeal trauma (OR 7.0) and to have been predicted to be difficult to intubate in the pre-anaesthetic visit (OR 3.0).
Outcome UAEs
The occurrence of an outcome UAE was moderately associated with two risks detected during the pre-anaesthetic visit: difficult intubation (OR 1.5) and the risk of an allergic reaction (OR 1.4). These associations persisted even after adjustment for the occurrence of a process UAE. The longer duration of the procedure was independently selected as a risk factor for outcome UAEs: compared with short procedures (<90 min) outcome UAEs were 1.7 times more likely for medium procedures (90–180 min) and three times more likely for longer procedures (>180 min).
The occurrence of an outcome UAE was generally associated with other outcome UAEs—for example, patients who experienced hypotension were likely to have arrhythmias (OR 4.2), bradycardia (OR 7.7), hypoxaemia (OR 3.6), and tachycardia (OR 4.9).
Process CAEs
The occurrence of process CAEs was associated with the presence of a risk of haemorrhage defined during the pre-anaesthetic visit (OR 2.8). The occurrence of process CAEs was linked to outcome UAEs (OR 3.4) and was very strongly associated with outcome CAEs (OR 14.8). The longer duration of the procedure was associated with a higher frequency of process CAEs at approximately the same rate as for outcome UAEs (1.5 times more likely for medium duration procedures and three times more likely for long procedures).
When focusing on the most severe process CAEs (readmission to the operating theatre and unplanned transfer to ICU), it appeared that these were highly associated with pulmonary oedema (OR 46.2), cardiac arrest (OR 25.1), and unplanned blood transfusion (OR 37.4). Smaller associations were found with delayed discharge from the recovery room (OR 9.9), tachycardia (OR 11.6), and hypotension (OR 4.4).
Outcome CAEs
The occurrence of an outcome CAE was strongly associated with the occurrence of other SAEs: process CAEs (OR 11.5), outcome UAEs (OR 4.8), and process UAEs (OR 4.8). No other risk factors were selected in the multivariate model.
Discussion
Using a voluntary reporting system we have shown a strong link between the occurrence of UAEs and of CAEs during anaesthetic care, as well as with risks evaluated during the pre-anaesthetic visit. This confirms the usefulness of including frequent events in voluntary reporting systems. These events provide data for indicators of change in the performance of an anaesthetic department which are of practical value, and they are also of clinical interest because of their association with critical events.
DEFINITION AND PREVALENCE OF SAE
We favoured an approach based on ease of use of the SAE definition. Indeed, while the definition of certain SAEs such as death or cardiac arrest is intuitively obvious, others such as hypotension do not have a clear definition. In such cases the anaesthetist was responsible for detecting and reporting if the SAE had occurred. A rule based definition could have been adopted to avoid the variability between practitioners. However, the choice of the arbitrary thresholds for the duration or for vital signs such as blood pressure has a major impact on the clinical relevance of detected events.14
The practical value of our approach to the definition of SAEs is validated by the good agreement between the rates of events reported in this study and those in other systems based on voluntary reporting for common subsets of monitored events. In the study by Fasting et al the proportion of anaesthetic procedures associated with laryngeal spasm, bronchospasm, hypoxaemia, tachycardia, and difficult intubation was, at the most, 2.9% for the years 1993–5.5 For the same events the proportion was approximately 3.0% in this study. In four different hospitals Cohen et al reported nausea/vomiting, cardiac arrest, hypotension, hypertension, neurological complication, or transfer to intensive care in 13.5%, 14.5%, 13.4%, and 28.5% of anaesthetic procedures2 compared with 14.3% in this study. However, there is less agreement with systems using other methods of SAE detection and reporting; for example, automated scanning of computerised records for hypotension, hypertension, tachycardia, bradycardia or hypoxaemia, based on stringent threshold rules, revealed SAEs in 7.1% of procedures—much lower than the 17.5% found in the present study for the same events.
ATTITUDE TOWARDS SAE REPORTING
The reporting of untoward events occurring during anaesthesia potentially puts professionals in jeopardy as it may indicate an error on their part. Borrowing from the aeronautical paradigm, most systems have resorted to voluntary and anonymous reporting but, in such voluntary systems, although serious events were adequately declared, events associated with low morbidity were under declared.11 In a system like ours which is based on the identification of a wide range of undesirable events rather than only critical ones, this problem must be overcome.
When first presenting the project to the staff, we insisted that the reporting system was to be used for improvement issues only, and accordingly made the reporting anonymous. We chose to introduce a reporting form for every patient as a routine step in the process of anaesthesia, and to include nurse anaesthetists to complete the forms under the supervision of the anaesthetist. We thus benefited from the input of nurses who were interested in the implementation of this reporting system, and at the same time emphasised that anaesthetists should work as a team. As indicated before, most members of the department also took part in the various work groups that were defined to standardise preoperative evaluations and anaesthetic procedures. We believe that these multidisciplinary meetings were instrumental in the adoption of the reporting system itself. These groups also dealt with related issues such as design and maintenance of emergency carts and scheduling of operating theatres. Furthermore, staff meetings before and during this project provided an opportunity to promote a change of attitude to SAEs from dissimulation to acceptance.15 However, it is possible that the decrease observed in the rates of undesirable events resulted from reduced compliance with reporting (see below).
INCIDENCE OF SAE
The assessment of changes in the performance of a process is efficiently done with control graphs.12 These graphs are based on the assumption that the results of a particular process fluctuate around an average value with a given variance. Lagasse et al7 used control graphs to monitor the clinical indicators proposed by the Joint Commission for Accreditation of Healthcare Organizations, corresponding to critical events in our terminology, and found that their percentage was stable.
For critical events the percentage of SAEs in our department has also been essentially stable. This supports the notion that most variation is explained by common causes rooted in the process of care, or that “every system is designed to get the results it gets”.16 However, the control chart for undesirable events has shown a decreasing trend over the last year. We were concerned that it could reflect deficiencies in the reporting of UAEs, but more detailed analysis showed that this trend was largely the result of a decrease in patients suffering from nausea/vomiting and cutaneous rashes which can partly be explained by the increasing use of an anaesthetic drug (propofol) that reduces nausea and histamine release. It is important to note that other SAEs such as hypotension and process UAEs did not decrease.
USE OF PRE-ANAESTHETIC EVALUATION
The pre-anaesthetic visit has been compulsory in France since 1994. It is a unique occasion to judge whether the patient is fit for anaesthesia and to adapt the anaesthetic procedure to the condition of the patient. In the present study four risks evaluated during the pre-anaesthetic visit were examined for each patient: difficult intubation, allergy, haemorrhage, and thromboembolism. Because some of these risks were highly associated with the occurrence of SAEs, it must be asked whether more information could be integrated into the anaesthetic plan. For example, once a patient is evaluated as being difficult to intubate (using, for example, the Wilson index17 or the Mallampati score18), the choice of fibreoptic intubation is strongly advised.19 In this study, of the patients considered difficult to intubate, only in 52 (14.7%) was fibreoptic intubation used. These patients had slightly fewer SAEs related to intubation than those who underwent tracheal intubation (8.8% vs 19%). Encouraging the use of fibreoptic intubation in all patients considered difficult to intubate could reduce the risks of oesophageal intubation in these patients and thus improve safety. Because this approach would increase resource utilisation (physician training, fibreoptic endoscope sterilisation) and, given the low specificity of the scores for evaluation of difficult intubation,20 this issue must be further evaluated.
USE OF SAE REPORTING IN IMPROVING ANAESTHETIC CARE
Surveillance and, importantly, communication of SAEs alerts the clinical team to the need for an investigation and, ultimately, intervention in the anaesthetic process. However, in our department no alerts were raised concerning an increase in SAEs over a 30 month period. This is partly because of the stability of the anaesthetic process, but it is also a result of the larger weight given to specificity than to sensitivity in quality control techniques—in other words, making intervention the exception rather than the rule. The method used to construct the control limits in the control charts, called “three-sigma”, whereby an observation is considered unusual if it is more than three standard errors away from its theoretical value, is a perfect illustration of this approach.
Control charts are especially useful because of their visual presentation and ease of set up. In practice, several control charts should be constructed to increase the probability of detecting changes—for example, addressing SAEs individually or in small subsets of related events. An alternative method, more useful when SAEs are rare, is based on the detection of clusters of events. This can be achieved, for example, by determining whether the period of time between two consecutive deaths is getting shorter. However, this requires more sophisticated statistical approaches.10
REDUCING REDUNDANCY IN SAE REPORTING
So far it seems that common sense rather than evidence has driven the implementation of SAE reporting systems,21 and the decision as to which SAEs to monitor has been rather haphazard. By demonstrating that SAEs are correlated and may, in fact, be multiple descriptions of the same phenomenon, our study may help to define more usefully those SAEs that should be monitored. For example, hypotension was often associated with four other outcome UAEs—arrhythmia, bradycardia, hypoxaemia, and tachycardia—making these events redundant in some cases.
By reducing the categories of outcome UAEs to the four most common events (hypotension, bradycardia, nausea/vomiting, and rashes), the incidence of outcome UAEs would have been only slightly less than that actually observed (20% vs 22%) while the list of outcome UAEs would have been reduced by 70% from 13 to four. Focusing on systematic detection and reporting of few carefully chosen SAEs could thus be an alternative to more comprehensive but more demanding systems.
FUTURE DIRECTIONS FOR SAE REPORTING
The success of systems reporting critical events relies to a significant extent on the correction of active and latent errors in the anaesthetic process, identified after a detailed investigation of these events. In systems such as ours which rely more heavily on undesirable events, the identification of a specific step in the anaesthetic process which is causing the recurrence of a given SAE may be more difficult because different problems during anaesthesia could cause the same SAEs. Studying cascades of events or scenarios may provide the additional information required to link SAEs to anaesthetic care. The most common scenarios could be identified by the analysis of large databases of SAEs. The adoption of a common reporting system in most anaesthetic departments in France since 1999 is promising in this respect. Given the large number of anaesthetic procedures performed in France each year (approximately 8 million), better estimates of the association with SAEs could be obtained.
Finally, it cannot be emphasised too strongly that much work is also required to find methods for promoting the acceptance of SAE reporting in anaesthetic departments. It is high time for quality improvement to become part of the curriculum for medical and nursing students in France.
Key messages
-
Voluntary reporting of significant anaesthetic events is feasible and well accepted when the whole anaesthetic team is involved.
-
Undesirable and critical events occurring during the anaesthetic procedure are linked with risks evaluated in the pre-anaesthetic visit, and critical events are linked with less serious events earlier in the anaesthetic process.
-
The frequency of significant anaesthetic events is essentially stable over time, reflecting the performance of the whole system.
-
Control charts for the frequency of significant anaesthetic events allows efficient monitoring of the overall performance of the anaesthetic process.
What this paper adds to the area
The variety of anaesthetic events monitored by voluntary reporting systems has increased, from infrequent critical events to more frequent but merely undesirable events. Here we establish that critical events were linked with the earlier occurrence of undesirable events, and that all events were linked with risks evaluated during the pre-anaesthetic visit. We also show that the frequency of significant anaesthetic events is essentially stable over time.
Acknowledgments
This work was supported in part by ANDEM, Appel d'Offres PAQ 1995. The authors thank the editor for helping to improve the original manuscript and reviewers for their stimulating comments.