Article Text

Statistics from Altmetric.com
- CR-BSI, catheter related bloodstream infection
- CQI, continuous quality improvement
- CVC, central venous catheter
- MICU, medical intensive care unit
- central venous catheterization
- critical care
- infection control
- process assessment
- quality improvement
- CR-BSI, catheter related bloodstream infection
- CQI, continuous quality improvement
- CVC, central venous catheter
- MICU, medical intensive care unit
- central venous catheterization
- critical care
- infection control
- process assessment
- quality improvement
Central venous catheters (CVCs) are indispensable in the management of critically ill patients, and half of all intensive care unit (ICU) patients in the US have an indwelling CVC at any given time.1 CVCs expose patients to increased risk of infection, and up to 80 000 catheter related bloodstream infections (CR-BSIs) occur in ICUs in the US each year.2 At a cost of $34 500–56 000 per episode3,4 and with a crude mortality rate that may approach 35%,5 management of CR-BSIs remains an important issue for patient safety and cost of care.
Experts advocate a broad preventive approach as the key strategy for CR-BSI reduction,2 and preventive interventions achieve impressive results.6,7,8,9,10 However, sustaining the effect of an intervention after cessation of a study is difficult because multiple complex processes cause BSIs. Organizations that monitor CR-BSI rates alone (the “terminal” outcome) find troubleshooting a failing system after CR-BSI rates have already increased to be complicated and time consuming. A better strategy involves monitoring the processes that ultimately lead to the adverse event.
Continuous quality improvement (CQI) methodologies provide an ideal framework for initiating and sustaining improvements in complex systems.11 By definition, CQI engages front line staff in cycles of iterative problem solving, with decision making based on real time process measurements.12,13 Through the systematic measurement of key processes that lead to clinical outcomes, CQI allows an organization to maximize improvement efforts and sustain gains.
CONTEXT
On 1 November 2002 we initiated a patient safety project aimed at reducing CR-BSIs in the medical intensive care unit (MICU) of a 640 bed tertiary university teaching hospital. Approximately 600 patients are admitted to the 14 bed unit each year with a variety of illnesses including acute respiratory distress syndrome, asthma, chronic obstructive pulmonary disease, respiratory failure, pneumonia, sepsis, poisoning, drug overdose, and gastrointestinal bleeding. The MICU also cares for critically ill solid organ and bone marrow transplant patients. All patients undergoing CVC insertion during their stay in the MICU were eligible for participation. The hospital’s institutional review board approved the study protocol.
OUTLINE OF PROBLEM
For many years our busy MICU struggled with CR-BSIs. In 2002 the CR-BSI rate was 44% higher than the national median of 5.2 per 1000 catheter-days. Like many hospitals, we had historically focused on infection surveillance and staff education. However, we recognized that more innovative strategies were needed to tackle this ongoing complex problem. The impressive utility of CQI in other healthcare settings,14–18 coupled with successful reports from other high risk industries, encouraged us to consider a CQI approach.
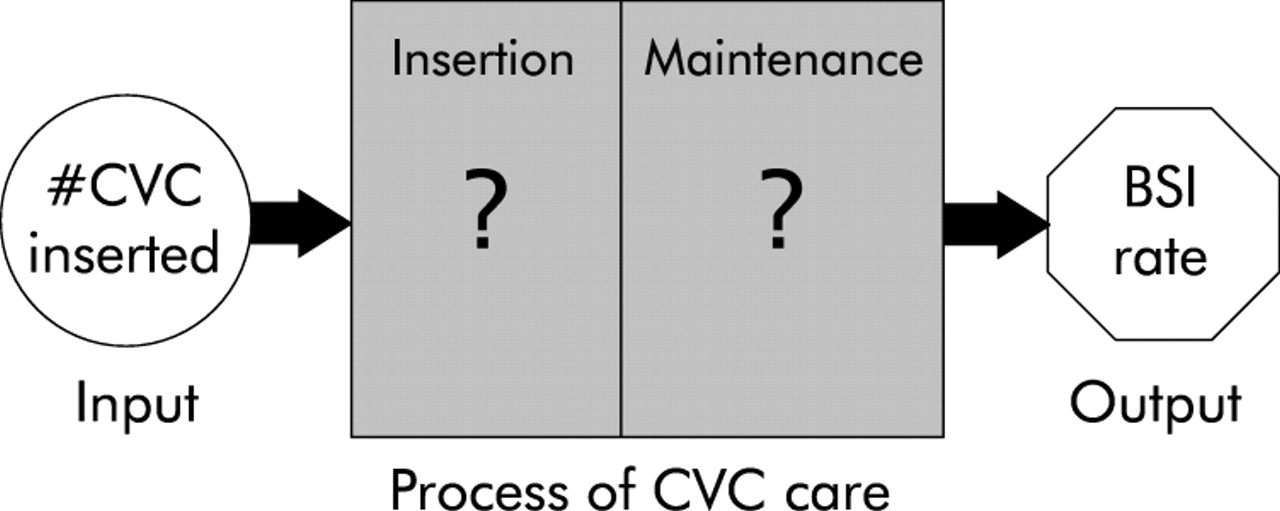
Although our infection control practitioners tracked the number of CVCs (inputs) and the number of CR-BSI (outputs), process measurements for the series of steps that changed those inputs into outputs were not routinely collected (fig 1). Before undertaking CQI we first needed a systematic method for measuring the process of CVC care in real time.

Flow diagram for the process of central venous catheter (CVC) care. BSI, bloodstream infection.
KEY MEASURES FOR IMPROVEMENT
Our primary goal was to show that real time measurement of CVC care was feasible in the MICU. We anticipated these new process measurements would guide CQI efforts and thereby lead to a reduced CR-BSI rate. To increase staff appreciation of the link between process measures and clinical outcomes, we fed these bundled data back to providers.
STRATEGIES FOR CHANGE
Interdisciplinary team
We assembled a voluntary interdisciplinary team with at least one MICU leader, infectious disease expert, front line staff member, and quality improvement expert (fig 2). The team’s goal was to develop a system for measuring the process of CVC care in real time with the understanding that this information would guide future improvement activities aimed at reducing infections. The team compiled a list of risk factors by reviewing the published literature on CR-BSIs, and then classified these risk factors depending on whether they occurred during insertion or daily maintenance (table 1). When deciding where to focus their initial efforts, the team selected CVC insertion as a high leverage starting point.20 Several issues guided this decision: (1) most CVCs in the MICU were inserted by trainees and there was a high likelihood of practice variability; (2) there was strong evidence linking certain insertion behaviors with CR-BSIs; and (3) CVC insertion was easily defined and amenable to improvement.
Factors impacting on central venous catheter (CVC) related infections
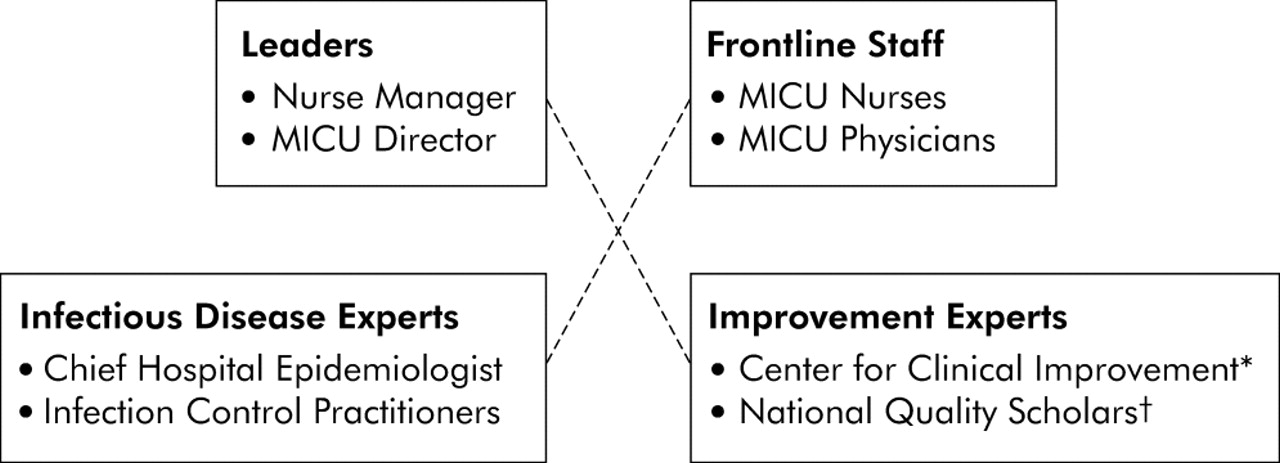
Interdisciplinary team. *The Center for Clinical Improvement is a group of improvement experts at Vanderbilt University Medical Center whose primary aim is to foster patient safety and improve the quality of health care. The group engages in various activities including education of caregivers and the advancement of improvement science. †The National Quality Scholars is a post-residency fellowship funded by the Veterans Health Administration. Its primary aim is to equip physicians with the skills necessary for a career focused on the scholarship, research, and teaching of healthcare improvement.19
Identifying barriers to and facilitators of change
A trained research nurse randomly observed five CVC insertions in the ICU over several days, collected data about compliance with evidence-based insertion behaviors, and identified potential barriers to and facilitators of change.21 After studying the local workflow, soliciting clinician input, and mapping the process of CVC care,22 the team established priority areas for measurement. These areas included provider education,23 trainee supervision,24 insertion site,25–27 hand hygiene,28 skin antisepsis,29 and use of maximal sterile barriers.30
Process measurement
To capture the desired process measures, the team developed a new standardized nursing checklist for CVC insertion (available online31). While studying the local workflow, the team noted that nurses handwrote a brief care note after CVC insertions. By including the essential elements from these nursing notes in the new checklist, the team eliminated any need for the handwritten notes. The new document employed check boxes and could be completed in 1 minute.
The new checklist recorded whether providers washed their hands, used maximal sterile barriers, maintained a sterile field, and were properly supervised. Although the measurement of these items was essential for process improvement, risk management did not believe these sensitive items belonged in the permanent medical record. To address this issue the team created a double paged carbonless document. The sensitive items were intentionally blacked out and unreadable on the second page.
Upon completing the checklist, the nurse detached the top page (with all items readable) and dropped it in a secure lockbox. The second page remained on the patient’s chart with the sensitive items blacked out. The infection control practitioners collected the checklists daily and scanned the de-identified forms into a pre-established computerized database using AutoData Scannable Office software (Minneapolis, MN). Using a standard image scanner, this application scanned pre-established fields on the checklist and imported the information into a spreadsheet database. These data were stored on a secure computer at the Center for Clinical Improvement for future statistical analyses.
The checklist was initially pilot tested for 1 week with two senior MICU nurses. They commented on readability of items, missed opportunities for measurement, and overall functionality of the checklist. We subsequently added, modified, or deleted several items based upon their input. After achieving a suitable final version, the checklist was introduced to all nursing staff and implemented throughout the entire MICU.
OUTCOME MEASUREMENT: BLOODSTREAM INFECTIONS
Our hospital Epidemiology and Infection Control section uses the definition for primary CR-BSI outlined by the Centers for Disease Control and Prevention National Nosocomial Infections Surveillance System (NNIS).2 Laboratory confirmed bacteremia (or fungemia) is attributed to a patient with a CVC if they have been in the ICU for at least 48 hours, provided the infection is not related to another distal source. Patients with a CVC who develop a BSI within 48 hours of ICU discharge also have CR-BSI.
Definitions for checklist items
Hand hygiene
Proper hand hygiene before insertion reduces CR-BSIs.28 Since alcohol based hand rubs are more efficacious than soap and water,32 we gave credit if either behavior was observed.
Trainee supervision
Studies suggest that there is an increased risk for infection when inexperienced providers insert CVCs.24 Since house staff insert most CVCs in our MICU, the checklist included whether the proceduralist was properly supervised. Based on guidelines established by the American Board of Internal Medicine,33 we considered trainees “supervised” if they had previously performed five CVC insertions or if another provider with experience of at least five CVC insertions supervised them during the procedure. In most cases the nurse directly inquired regarding the proceduralist’s experience. If the nurse was unable (or unwilling) to obtain this information, the checklist included an option “didn’t ask.”
Maximal sterile barriers
Studies show the importance of maximal sterile barriers (gloves, gown, mask, patient drape) during CVC insertions.30 The checklist recorded which individual barriers were used during the procedure. We defined “maximal sterile barriers” as the simultaneous use of all four component barriers.
Chlorhexidine skin preparation
Skin antisepsis with a 2% chlorhexidine preparation is superior to povidone-iodine and alcohol for reducing CR-BSIs.29 We gave credit for chlorhexidine whenever it was employed, even if other agents were also used.
Circumstances of CVC insertion
Providers may skip infection reducing steps during emergency procedures. We considered a CVC insertion “emergent” if a life threatening situation mandated the procedure immediately. Otherwise, the procedure was considered “elective”. To simplify classification, the checklist intentionally avoided the “urgent” parlance.
Multifaceted intervention
Although the checklist was developed as a measurement tool, its use during CVC insertions also made the checklist an important intervention. In fact, clinical reminders at the point of care are one of the most effective strategies for affecting daily practice.34 Since multifaceted interventions are more likely to alter physician behavior than single interventions,35 the team simultaneously implemented other intervention components aimed at reducing CR-BSIs. These included provider education, continuous audit, and performance feedback.
Provider education
Based on the successes of previous educational efforts,8,9,10 the team constructed a web based tutorial discussing catheter related infections.31 In addition to describing the new checklist, the tutorial explained the scientific evidence for recommended behaviors. The website recorded whether each provider completed a self-assessment examination. Leadership announced a new policy requiring annual CVC education for all MICU providers. A letter was sent to house staff asking them to independently complete the tutorial before their MICU rotation. A similar letter was sent to nursing staff explaining that the tutorial would be incorporated into their annual competencies curriculum. A repeat letter was sent 3 months later to providers who had not fulfilled the requirement. If individuals still did not complete the tutorial, the MICU leadership approached them privately.
Audit and feedback
A premise of the Centers for Disease Control and Prevention (CDC) National Nosocomial Infections Surveillance System (NNIS) is that constantly feeding back surveillance data to front line staff reduces hospital acquired infections.36 As a result, our infection control practitioners had traditionally generated monthly NNIS reports for the MICU. Although feedback alone is usually ineffective for altering provider behaviors,37,38 it is a useful complement to other strategies for improving provider performance.39–42 To increase our chances for success and raise awareness for the link between processes and outcomes, we bundled the new process measurements with the monthly NNIS reports. When feeding this information back to front line staff, the leadership emphasized that process measurement was transparent and blameless, data were de-identified, and the MICU was committed to CQI.
Analysis of data
For many years our hospital infection control practitioners tracked monthly CR-BSI rates using definitions established by the NNIS system.2 While providing an excellent framework for detecting infections, the NNIS database presented two statistical challenges. Firstly, CR-BSIs were statistically rare events and the aggregate monthly reports limited our ability to quickly detect changes. Secondly, NNIS counted all CVCs in the MICU regardless of whether the CVC was inserted by providers on another service. Since our efforts only targeted MICU providers, we needed an alternative approach that was capable of specifying the provider.
We overcame these barriers by using an alternative Shewart-type statistical control methodology, called a g chart.43 By monitoring the number of days between infections, the g chart has greater detection power for rare events compared with conventional binomial based approaches.44,45 Whenever a CR-BSI occurred we added the data point to our g chart and calculated the number of days from the previous infection. Rather than waiting until the end of a pre-specified time period, we took immediate advantage of each event and improved our ability to rapidly detect changes (see examples below). Furthermore, we were able to exclude CVCs inserted by providers on another service.
The g chart is a type of statistical process control (SPC) chart and therefore requires a basic understanding of the principles inherent to SPC.46–49 According to SPC theory, two types of variation exist: special and common cause variation. The managerial approach for reducing the variation depends on which type is present. Special cause variation refers to unnatural variation in a process, usually due to identifiable events. Reducing special cause variation should focus on investigating and eliminating the special events. Conversely, common cause variation is natural and inherent to a process on a regular basis. As an intrinsic part of the process, common cause variation is best achieved through process redesign.
At the start of the project we constructed a baseline (pre-intervention) g chart by querying the NNIS database from 1 January 2000 to 31 October 2002 (fig 3, observations 1–39). We only plotted CR-BSIs on the g chart for catheters inserted by the MICU—for example, dialysis catheter CR-BSIs were not included on the g chart. We measured the average time between infections (27 days) and used Benneyan’s method for calculating an upper control limit (UCL = 109 days) at three standard deviations above the pre-intervention mean.44 During the pre-intervention period the number of days between infections was consistently below the UCL. The absence of any points above the UCL suggested that the variation in time between CR-BSIs was inherent to our current process of care (that is, common cause),47 and that the proper way to reduce the CR-BSI rate was through process redesign or CQI.50 Our goal was to reduce the CR-BSI rate and thereby increase the time between events. Based on the g chart, we considered our intervention successful if data points fell above the UCL since this would correspond to a decreased CR-BSI rate.

Days between catheter related bloodstream infections (CR-BSIs) on a g chart. The g chart monitors time between events. The goal is to increase time between infections, hence higher points indicate better performance. As the CR-BSI rate decreases there are fewer data points per year—this is reflected in shorter calendar year bars along the top. The baseline period is from January 2000 through October 2002 (inclusive of infections 1–39). The intervention period is from November 2002 through October 2004 (initiated after infection 39 and inclusive of infections 40–45). During the baseline period the number of days between infections was consistently below the upper control limit (UCL), suggesting the variation in time between infections was random and inherent to the process of care. During the post-intervention period the number of days between infections was frequently above the UCL, suggesting the intervention had introduced non-random improvements into the process of care.
EFFECTS OF CHANGE
Process measurement
In the 2 years between 1 November 2002 and 31 October 2004, a total of 630 CVCs were inserted using the new checklist. Mortality rates, admission diagnoses, ventilator days, and lengths of stay were similar for patients admitted during the pre-intervention and post-intervention periods (data not shown). Nursing staff immediately embraced the new insertion checklist because it simplified their documentation and replaced handwritten notes.
Following the introduction of the checklist, the MICU for the first time collected frequency characteristics for CVC insertions (table 2). Triple lumen catheters comprised over half of all CVC insertions and the subclavian vein was the most common site. As expected in a training hospital, interns inserted most lines. The majority of procedures occurred under non-emergent circumstances.
Characteristics of CVCs inserted from November 2002 to October 2004
The checklist also generated real time measurements for the CVC insertion process (fig 4). Using these new process data, the team embarked on cycles of CQI and also began exploring the reasons for certain provider behaviors. Examples of CQI (“maximal sterile barriers”) and an exploratory analysis (“femoral CVCs”) follow.

Process measurements for central venous catheter (CVC) insertions. Process measurements of provider behaviors during CVC insertions (post-intervention) are plotted over time. The data have been combined into 3 month aggregates to simplify display. In practice, the front line staff receive monthly updates with much greater detail.
Example 1: Maximal sterile barriers
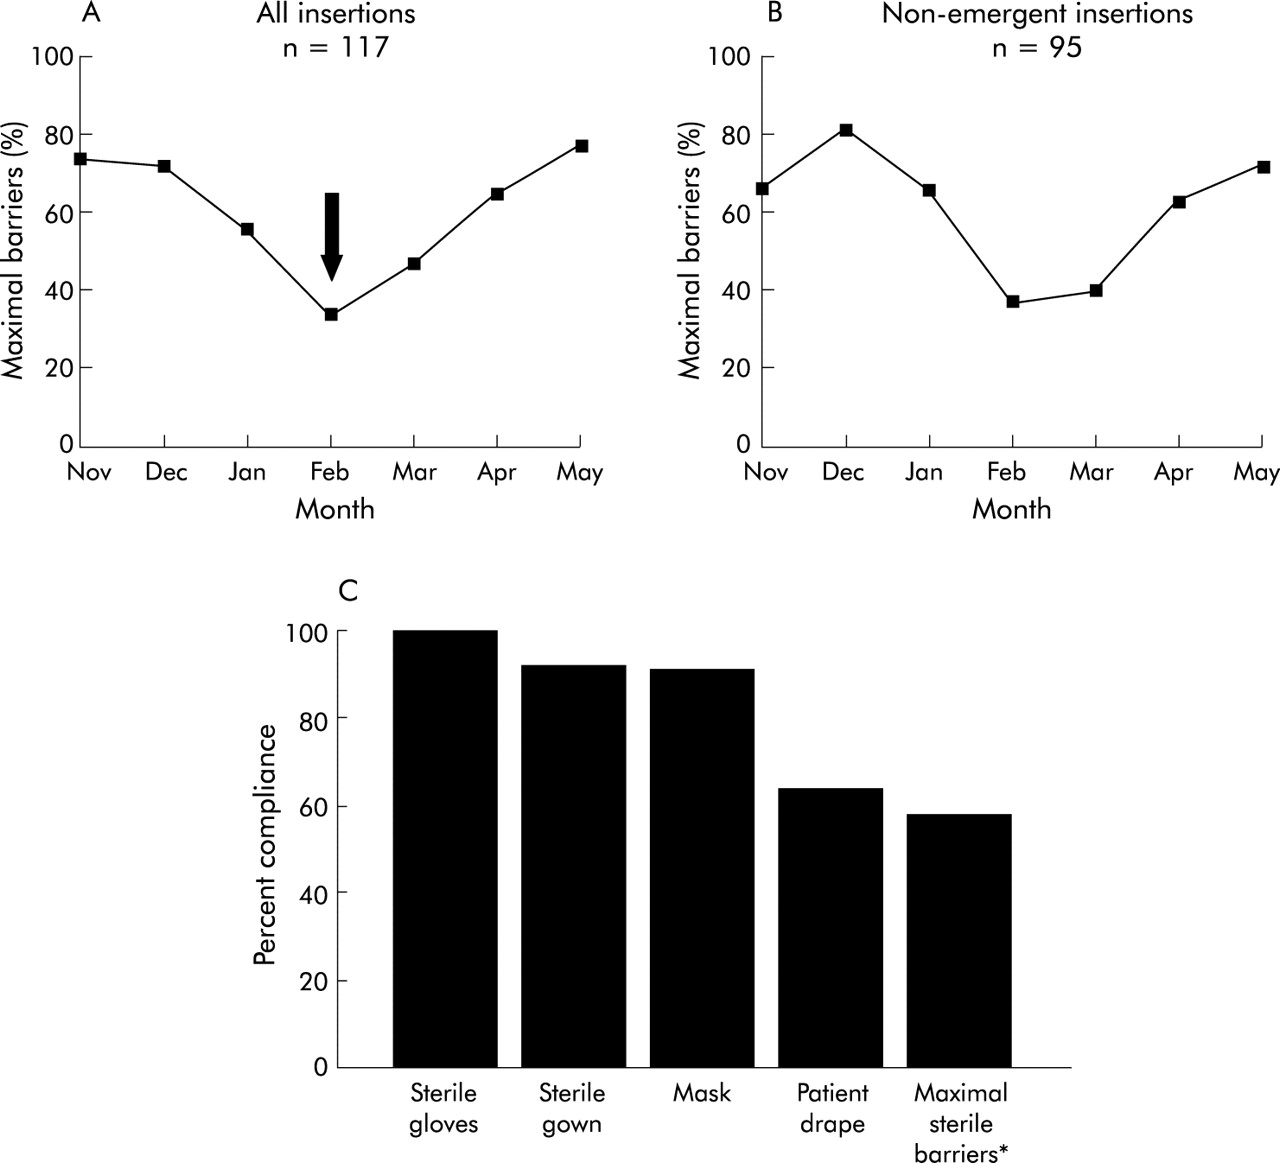
Adherence to maximal sterile barriers declined unexpectedly in early 2003 (fig 5). The team performed secondary analyses of the process measures and noted that this trend was not explained by emergent placement circumstances. A breakdown by individual barrier components revealed that use of the patient drape was the main limitation to maximal sterile barrier adherence. The team ensured adequate supplies were stocked on the floor and confirmed providers had completed the tutorial. Leadership asked front line staff to emphasize appropriate sterile technique with trainees, particularly use of the patient drape. In response, the MICU began purchasing newer CVC kits prepackaged with drapes. In the following months adherence to maximal sterile barrier gradually improved.

Adherence to use of maximal sterile barriers during insertion of central venous catheters (CVCs). Example showing how real time process measurements guided improvement efforts. (A) Declining use of maximal sterile barriers during January and February (arrow) prompted secondary analyses. (B) The declining performance was not attributable to insertions during emergent circumstances. (C) Process measurements for the individual barriers revealed that provider use of the patient drape was the main obstacle to maximal sterile barriers adherence. *Maximal sterile barriers denote the simultaneous use of all four barrier components.
Example 2: Femoral CVCs
Femoral CVCs have more infectious and thrombotic complications than other venous sites.25–27 After noting a large number of femoral CVCs early in the study, the ICU decided to further explore this practice pattern (table 3). Femoral insertions were more likely to have been preceded by attempts at another site, suggesting that the femoral site was often a secondary choice. Interestingly, femoral CVCs exhibited lower rates of hand washing, chlorhexidine use, and maximal sterile barriers. These trends were not explained by insertions under emergent conditions (data not shown). Contrary to popular belief, the femoral site was not more popular than other venous sites during emergent situations. As provider performance gradually improved for all insertions, compliance with recommended behaviors likewise improved at the femoral site. However, the percentage of femoral CVCs has remained unchanged for 2 years.
Central venous catheters (CVCs) inserted at the femoral site compared with other sites (November 2002–May 2003)
Bloodstream infection rate
The last pre-intervention CR-BSI occurred 58 days before the study (fig 3, infection number 39). When a CR-BSI occurred 55 days into the study, we totalled the number of days from the last infection (58+55 = 113) and placed this data point on the new g chart (number 40). After 233 days another infection occurred (number 41). For the first time in 3 years, data points fell above the UCL, suggesting that special cause variation had affected the process of CVC care. We suspected our improvement efforts were making a difference and shared these preliminary results with the staff.
One year into the study the MICU experienced four CR-BSIs in 6 months (fig 3, infections 41–44). The team began investigating potential causes for this declining performance. The process measures did not reveal any change in insertion behaviors. The infection control practitioners could not identify any pattern among organisms, catheter types, providers, or insertion site. As a result, the team re-emphasized the importance of daily CVC maintenance behaviors with the nursing staff (table 1). Although a single target was never identified, the MICU soon regained its previous level of high performance.
Overall, the MICU experienced only six CR-BSIs during the 2 years following the intervention. The NNIS CR-BSI rate was 3.8/1000 catheter-days during the final 6 months of the study. In contrast, the MICU experienced 25 CR-BSIs during the 2 years preceding the intervention, corresponding to a NNIS CR-BSI rate of 7.0/1000 catheter-days. Another graphical view of these results is shown across the top of fig 3. Horizontal bars designate the calendar years for the pre- and post-intervention periods. As the time between CR-BSIs increases, the number of events per year decreases and the calendar bars decrease in length.
LESSONS LEARNT AND NEXT STEPS
We have designed a new standardized nursing checklist for CVC insertion and have shown that real time process measurement is feasible in a busy MICU. We used process measurements to overcome barriers to change and successfully reduced CR-BSIs using a multifaceted intervention. Although our intervention was modelled on previous efforts, our use of continuous real time process measurements offered a unique advantage not previously described. Two years later our CR-BSI rate remains at a historic low and process measurement continues, suggesting good sustainability for our efforts. Armed with real time process measurements, we can easily engage in CQI, troubleshoot our system, and monitor for behavioral relapses.
Although we successfully reduced CR-BSIs, the development of a system for continuous real time process measurement distinguishes this project. Our ICU had historically monitored CR-BSI outcomes alone and thus reacted only if clinical performance declined. In contrast, our staff now use process measurements to prospectively test changes and continually improve the quality of CVC care. The experience has helped our organization to overcome our own “process illiteracy”,22 and we are now exporting this project to the entire hospital.
Our results support the findings of recent studies that have used multifaceted interventions to reduce CR-BSIs. Warren et al7 designed a multifaceted educational intervention that included reminders at the point of care and performance feedback. Following implementation, the CR-BSI rate dropped nearly 42%. Berenholtz et al6 eliminated nearly all CR-BSIs in their ICU after implementing five staggered interventions over a 4 year period. These efforts included educating providers, simplifying insertions by stocking supplies on a single cart, removing catheters at the earliest opportunity, using an insertion checklist, and empowering nurses to stop insertions if patient safety was compromised. Overall, multifaceted preventive interventions are an excellent strategy for reducing CR-BSIs. We believe our use of real time process measurements not only complements this approach but also improves our chances for sustaining any realized gains.
Our project highlighted several key concepts for sustainability of any improvement initiative (box 1). We recognized that success depended on leadership buy-in, and we therefore enlisted this support early in the project. Through the efforts of an interdisciplinary team, we engaged front line staff, standardized documentation, simplified work, and avoided burdensome data collection by embedding measurement into the daily workflow.51 Theoretical frameworks guided our efforts, including transparency, avoidance of blame, real time process measurement, and dynamic feedback. We implemented changes at the level of the individual provider and patient, but considered multiple levels within the healthcare system.52 For example, we aligned our objectives with national organizations such as the CDC and the Joint Commission.
Box 1 Key concepts for sustainability
-
Leadership support
-
Interdisciplinary teams
-
Standardize and simplify work
-
Embed measurement in daily work
-
Transparency and avoidance of blame
-
Real time process measurement
-
Continuous audit and feedback
-
Systems approach
Overcoming patient safety challenges with CQI methodologies makes good sense. Accrediting bodies now mandate that hospitals demonstrate process improvement at the patient level53,54 and, by definition, CQI involves front line staff in cycles of iterative process improvement. CQI is also well suited to the growing complexity of healthcare, a particularly important issue in the ICU. Moreover, hospital leaders and improvement experts believe CQI deserves a prominent role in health care,55 an endorsement that is likely to improve the sustainability of CQI efforts.
We assessed the impact of our intervention using the g chart. Although CR-BSIs are rare events, the mathematical properties inherent to the g chart allowed us to detect changes in the CR-BSI rate rapidly and thereby assess the impact of our intervention at the earliest opportunity. Two months after the release of our intervention we suspected our efforts were making a difference and we shared these preliminary results with front line nurses and physicians.
Our project has potential limitations. We assumed that nurses accurately captured the information and completed a checklist for every insertion, but formal validity and reliability analyses were not undertaken. By using the g-type chart we assumed that system factors affecting CR-BSI probability were stable in our MICU. Although the number of patient admissions, mortality rates, admission diagnoses, and ICU lengths of stay were similar during the baseline and intervention periods, it is possible that some undetected case mix variable or change in catheter duration may have contributed to the decreased CR-BSI rate. Regardless of this, patient variables would not affect the accuracy of process measures. While the checklist specifically targeted insertion, unmeasured improvements during catheter maintenance may also have contributed to the reduced CR-BSI rate. Finally, we did not determine whether every component in our multifaceted intervention actually contributed to the improvements.
Concerns about patient privacy and institutional risk management produced unintended barriers to quality improvement. We addressed these issues by devising an anonymous de-identified system for process measurement. The limitation to this trade off was our inability to further analyse outcome or process measures at the patient level. If quality improvement remains a priority for our healthcare system, oversight guidelines will need to better define how CQI efforts can achieve their maximal effect while addressing concerns about discoverability.
This study calls attention to a common dichotomy in today’s healthcare system. Many hospitals spend considerable resources tracking nosocomial infections but rarely measure the clinical processes that contribute to those outcomes. Successful infection prevention requires interdisciplinary teams, educational interventions, and data dissemination to clinical staff.56 By developing a system that measures a process of care in real time, an organization is poised to refine these approaches, generate hypotheses, test changes, and react appropriately.
Acknowledgments
The authors thank Steve Deppen and Martha Newton (Center for Clinical Improvement); Bill Schaffner and Tom Talbot (Infection Control and Hospital Epidemiology); Jan Bachman and Arthur Wheeler (MICU) and the entire 7-North staff for their hard work and ongoing commitment to patient safety.
REFERENCES
Footnotes
-
Dr Wall was supported by the Office of Academic Affiliations, Department of Veterans Affairs, VA National Quality Scholars Program and with resources at the VA Tennessee Valley Healthcare System, Nashville, TN. Dr Ely is the Associate Director of Research for the VA Tennessee Valley Geriatric Research and Education Clinical Center (GRECC). He is a recipient of the Paul Beeson Faculty Scholar Award from the Alliance for Aging Research and is a recipient of a K23 from the National Institute of Health (#AG01023-01A1).
-
Competing interests: none declared.
Linked Articles
- Quality Lines