Article Text

Abstract
Objective: To assess patient safety culture (PSC) in the nursing home setting, to determine whether nursing home professionals differ in their PSC ratings, and to compare PSC scores of nursing homes with those of hospitals.
Methods: The Hospital Survey on Patient Safety Culture was modified for use in nursing homes (PSC-NH) and distributed to 151 professionals in four non-profit nursing homes. Mean scores on each PSC-NH dimension were compared across professions (doctors, pharmacists, advanced practitioners and nurses) and with published benchmark scores from 21 hospitals.
Results: Response rates were 68.9% overall and 52–100% for different professions. Most respondents (76%) were women and had worked in nursing homes for an average of 9.8 years, and at their current facility for 5.4 years. Professions agreed on 11 of 12 dimensions of the survey and differed significantly (p<0.05) only in ratings for one PSC dimension (attitudes about staffing issues), where nurses and pharmacists believed that they had enough employees to handle the workload. Nursing homes scored significantly lower (ie, worse) than hospitals (p<0.05) in five PSC dimensions (non-punitive response to error, teamwork within units, communication openness, feedback and communication about error, and organisational learning).
Conclusions: Professionals in nursing homes generally agree about safety characteristics of their facilities, and the PSC in nursing homes is significantly lower than that in hospitals. PSC assessment may be helpful in fostering comparisons across nursing home settings and professions, and identifying targets for interventions to improve patient safety.
- HSOPSC, Hospital Survey on Patient Safety Culture
- PSC, patient safety culture
- PSC-NH, patient safety culture in nursing homes
Statistics from Altmetric.com
- HSOPSC, Hospital Survey on Patient Safety Culture
- PSC, patient safety culture
- PSC-NH, patient safety culture in nursing homes
Each year, more than 1.6 million people receive care in one of over 16 500 nursing homes in the US.1,2 The lifetime risk of nursing home placement for people aged ⩾65 years is about 43%.3 There are far more nursing homes than hospital beds, and this number is expected to grow over the next few decades.3,4 In 2004, national expenditure on nursing home care totalled US$115.2 billion, or about 6.1% of the national healthcare expenditure.5 Nursing homes are arguably the most criticised sector of the healthcare system, with continued concerns about the provisions of quality, cost, accessibility and patient safety.6,7,8,9,10
The Institute of Medicine suggests that the biggest challenge to moving towards a safer healthcare system is changing the patient safety culture from one in which people are blamed for errors to one in which errors are treated as opportunities to improve the system and prevent harm.11 Patient safety culture (PSC) is an emerging area of research that examines how individual values, attitudes, perceptions, competencies and behaviours of people and groups determine an organisation’s commitment, style and proficiency in health and safety management.12,13 The key elements of patient safety culture are:
-
a shared belief that healthcare is a high-risk undertaking;
-
an organisational commitment to detecting and analysing patient injuries and near misses; and
-
an environment that balances the need for reporting of events and the need to take disciplinary action.14
The Institute of Medicine also recommends that healthcare organisations assess their PSC, establish comprehensive patient safety programmes to increase detection of adverse events, and redesign systems to reduce opportunities for error.14,15 PSC survey instruments have been used to assess internal and external benchmarking, to identify areas for improvement, to evaluate the success of patient safety interventions, and to fulfil regulatory requirements in hospitals, but have not been applied to nursing homes.16–18 This study aimed to assess patient safety culture in the nursing home (PSC-NH), to determine whether various healthcare professionals differ in their perceptions of patient safety culture and to compare patient safety scores of nursing homes with those of hospitals.
METHODS
Survey instrument
The Hospital Survey on Patient Safety Culture (HSOPSC) was designed by the Agency for Healthcare Research and Quality to assess staff perspectives of PSC across whole institutions or units, track changes in PSC over time, and evaluate the effect of patient safety interventions.19 The HSOPSC has 12 PSC dimensions and two “outcome measures” (box 1). Each dimension has 3–5 questions and uses a 5-point Likert scale of agreement (“strongly disagree” to “strongly agree”) or frequency (“never” to “always”). The outcome measures are single-item responses about the number of “events” reported in the past 12 months (defined as errors of any type, regardless of whether they result in patient harm) and the overall patient safety grade (“excellent” to “failing”). To create publicly accessible benchmarking data, the survey was pilot-tested with 1419 hospital employees from 21 hospitals across the US in 2003. Analyses showed that all 12 dimensions had acceptable levels of internal consistency (Cronbach’s α values ranged from 0.63 for staffing to 0.84 for frequency of event reporting).19
Box 1 Patient safety subscales in the Hospital Survey on Patient Safety Culture19
Patient safety dimensions
-
Communication openness
-
Feedback and communication about error
-
Frequency of events reported
-
Handovers and transitions
-
Management support for patient safety
-
Non-punitive response to error
-
Organisational learning and continuous improvement
-
Overall perceptions of safety
-
Staffing
-
Supervisor/manager expectations and actions promoting patient safety
-
Teamwork across units
-
Teamwork within units
Patient safety outcomes
-
Number of events reported
-
Overall patient safety grade
The HSOPSC was pilot tested for use in the nursing home setting by two doctors, two pharmacists, two advanced practitioners (a nurse practitioner and a physician assistant) and two nurses. On the basis of their suggestions, the following changes were made to create the PSC-NH survey:
-
additional definitions were added to aid clarification for participants;
-
the phrases “hospital work area” and “unit” were replaced with “nursing home;” and
-
the demographics section was adapted to include types of professionals working in this setting.
No other changes were made. The PSC-NH uses the same question format, question order and response options as the HSOPSC.
PSC domain scoring
Guidelines for computing patient safety subscales for the HSOPSC have already been published, and we used the same scoring methods so that the results of this study could be compared with their benchmark data.19 The scoring consists of several steps. Firstly, individual responses to each survey question were classified as a “positive” response if the actual response was “Agree/Strongly agree” or “Most of the time/Always” in positively worded questions, and “Disagree/Strongly disagree” or “Rarely/Never” in reverse-worded questions. Next, for each respondent, domain scores were computed by taking the number of positive responses for each domain, dividing it by the number of questions in the same domain, and multiplying by 100. The resulting PSC domain scores therefore range from 0 to 100, where lower scores are interpreted as worse PSC.
Study participants, settings and procedures
In 2005, with approval from the University of Pittsburgh Institutional Review Board and the administrators and medical directors of four nursing homes, health professionals were recruited to complete the PSC-NH.
The four sites were independently owned non-profit nursing homes, one urban and three in suburban settings, with an average bed size of 150. The four nursing homes employed 151 regular full-time and part-time healthcare providers representing four professions: doctors, pharmacists, advanced practitioners, and nurses. To ensure that doctors and advanced practitioners had an accurate perception of PSC, only those clinicians who provided care for at least 10% of the residents at a given facility and all medical directors were invited to participate.
Between May and July 2005, nursing home administrative personnel distributed survey packets to all 151 healthcare workers. Each packet contained a cover letter signed by the nursing home administrator and medical director explaining the study, a copy of the survey, a prepaid reply envelope for confidential return via US mail, and a US$10 gift certificate request. A second packet was distributed 4 weeks after the first packet to all non-respondents.
Data analysis
To calculate response rates, the number of respondents per nursing home or profession was divided by the total number of potential respondents per nursing home or profession. Descriptive statistics were computed for all respondents and also stratified by profession, accounting for the effect of clustering due to facility on standard errors (SE) of the means. To compare our results for the whole group with the published benchmarks, a one-sample hypothesis test was performed for each domain, using a z statistic constructed with the SE corrected for clustering and its asymptotic normality. To compare PSC domain scores across professions, a linear mixed model was fit to each domain score, with profession as the main fixed effect of interest and facility as a random effect to account for clustering.20,21 To compare proportions of positive responses to each individual survey question across professions, a generalised estimating equations model was fit to each individual survey question with profession as the main fixed effect of interest, and a within-facility exchangeable correlation structure to account for facility level clustering, in further exploratory analyses (data not shown).21 All statistical analyses were conducted using SAS V.8.2.
RESULTS
Response rates and demographics
Of 151 surveys distributed, 104 (68.9%) were returned. Facility response rates ranged from 55.8% to 92.9%. Pharmacists had the highest response rate and doctors the lowest (100% v 52%). In all, <1% of surveys had missing information. There was no identifiable pattern of missing responses across items or nursing homes. Most respondents were women and were full-time employees (table 1). Respondents had worked in nursing homes for a mean of 9.8 years and in their current position and current facility for a mean of 7.1 and 5.4 years, respectively. Of the 104 respondents, 82 (78.8%; 78 nurses and 4 doctors) were employees of a participating facility.
Characteristics of respondents, stratified by profession*
PSC across professions in the nursing home
Mean scores for each PSC-NH dimension varied by profession (table 2). Only attitudes about staffing issues (eg, having enough employees to handle the workload) differed significantly across professions (p<0.03); nurses and pharmacists had higher mean scores than advanced practitioners and doctors. The composite scores for 7 of the 12 dimensions were lower (ie, worse) for advanced practitioners than the other professions, whereas pharmacists rated 6 of the 12 dimensions higher than the other professions.
Mean patient safety culture composite scores across professions*†
PSC-NH compared with hospital benchmarking data
For 5 of the 12 dimensions, nursing home composite scores were significantly lower than hospital composite scores (table 3). The largest differences were in non-punitive response to error (10.6 for nursing homes v 43.0 for hospitals; p<0.01) and teamwork within units (45.6 v 74.0; p<0.01). Significant differences (p<0.05) were also found in communication openness; feedback and communication about error; and organisational learning and continuous improvement. In only one dimension—that is, management support for patient safety—were scores higher for nursing homes than hospitals, but the difference was not significant (66.2 v 60.0; p = 0.34).
Comparison of mean patient safety culture composite scores of nursing homes and hospitals
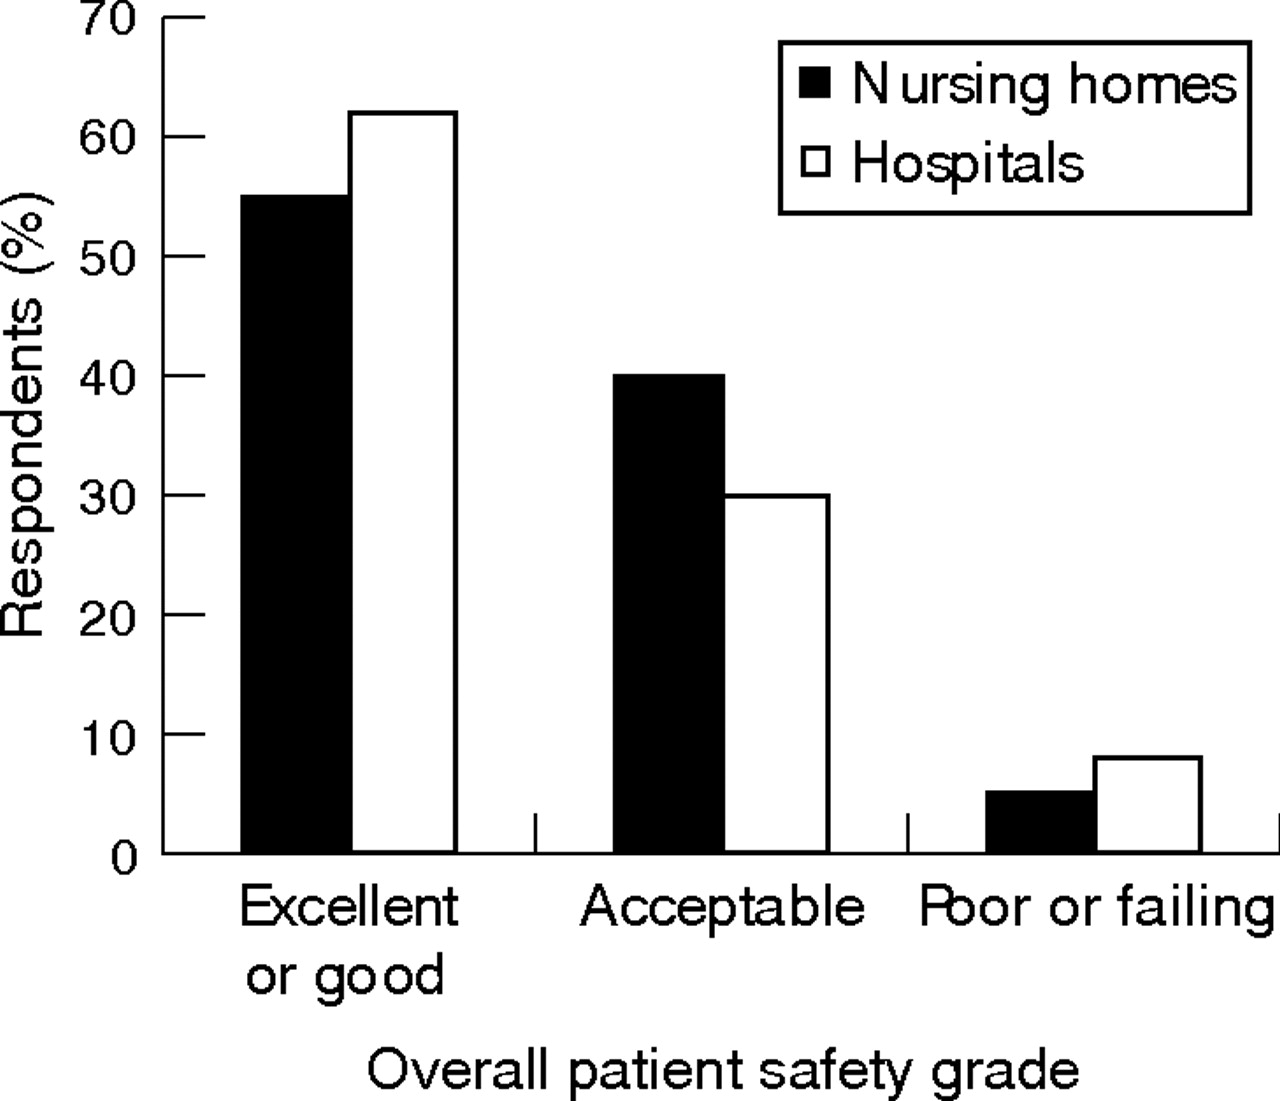
Survey respondents from nursing homes reported a higher number of adverse events during a 12-month period (fig 122) and a lower overall patient safety grade (fig 222) than hospitals.

Respondent estimates of events reported by nursing homes and hospitals in a 12-month period. Hospital benchmarking data derived from Agency for Healthcare Research and Quality.22

Respondent report of overall patient safety grade in nursing homes and hospitals. Hospital benchmarking data derived from Agency for Healthcare Research and Quality.22
Internal consistency
The internal consistency of the individual PSC-NH dimensions was generally similar to that of the HSOPSC. Cronbach’s α values ranged from 0.50 for staffing to 0.84 for teamwork across units.
DISCUSSION
Key findings
This study provides the most complete information available to date on patient safety culture in nursing homes and disclosed two important findings. Firstly, the various types of professionals working in nursing homes were in general agreement on 11 of the 12 PSC dimensions measured in the survey. Secondly, on five dimensions, the composite scores for nursing homes were significantly lower than those for hospitals.
Staffing was the only PSC dimension in which nursing home professions differed. Adequate nurse staffing levels are important to ensure quality and reduce risks of healthcare problems.23–26 When compared with doctors and advanced practitioners, nurses were more likely to perceive that there was enough staff to handle the workload, the staff were not working for more hours than is best for patient care, and the staff was not trying to do too much too quickly. This finding is in contrast with recent studies documenting insufficient nursing staff and difficulties in recruiting and retaining qualified staff.27–29
Nursing homes differed from hospitals especially in perceived response to error, which was reported as more punitive in the nursing home. This finding was not unexpected, because error-reporting policies and processes are believed to perpetuate a punitive environment in nursing homes.30 Regulation, the predominant form of overseeing nursing homes, is believed to invoke a more punitive culture, as opposed to accreditation, the predominant form in other healthcare settings.9 In fact, only a fraction of nursing homes are accredited by the Joint Commission on Accreditation of Healthcare Organizations, despite evidence suggesting that accredited nursing homes have fewer complaints and instances of deficiencies filed against them.31
Previous studies have described nursing homes as rigidly hierarchical and particularly difficult environments for quality-improvement initiatives.32,33 This environmental characteristic may underlie the significantly lower scores in nursing homes compared with hospitals on teamwork within units, communication openness, feedback and communication about error, and organisational learning. Only in management support for patient safety was the composite score greater for nursing homes than hospitals.
One key to quality improvement is the introduction of organisational changes that focus on PSC.34–37 Fundamental cultural change is necessary to ensure that innovations introduced to improve patient safety, such as computerised provider-order entry and computerised decision-support systems, are realised.16 Therefore, before patient safety initiatives are implemented in nursing homes, an important step is to measure the PSC.38
Strengths and limitations
This study has a substantial number of strengths. It is the first systematic assessment of PSC in the nursing home setting. The instrument to measure PSC is based on the same items and dimensions as the hospital instrument developed by the Agency for Health Care Research and Quality.19 The response rate was good and comparable with previous studies in the hospital setting.22,38
There are also limitations. Although only modest modifications were made for use in the nursing home setting, the instrument’s psychometric properties were altered slightly. Although the study included nursing home professionals in four categories, nurses’ responses dominate the aggregate results. The smaller numbers of other types of health professionals may have limited the statistical power to detect significant differences across professions. Nevertheless, nurses represent the most prevalent professional staff in most healthcare settings and the distribution of professions among study respondents was similar to other PSC studies.22,38 Excluding certified nursing assistants is a limitation, as they provide a considerable amount of direct patient care, and their responses would have provided an important perspective on PSC. Only a small number of facilities in the same metropolitan area were surveyed and all were non-profit institutions, potentially limiting the generalisability of our results.
Implications and further research
PSC should be assessed in more nursing homes with varied institutional characteristics and in a broader range of personnel including certified nursing assistants and nursing home administrators. To better understand the relationship between PSC and institutional characteristics, studies should examine relationships with bed size, type of ownership, staffing levels, staff turnover rate, and number and type of deficiencies. Data on PSC can help establish a baseline for future benchmarking, identify opportunities for quality improvement, serve as a basis for policy changes and long-term reform strategies, and provide consumers with information helpful in selecting a nursing home.16,39
Additional studies in the nursing home relating patient and staff outcomes to PSC should be conducted. In the hospital setting, PSC interventions have been shown to help reduce lengths of stay, decrease drug-reconciliation errors and improve nursing staff retention.40 A strong safety culture has also been linked to compliance with safety work practices among nurses.41 Longitudinal studies and clinical trials can assess the effect of safety culture interventions on important patient and staff outcomes.
CONCLUSIONS
Professionals in nursing homes generally agree about safety characteristics of their facilities, and PSC is significantly lower in nursing homes than in hospitals. The new assessment survey could foster comparisons across nursing homes and professions and help identify targets for interventions to improve patient safety (see Appendix available online).
Acknowledgments
We thank the staff of Asbury Health Center, Baptist Homes of Western Pennsylvania, RxPartners-LTC, UPMC Senior Living Seneca Place, and UPMC Senior Living Heritage Shadyside for their assistance throughout the study.
REFERENCES
Supplementary materials
Files in this Data Supplement:
Footnotes
-
Funding: This study was supported in part by NIH grants 8K12 RR 023267 (Roadmap Multidisciplinary Clinical Research Career Development Award Grant), 5T32AG021885, P30-AG024827, The American Medical Directors Association Foundation/Pfizer Quality Improvement Award and by the Merck/AFAR Junior Investigator Award in Geriatric Clinical Pharmacology.
-
Competing interests: None declared.
Linked Articles
- Quality Lines