Article Text

Abstract
Introduction: Falls in hospital inpatients are common, with reported rates ranging from 3 to 14 per 1000 bed days. They cause physical and psychological harm, are associated with impaired rehabilitation, increased length of stay and excess cost, and lead to complaints and litigation, making them a crucial area for risk management. A National Reporting and Learning System (NRLS) for patient safety incidents in England and Wales was utilised to examine frequency of falls in hospitals specialising in acute care, rehabilitation and mental health; related harm; timing; age and gender of patients who fell; and to draw general lessons from this which might inform fall-prevention strategies.
Methods: The NRLS database was searched retrospectively for slips, trips and falls occurring between 1 September 2005 and 31 August 2006. Organisations were classified as “regularly reporting” if they returned reports at least monthly and with at least 100 patient safety incidents per month for acute trusts and 50 per month for community and mental health trusts. Falls rates were standardised as number of falls per 1000 occupied bed days. Reporting hospitals used standardised categories for degree of harm from incidents, and injury rates were calculated as the percentage of injuries by severity per fall. Key word searches combined with free text scrutiny were conducted to identify specific injuries. Specific falls rates for time of day, gender and age were also compared, with age and gender adjusted for bed occupancy rates from Hospital Episode Statistics (HES) data. Most data were used descriptively, though 95% confidence intervals were used to facilitate comparisons between groups and where samples are generalised to the data set as a whole.
Results: Reports of 206 350 falls were received from a total of 472 organisations. Falls incidents accounted for 32.3% of all reported patient safety incidents. 152 069 (73.7%) reports were from acute hospitals, 28 198 (13.7%) from community hospitals, and 26 083 (12.6%) from mental health units. Only 102 of these could be classified as “regularly reporting” organisations, and in these the mean standardised rates of falls per 1000 bed days were 4.8 in acute hospitals, 2.1 in mental health units and 8.4 in community hospitals. 133 417 falls (64.7%) resulted in “no harm,” 64 144 (31.1%) in “low harm,” 7506 (3.6%) in “moderate harm,” and 1230 (0.6%) in “severe harm,” with 26 reported deaths. The proportions of falls resulting in some degree of harm varied significantly across the care settings: mental health units (44.5%; 95% CI 43.9 to 45.1), community hospitals (37.0%; 95% CI 36.4 to 37.6) and acute hospitals (33.4%; 95% CI 33.2 to 33.7). Patients aged 85–89 years had a higher-than-expected likelihood of falling relative to bed days. Males accounted for 50.8% (95% CI 50.5 to 51.1) of falls and females 49.2% (95% CI 48.9 to 49.5). (Occupied bed days were 45.5% male and 54.4% female.) The proportion of falls varied considerably with time, with a peak occurring between 10:00 and 11:59.
Discussion: This paper describes the largest retrospective study of hospital falls incidents and draws on data from almost 500 institutions of varying types. It describes wide variations in falls recording and reporting, and in recorded falls rates between institutions of different types and between institutions of ostensibly similar case-mix. As falls are the commonest reported patient safety incident, there is a pressing need for improvements in local reporting, recording and focused analysis of incident data, and for these data to be used at local and national level better to inform and target falls prevention, as well as to explore the reasons for large apparent differences in falls rates between institutions.
Statistics from Altmetric.com
Falls in hospital inpatients are common, with reported rates ranging from 3 to 14 per 1000 bed days in observational and intervention studies.1–3 Such falls generally result synergistically from patient factors and environmental factors and are often a marker of underlying illness or change in functional status, which should prompt further assessment or clinical intervention, rather than simply completion of incident forms.45 Falls in hospital may cause physical injury, anxiety, loss of confidence and impaired rehabilitation.367 Falls are associated with increased length of hospital stay89 and likelihood of discharge to long-term social care settings10 (although the underlying pathology leading to falls may be the causal explanation for this). Falls may also lead to dissatisfaction by patients and relatives, who may feel that such falls should have been prevented in a “place of safety” such as a hospital ward and so to complaints, coroners’ inquests or litigation,11 all of which in turn lead to guilt or anxiety for staff, who are already balancing their responsibility to care for all patients against their responsibility to prevent a smaller number of high-risk patients from falling. Hence, falls are a problem for individual patients, their families and hospital staff, but they are also a major issue in risk management, governance and resource utilisation for hospitals.
Some falls are an inevitable and acceptable consequence of promoting patients’ autonomy and encouraging recovery of mobility after acute illness or surgery. However, many falls are preventable, and a recent major systematic review and meta-analysis1 concluded that there was reasonable evidence of reduction in falls rates in hospitals from multifaceted falls prevention programmes focusing on a variety of individualised and whole systems interventions to minimise the risk of falls and injuries. A key component of such strategies is the use of observational data and incident analysis to inform targeting of falls interventions and to ensure effective organisational learning.
While local clinical incident reporting has been common in hospitals (internationally) for some years, many institutions have done little systematically to analyse or learn from these incidents, or to feed this learning back into practice.1214 Moreover, learning in the UK (or other countries) at national level from analysis of reported falls incidents in hospitals was not possible until recently. The National Patient Safety Agency (NPSA) was established in July 2001 as a statutory body to enhance patient safety for NHS-funded patients in England and Wales and developed the National Reporting and Learning System (NRLS) which is the first national reporting system of its kind in the world, drawing most of its data directly from local reporting system databases. This paper describes a retrospective analysis of 12 months’ data on slips, trips and falls reported to the NRLS, and the implications for the development and targeting of effective falls prevention strategies and future research. This is the largest such observational study of hospital falls incidents described.
This study sought to describe the documented characteristics of reported accidental falls in English and Welsh hospital settings with respect to: frequency (and variability between hospitals specialising in acute care, rehabilitation and mental health); related harm; timing; age and gender of patients who fell; and to draw general lessons from this analysis, which might inform fall-prevention strategies.
METHODS
Overall approach
The NRLS database was searched retrospectively for patient safety incidents reported during the 12 months from 1 September 2005 and 31 August 2006 coded by incident type as “slips, trips and falls.” As the NPSA is a statutory body, and all data were anonymised and aggregated, neither individual patient consent nor ethical approval were required in line with the NHS governance framework3 and Data Protection Act.4 Duplicated reports were removed before analysis. National Hospital Episodes Statistics (HES data)5 were used to assist in calculation of standardised falls rates in those organisations that had reported data consistently for at least 6 months. These organisations fell into three broad categories: “acute hospitals,” “mental health units” and “community hospitals.” (Community hospitals in England and Wales generally have 24-hour qualified nurse staffing but no resident doctor, and tend to specialise in the rehabilitation of older patients.) Each organisation provided inpatient care at one or more hospital sites, with sizes ranging from over 3000 inpatient beds to fewer than 20.
While all reporting hospitals used locally devised reporting formats, categories for service type, incident type, degree of harm and a free text description of the slip, trip or fall were standardised and mandatory. Some hospitals did not record the time of the fall, patient age or gender, resulting in a reduced dataset for these categories. Reporting hospitals used severity categories defined as: “No harm”—no harm to patient; “Low harm”—requiring first aid, minor treatment or extra observation; “Moderate harm”—requiring admission to hospital, surgery or a prolonged stay in hospital; “Severe harm”—permanent harm such as brain damage or disability; “Death”—where death was directly attributable to the fall.
Key word searches of the full dataset combined with scrutiny of the free text description by a nurse reviewer were constructed to identify specific injuries. To identify lacerations, the key words “laceration, cut, skin tear, suture, suturing” were used. To identify fractures, the key words “fracture, broken, #” were used. To identify hip fractures, the key words “hip, femur, NOF, #NOF” were used. Although the size of the dataset meant that reviewing all original reports was not feasible, all reports graded as “deaths” were reviewed and were excluded if the free text gave a clear indication that the patient survived (therefore coding error), that the death was confirmed as unrelated to the fall or where the fall had occurred outside healthcare settings.
The subset of “regularly reporting NHS organisations” was defined as:
those which reported at least monthly between December 2005 and May 2007;
and (if acute trusts) reported at least 100 patient safety incidents (PSIs) monthly
or (if community hospitals or mental health units) reported at least 50 PSIs monthly.
Statistical methods6
The majority of the data are presented descriptively with no tests of statistical significance. However, where samples of data have been reviewed, confidence intervals have been calculated in order to generalise these results to the data set as a whole. In addition, confidence intervals have also been used to facilitate comparisons between groups. This methodological approach is informed with that described by Brennan and Croft18 on the potential problems in attributing tests of statistical significance to purely observational studies. In their guidance, they point out that for such data, the term “statistical significance” should not be used, and p values should not be published. Confidence intervals should be relegated to a small part of both the results and discussion sections as an indication, but no more, of the possible influence of chance imbalance on the result. This is the approach we have taken throughout and is also in line with that advocated and employed by the UK Central Office for National Statistics.19
Falls incidence versus time of day and day of the week was initially examined as a continuous variable. However, a visual examination of the time data demonstrated distinct patterns. Therefore, time was grouped into hourly blocks in order to investigate the structure further, assuming a null hypothesis of even distribution of falls by time of day. Information on bed occupancy(to calculate falls rates per 1000 bed days or to compare gender or age-specific rates versus bed occupancy) was obtained from national Hospital Episode Statistics Data (HES).17
RESULTS
Overall numbers, rates and variability of falls incidents by hospital type
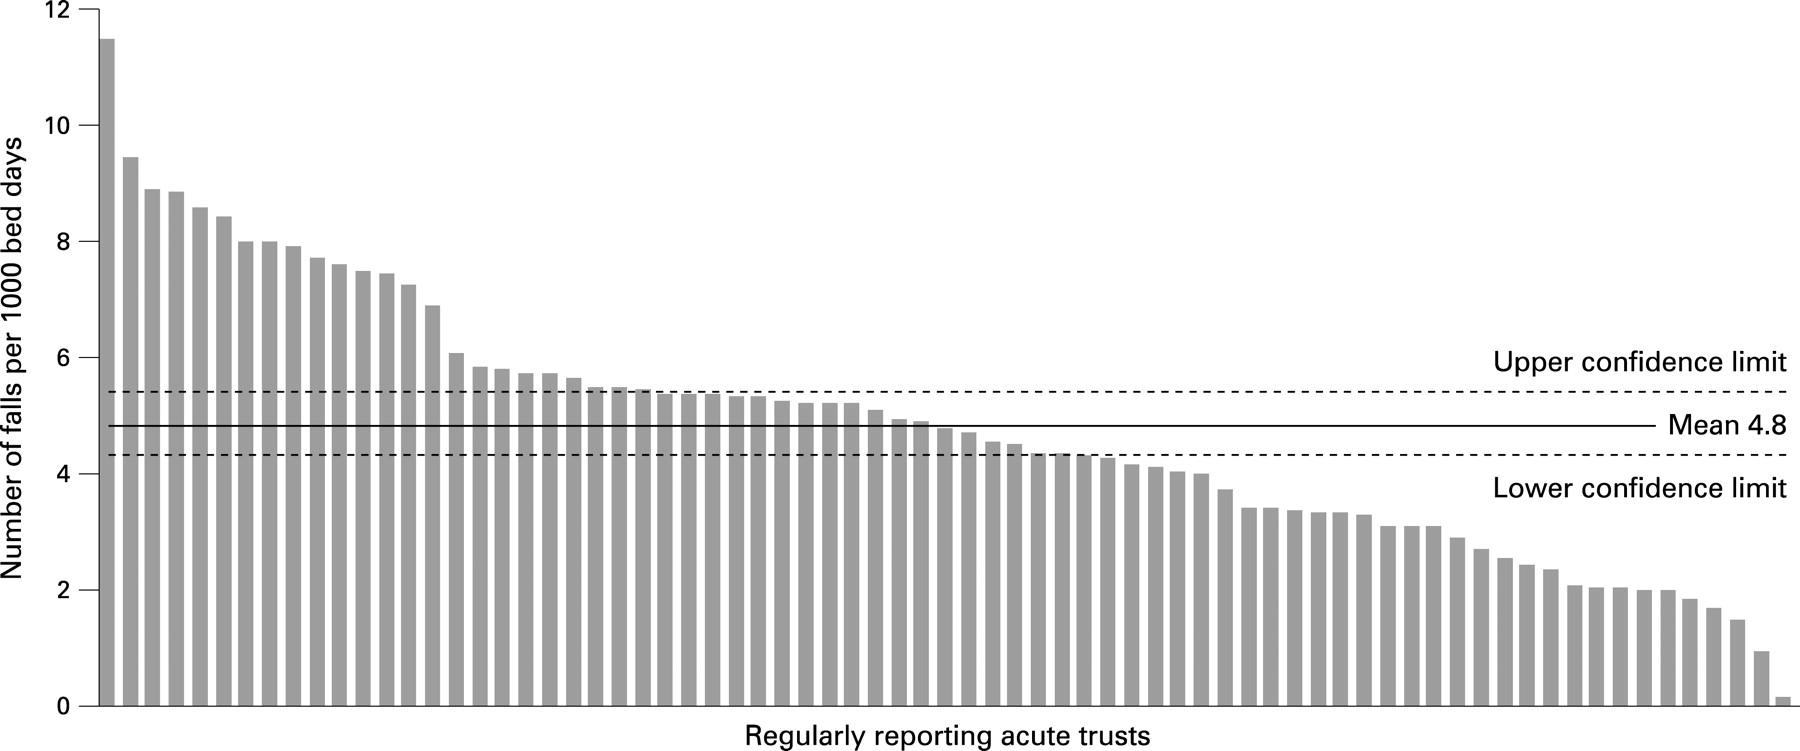
During the 12-month period studied, there were 206 350 reports of falls received from the NRLS from inpatient settings in 472 organisations (representing 98% of the 480 NHS organisations providing inpatient care in England and Wales at that time). This figure accounts for 32.3% of all reported patient safety incidents, making falls the most frequent incident. A total of 152 069 (73.7%) reports were from acute hospitals, 28 198 (13.7%) from community hospitals, and 26 083 (12.6%) from mental health units. Of these, 27 non-falls were excluded from further analysis for reasons outlined in the methods section, leaving a total of 206 323 remaining falls for analysis. In regularly reporting acute hospitals (n = 73), the mean falls rate was 4.8 falls/1000 bed days (range 0.2 to 11.5, 95% CI 4.3 to 5.4) (fig 1). In regularly reporting mental health trusts (n = 16), the mean was 2.1/1000 bed days (range 0.1 to 7.9, 95% CI 1.0 to 3.3) (fig 2), and in regularly reporting community hospitals (n = 13) the mean was 8.4/1000 bed days (range 1.6 to 21.1, 95% CI 4.8 to 12.0) (fig 3). The falls rate in mental health units was significantly lower than the rate in acute hospitals or community hospitals, with no significant difference between acute and community hospitals.


Injuries resulting from falls
After exclusions, 133 417 (64.7%) resulted in no reported harm, 64 144 (31.1%) in “low harm,” 7506 (3.6%) in “moderate harm” and 1230 (0.6%) in “severe harm.” There were 26 recorded deaths resulting from falls (table 1).
The proportion of falls reported as resulting in harm were higher in mental health units at 44.5% (95% CI 43.9% to 45.1%) than in community hospitals at 37.0% (95% CI 36.4% to 37.6%) and acute hospitals 33.4% (95% CI 33.2% to 33.7%). The differences between all three settings were statistically significant.
Keyword searches combined with free text review identified certain types of injury within the broader grouping of low, moderate or severe harm. Keyword searches located 12 714 potential lacerations, and scrutiny of a random sample of 200 of these identified 186 confirmed lacerations leading to an estimated 11 824 lacerations (95% CI 11 265 to 12 181). Keyword searches located 4469 potential hip fractures, and scrutiny of a random sample of 1000 of these identified 118 fractured neck of femur, leading to an estimated 528 fractured neck of femur (95% CI 447 to 626). Key word searches located 1728 other potential fractures, and scrutiny of a random sample of 500 of these identified 128 confirmed fractures, leading to an estimate of 443 other fractures (95% CI 381 to 512).
Age of patients who fell
Based on 108 360 reports (52.5% of total reports) where ages had been reported, 82.6% of falls occurred in patients aged over 65 years and 67.5% in those aged over 75 years; 32.4% were in those aged over 85, even though these patients account for only 14.7% of occupied bed days across NHS hospital trusts. When compared with occupied bed days by age, it is apparent that older people, especially those over 85, are proportionately the most vulnerable group for falls (fig 4).

Gender of patients who fell
Based on 108 420 reports (52.5% of total reports) where gender was recorded, more falls were reported as happening to males (50.8% CI 50.5% to 51.1%) than to females (49.2% CI 48.9% to 49.5%). Males accounted for 51.4% of falls in acute hospitals, 51.5% of falls in mental health units and 47.0% of falls in community hospitals. Contemporaneous HES17 data on bed occupancy by gender have shown that males occupy 45.4% of bed days and females 54.4% across NHS community, acute and mental health hospital trusts.
Time of day when falls occurred
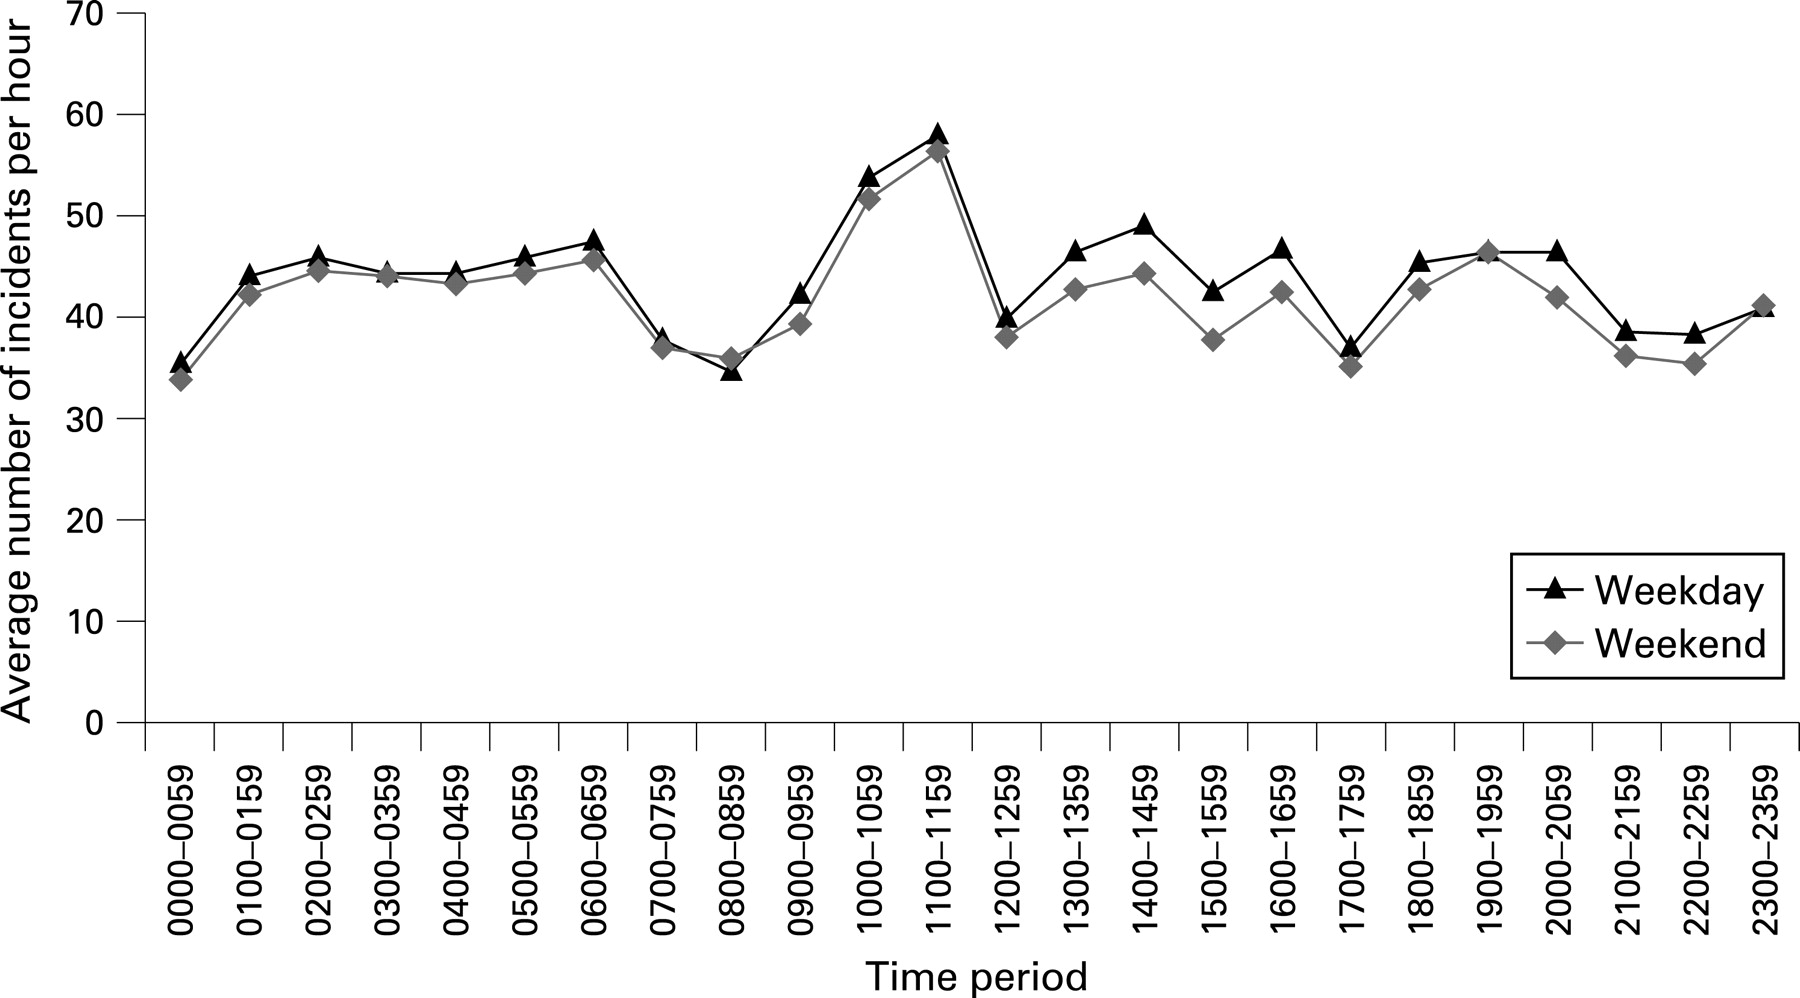
There were significantly higher proportions of falls than expected reported as occurring on a Tuesday (15.2%), and significantly lower proportions than expected reported as occurring on a Sunday (13.4%) (fig 5). There were four time frames where the proportions of falls were significantly lower than expected: 0:00–1:59, 7:00–8:59, 17:00–17:59 and 21:00–22:59. Similarly there were four time frames where the proportion of falls was significantly higher than expected: 6:00–6:59, 10:00–11:59, 13:00–14:59, 19:00–19:59. Of these times, the peak at 10:00–11:59 was significantly higher than the other peaks, and represented the time frame when 11.2% of reported falls occurred. The overall pattern of dips and peaks in the proportion of falls at different times was mimicked across each day.
DISCUSSION
Interpretation of overall findings
Made feasible by the existence of the NPSA and their reporting system, this paper reports the largest retrospective observational study of patient safety incident reports involving accidental falls described to date, making a significant new contribution to the patient safety literature—especially pertinent as falls are the commonest reported safety incident in hospitals. Our data have been drawn from contemporaneous reports by frontline staff in almost 500 organisations representing acute, community and mental health hospitals, enabling comparison between all three types of institution as well as between institutions of similar type.
Mean falls rates in acute and rehabilitation hospitals were similar to published falls rates in observational studies internationally, though there have been relatively few studies in mental health units.2312 (Differences in service configuration are particularly likely to affect reported rates from mental health units, since these organisations differ widely within England and Wales.7) The range of rates in units of all type reported in the literature is as wide as that reported here, dependent as it is on factors such as the case-mix, activity, staffing, philosophy of care, societal culture and physical environment/equipment within those units, all of which may affect the actual falls rate, as well as recording and reporting bias. We know from this report that there is considerable variation in both recording and reporting of falls. This confirms previous work suggesting that falls (especially non-injurious ones) are frequently under-recorded in hospitals and that this applies to patient safety incidents in general.8912 All of this means that we must be cautious in using crude reported falls rates as any indicator of the quality of care, safety or governance in units. Indeed, units which take the problem seriously may be more likely to record and report falls assiduously leading to a spuriously lower apparent fall rate in hospitals less committed to reporting and learning.10
The apparently higher proportions of harm in community hospitals may relate to differences in reporting patterns, or to the generally older age profile of community hospital patients, which make them more vulnerable to injury than the average acute hospital patient. Apparently, higher proportions of harm in mental health units may relate to differences in reporting patterns, or an inpatient population where, although most patients are young and in fairly good physical health, a subset of older patients with cognitive impairment is very vulnerable to wandering and recurrent falls, including impairment of reflexes which might otherwise protect them from injury when falling.11
Our analysis also demonstrates that in hospital settings, vulnerability to falls increases with age to a far greater extent than can be explained by the proportion of hospital beds occupied by older patients. Those aged over 85 years are proportionately the most vulnerable. The study found that the proportion of male patients falling in acute hospitals and community hospitals exceeded the proportion of bed days occupied by males reported in HES12 data. Most reports of falls rates in community and in long-term care settings have shown that falls incidence is higher in females.1314 However, previous studies were generally based on self-reported falls or falls requiring hospital treatment, and falls rates tend not to have been gender-adjusted.6 While females may be more vulnerable to falls due to lower muscle mass and higher incidence of gait and balance problems, it may be that some of females’ apparently greater vulnerability to falls in some studies is in fact an artefact of reporting bias related to their greater risk of osteoporotic fracture.15 In long-term care settings, females account for around 80% of residents and all residents tend to be frail with multiple comorbidities.1617 In hospital, it may be that while an increasing proportion of inpatients are frail, at high risk of falls or have multiple comorbidities,1617 male patients have just enough functional reserve and mobility to make falling a possibility—especially in the presence of coexistent cognitive or behavioural disturbance.18
Falls are more common on weekdays, probably because of levels of activity (eg, investigations, therapies, ward rounds) and bed occupancy, and are most likely to occur between 10.00 and 11.59. This might be due to patient-specific factors such as position, mobility, activities, blood pressure, etc but also to ward-specific factors (eg, nursing activities and numbers, degree of observation, visiting hours). The two are hard to disentangle, and the difference in rate is not so stark as to suppose that additional prevention measures should be targeted at these times.
Although most falls result in no reported harm, or low harm, almost 9000 falls were reported as resulting in moderate or severe harm, including an estimate of almost 1000 fractures, more than half of which were fractured neck of femur. Deaths occurring shortly after the fall and directly attributable to injury from the fall totalled 26, but given known early and late mortality following fractured neck of femur,19 further deaths are likely to have occurred in the weeks and months after the initial report of the fall was made, a suspicion confirmed in a recent Australian study of fractures among inpatients.9
Methodological limitations
These data share the potential reporting bias of all voluntary reporting systems, which is known to include under-reporting of critical incidents including falls20–22 variability in recording rates between institutions and individuals,20 as well as recording errors and missing data within incident reports and a wider problem of recording bias in retrospective observational studies—especially as in this case where the data-recording system was not deliberately designed or supervised with rigorous research in mind (albeit that the purpose of the NRLS is to track and learn from incident reporting). The data also came from a relatively early stage in the establishment of a national reporting system, when although 98% of organisations had reported, regular reporting at monthly intervals was not established in many organisations, with continued improvements in numbers and frequency of reporting seen subsequent to the dataset analysed here. While mandatory fields including setting, severity and free text description were available for 100% of reports, analysis of non-mandatory fields such as age, gender and time could be based only on the proportion of the dataset where these fields were complete (52.5%, 52.5% and 84.5%, respectively). Grading of injury severity was made by front-line staff, who can potentially make errors, and although some corroboration of the nature of injury was made through keyword searches for lacerations and fractures to correct for this, this methodology relies on subsamples of the data, although the confidence intervals applying to the estimates are generally less than ±5%, suggesting that the projections to the whole dataset are relatively reliable.
Given that even the most successful and methodologically robust falls intervention trials in the peer-reviewed literature only produce moderate reductions in falls rates, (as high as 40% but with a pooled effect of 18%) and have never been shown significantly to reduce rates of injuries or number of people who fall,1 the large variability in incident rates between institutions of similar types suggest there are substantial differences in policy or practice related to the reporting of patient falls. Despite this, the number of falls in this analysis and the number of hospitals supplying data are likely to minimise variation between confounders and provide useful summary data. Reporting from all NHS hospitals in England and Wales to the NRLS was only established in January 2005; as a culture of patient safety becomes embedded, there is likely to be greater consistency of reporting between organisations, and more complete capture of data.
Future research questions
This analysis has identified a number of issues for further research. These include questions on recording and reporting variability bias and the reasons for it, and how it can be improved. Second, even allowing for recording bias and inaccuracy, there are interesting differences in the rates of falls and injuries, and timing of falls, whose mechanisms require further exploration, including the higher apparent rate of inpatient falls among men and in community hospitals, and the large variations in falls rates between institutions of similar type. Understanding the mechanisms for these differences might help in better design of effective falls interventions. It would also be interesting to see the effect of detailed learning from incident analysis on falls-prevention trials in the design and targeting of the falls intervention and on the effect of regular local learning from analysis of incident reports and targeting of high-risk times, areas, activities and patient groups. It would also be useful to correlate falls incidents with the patient’s length of admission as there might be especially high-risk periods for falls. As data do not identify individuals, we do not know what percentage of falls occur in patients who have already fallen once. It may be that interventions required for “recurrent fallers” or for “secondary falls prevention” are different from those for “single fallers” and “primary falls prevention,” and the current data do not allow us to describe the overall contribution to falls rate of these two groups.
Implications for practice
Appreciating the scale of the problem of falls, and the human and organisational costs, should inspire healthcare organisations to renew their efforts on falls prevention. National analysis can help healthcare organisations target their falls-prevention strategies to the patients who are most vulnerable, and to the times when falls are most likely to occur. To help with this process, the data described in this paper have been provided to NHS organisations in England and Wales in a detailed report13 that also includes additional thematic analysis of circumstances of falls and contributing factors, estimates national and local costs of treating falls-related injuries, summarises a recently published systematic literature review of falls prevention in hospital settings1 and provides good practice examples and links to further resources. Further improvement needs to take place in the consistency, accuracy and completeness of reports of falls, to provide better data for future analysis at local and national level.
This report provides a framework and a methodology that can be employed by individual organisations in learning from their own falls incident reports and should prompt hospitals to aim for more consistent and complete reporting of falls data. When we consider that falls are the commonest patient safety incident in hospitals throughout the NHS and that their human and organisational costs are so high, this must be a much greater priority in risk management and governance.
REFERENCES
Footnotes
Competing interests: None.
Linked Articles
- Quality lines