Article Text

Abstract
Background and objective: The impact of clinical guidelines (GL) on venous thromboembolism (VTE) prophylaxis was evaluated in a large Italian hospital with a before/after study. GL were effective in increasing the appropriateness of prophylaxis and in reducing VTE. Following this study, the aim was to estimate the impact of the adopted GL on costs and benefits through a cost-effectiveness analysis.
Methods: A decision-tree model was used to compare prophylaxis costs and effects before and after GL implementation. All patients were classified into four risk profiles (low, moderate, high, very high). Outcomes considered were: no event, asymptomatic VTE, symptomatic VTE, fatal pulmonary embolism and major bleeding. Patient risks and the probability of receiving prophylaxis were defined using data from the previous study. Outcome probabilities were derived from the literature. Regional Drg reimbursements and hospital figures were used for costing the events.
Results: Despite a marked increase in the number of patients receiving some form of prophylaxis, it was estimated that the introduction of GL reduced the average cost per patient related to VTE from €210 to €181 (−14%), with a parallel absolute decrease in VTE complications (−5%). Results are particularly relevant in the very-high-risk group. Sensitivity analysis confirmed the overall cost savings and gains in effectiveness.
Conclusions: The implementation of locally adapted GL on VTE prophylaxis may lead to a benefit in terms of both costs and effects, especially for the highest-risk patients.
Statistics from Altmetric.com
The introduction of clinical guidelines (GL) for changing current practice is often accompanied by uncertainties about the economic impact that only a formal evaluation could reduce.1 Even if GL are expected to rationalise practice by introducing clinical procedures that have been shown to be cost-effective, a discrepancy between recommendations and clinical behaviour can strongly affect the real impact on costs and benefits. In some circumstances, GL may directly increase healthcare costs if previously underused procedures are recommended.
These considerations can be applied to the problem of venous thromboembolism (VTE), a major complication in hospitalised patients.2–4 In experimental settings, prevention of VTE by appropriate prophylaxis has been shown to be cost-effective in reducing treatment requirements and reducing the length of hospital stays.56 Even if a number of GL were produced to improve the appropriate use of thromboprophylaxis,78 application of the GL generally has been reported as suboptimal,9–14 as confirmed by a recent international survey.15 The underuse of GL may affect efficacy as well as the efficiency of prophylaxis procedures, though to our knowledge, a formal evaluation of cost-effectiveness has not been thoroughly performed in published studies.
A before-and-after controlled study had been conducted within the TRiPSS-2 project in the San Giovanni Battista Hospital, a large teaching hospital in Turin.16 The study evaluated the impact of locally adapted GL on VTE prophylaxis, using both process and outcome measures. The medical charts of two random sets of patients (250 patients each), discharged in the first half of 2000 and 2002, were analysed. The hospital incidence of VTE in the period 1996–2004 was also monitored through the discharge abstracts. Results showed that GL were effective in increasing the appropriateness of prophylaxis and in reducing VTE, even though some undesirable effects were also documented, such as an increase in prophylaxis in low-risk patients.
Following this clinical audit, our aim was to perform a cost-effectiveness analysis comparing the periods before and after implementation of the GL, to estimate the impact of the adopted GL on costs and benefits at the hospital level, taking into account possible complications and adverse effects.
METHODS
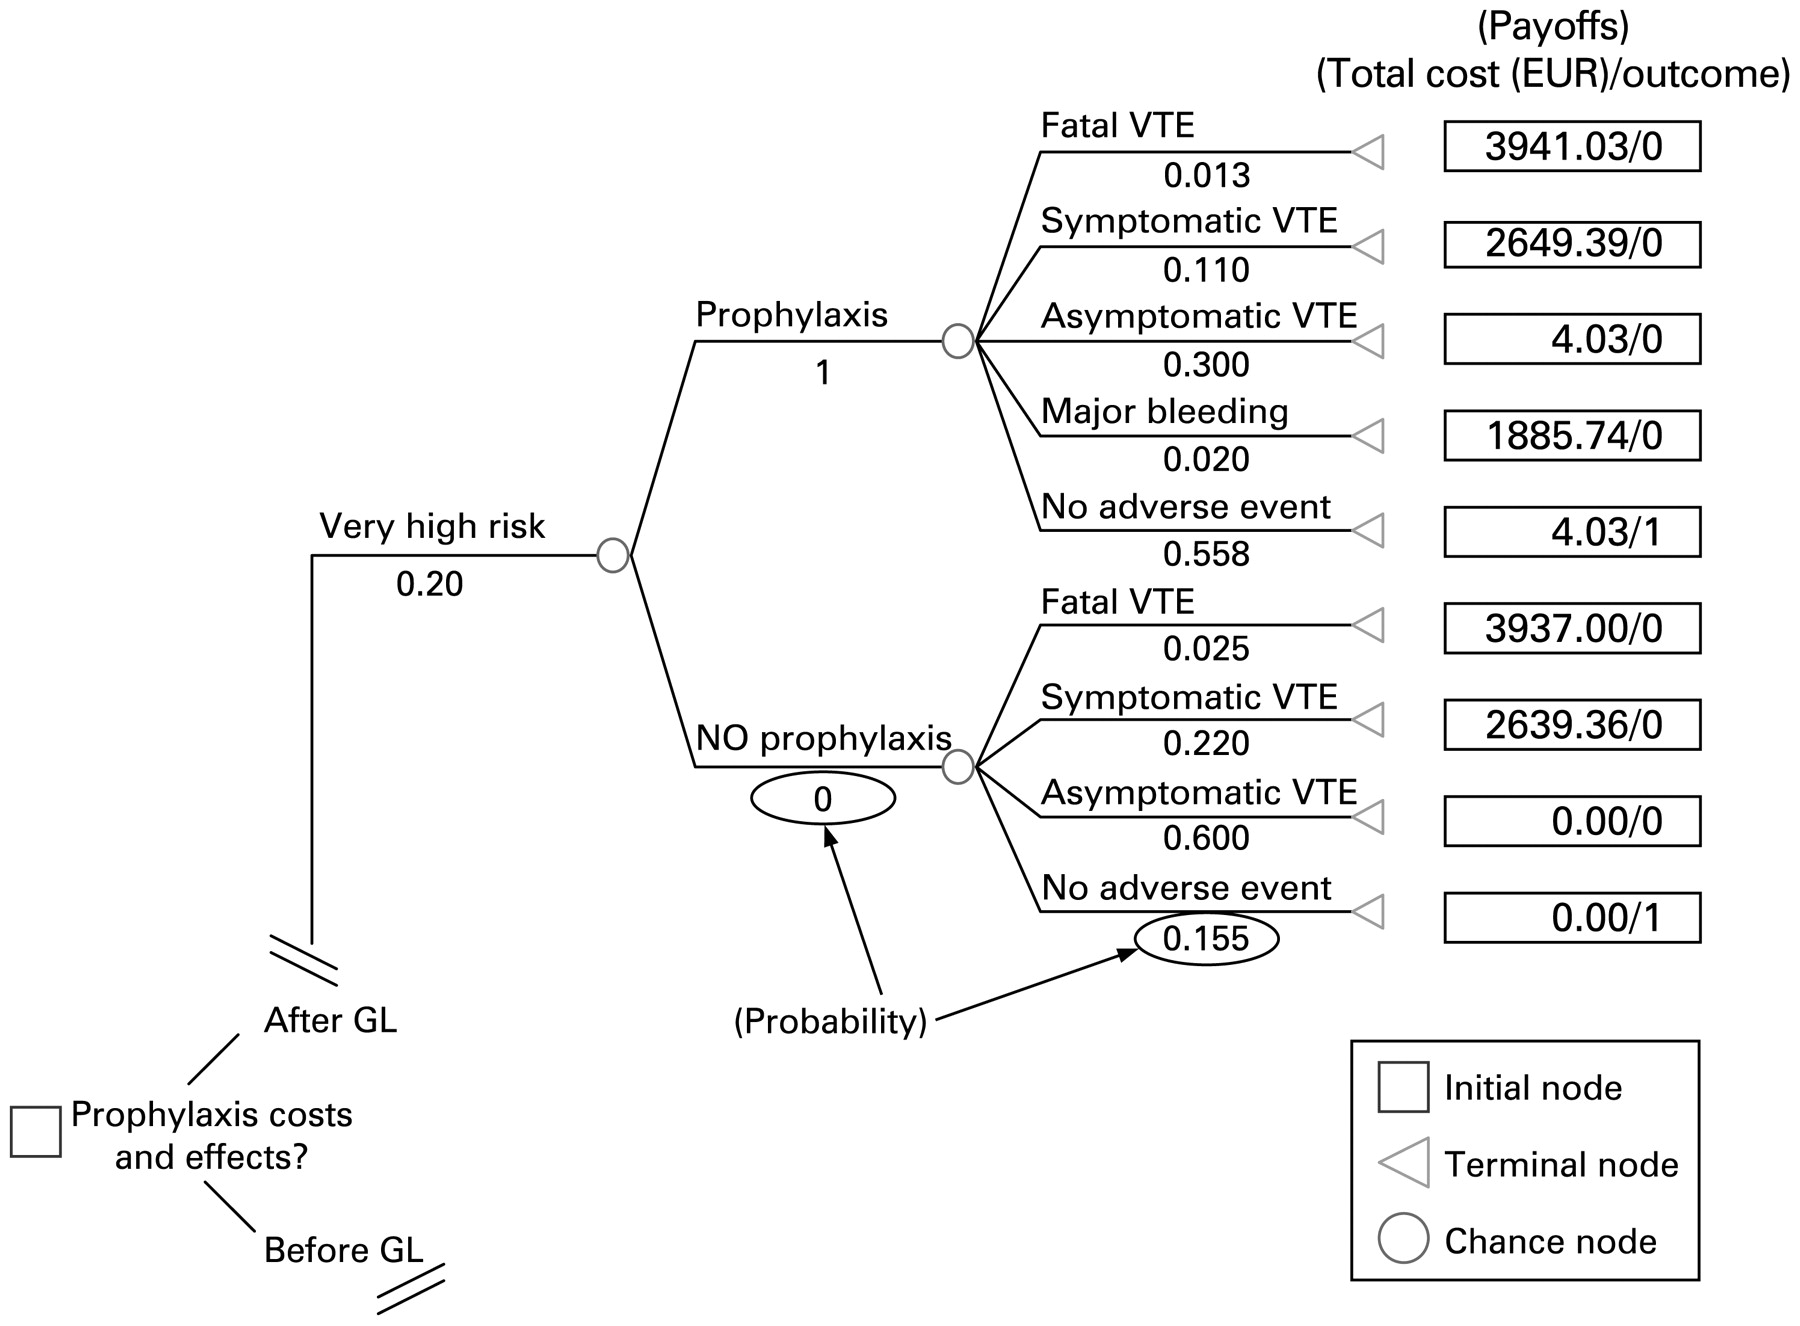
We built a decision-tree model17 to compare the costs of prophylaxis and the effects before and after GL implementation for hospitalised surgical patients. Four VTE risk profiles were identified (low, moderate, high, very high) and each was associated with a different probability of undergoing prophylaxis. Possible outcomes were: no event, asymptomatic deep vein thrombosis (DVT), symptomatic VTE, fatal pulmonary embolism (PE) and major bleeding due to prophylaxis. As an example, fig 1 shows one segment of the decision tree for the “after GL implementation” period—“very-high-risk” profile. The same structure was reproduced for all risk profiles in this period and for the “before GL” period.
Decision-tree structure (“after clinical guidelines (GL) implementation” period, very-high-risk profile). VTE, venous thromboembolism.
Each intermediate action or outcome is assigned a probability of occurrence: the sum of probabilities assigned to the possible events emanating from one chance node is equal to 1. In our model, we derived the prevalence of patients in each risk profile and their probability of receiving prophylaxis from the previous audit; outcome probabilities (point estimates and corresponding ranges) were derived from the literature (see table 1 for details).
Each outcome is also assigned a payoff (eg, total cost or effectiveness), which represents the net value corresponding to the specific path (ie, the sequence of events leading up to that outcome). In our model, the total cost included the cost of prophylaxis and the cost of events. With respect to effectiveness, we considered the number of event-free patients to be the measure of effectiveness by assigning 1 to the outcome “no event” and 0 to all other outcomes (see table 1 for details).
The calculation process moves from right (terminal nodes, corresponding to the outcomes) to left (initial node): each payoff (total cost or effectiveness, alternatively) is multiplied by the probability of the corresponding branch, and then added to the same value obtained for the opposite branch (emanating from the same node), thus producing the expected value of the chance node considered (ie, the weighted average net value for each chance node). This process is iterated moving backward to the initial node, at which point we can compare the expected values calculated for the two periods (before GL and after GL) and identify which period allows for the best result (eg, the lower cost or the higher effectiveness).
Looking at the partial representation of our model in fig 1, the calculation process starts from the terminal node “Fatal VTE.” Focusing on the payoff “total cost,” we first multiply the payoff value (€3941.03) for the corresponding probability (0.013). The same is repeated for the other branches emanating from the same node (the node “Prophylaxis,” in this case) resulting in the expected value of the node: [(3941.03×0.013)+(2643.39×0.110)+(4.03×0.300)+(1885.74×0.020)+(4.03×0.558)] = €383.18. This value is then multiplied by the probability of the node “Prophylaxis” (in this case, equal to 1, as all patients in this group received a prophylaxis) and the result is added to the value obtained through a similar calculation process for the opposite branch “No prophylaxis” (in this case, this value will be equal to 0 because of the null probability associated with this node). Thus, the expected value for the “Very high risk” branch will correspond to: (383.18×0.200) = €76.64. This value will then be added to those deriving from the same calculation process made for the other risk profiles, thus giving the final expected value for the option “After GL.” The same process is to be reproduced for the period “Before GL,” in order to compare results between the two periods.
All the parameters used to implement our model are summarised in table 1.
Outcomes and their probabilities
We referred to asymptomatic DVT as the occurrence of disease that remains silent for an undetermined period. We consider asymptomatic DVT in order to take into account the consequences in terms of effectiveness (even if the disease progression is unclear) that might occur after patient discharge and that, at the moment of hospitalisation, are not resource-consuming. In order to distinguish between symptomatic and asymptomatic VTE, we assumed (according to Geerts et al) that about 80% of total DVT remains asymptomatic,8 so the rate of symptomatic VTE is given by adding 20% of the rate of total DVT to the rate of clinical PE (by using rates from Geerts et al). Based on the existing literature,78 we assumed that the appropriate use of prophylaxis reduces VTE risk, on average, by 50%. With respect to major bleeding risks, we considered the same occurrence probability for all patients receiving prophylaxis, using data reported by Muntz et al.19
Costs
The cost of pharmacological prophylaxis was assumed to be equal to the cost of low-molecular-weight heparin, the standard method of prophylaxis in our hospital. We assumed heparin to be administered within the ordinary daily nursing care of patients, without requiring other expenses or time-consuming resources.
Hospital data from pharmaceutical consumption reports showed that the use of elastic stockings clearly increased after GL implementation.16 As data were not available on the patient level, we considered that stocking consumption increased from 4% to 25% of surgical patients receiving prophylaxis. In this model, we prudently added 25% of the cost (one pair of stockings) to each patient receiving prophylaxis in the “after GL implementation” branch.
For the cost of symptomatic VTE events, we used both DVT (Drg 128) and PE reimbursement (Drg 78), weighted 9:1 according to the proportion of DVT:PE reported in the literature.8 We did not consider any costs referred to asymptomatic VTE, as the consequences are unknown at patient discharge and cannot influence clinical behaviour.20
With respect to the cost of major bleeding due to prophylaxis, we considered that 80% of cases would require surgical reintervention, while the remaining 20% would be treated medically.19 We then applied this proportion for weighting the cost of surgical management (Drg 443) and the cost of medical management (Drg 453) of a major bleeding episode.
Analysis
We performed a cost-effectiveness analysis by using a decision-tree model structured as described above. The hospital viewpoint and the time horizon of the hospitalisation were assumed for the analyses. We then conducted a sensitivity analysis by using the upper and lower limits of the ranges indicated in table 1 for the rate of VTE events.
We also simulated an “optimal” scenario, assigning theoretical rates of prophylaxis according to optimal adherence to GL. In this case we assumed that:
all patients at very high, high and moderate risk and no patients at low risk received prophylaxis;
one pair of elastic stockings was used for each patient at highest risk (in combination with heparin) and for 25% of patients at moderate risk (as an alternative to heparin).
Further analysis concerning the main and alternative scenarios has also been performed by varying the rate of major bleeding episodes between the extreme values of the range indicated in table 1.
We used the software TreeAge Pro 2005 to build and analyse the decision-tree model.21
No ethical approval was necessary for this analysis.
RESULTS
Table 2 shows the expected values in terms of costs and the proportion of event-free patients, broken down by patient-specific risk groups, comparing the periods before and after GL implementation. The results (columns 1–6) show that the introduction of GL reduced the average cost per patient from about €210 to 181 (−14%), leading to a 5% gain in event-free patients. The differences in results are the most marked for the very-high-risk group. In this patient subset, GL led to a 25% cost reduction (from about €511 to 381) and an 18% gain in event-free patients. In contrast, the results are not favourable for the low-risk group; introduction of GL did not modify the outcome and produced a 54% increase in costs (from about €25 to 39).
An additional sensitivity analysis was conducted by varying the rate of major bleeding episodes for all scenarios considered. This analysis indicated that the overall reduction in costs may vary from 2% to 18%, and the overall absolute increase in event-free patients may vary from 2% to 6% (data not reported in tables).
Results for the “optimal” scenario (columns 7–10) indicate that, if GL recommendations were strictly adhered to, there would be a further reduction in costs that would include the low-risk group.
Tables 3, 4 show the results of a sensitivity analysis that considers extreme values in the rate of VTE events. The use of upper limits (table 3) leads to larger differences both in costs (−15%, from about €274 to 232) and in effects (+6%). The “optimal” scenario (columns 7–10) would give better results in cost reductions, even for the lower-risk patients.
When the lower limits are used (table 4), the overall reduction in costs is 9% (from about €136 to €124), whereas the corresponding gain in event-free patients is 3%. Still, the “optimal” GL implementation (columns 7–10) would lead to cost reductions even in low-risk patients.
DISCUSSION
Although appropriate prophylaxis has been shown to be effective in reducing VTE in hospitalised patients, and several strategies of implementation have been discussed,1222 the application of clinical GL aiming at implementing the most appropriate behaviours has been suboptimal. In fact, a number of studies documented that a relevant proportion of patients at risk did not receive adequate prevention.9–15
A recent study in our hospital showed that, after the introduction of locally adapted GL, the number of patients undergoing prophylaxis (including some at low risk) was largely increased.16 The main strategies used to implement GL recommendations were:
involvement of professionals from all specialties in the GL development working group; one of the main tasks of the working group was to identify possible barriers to the adoption of GL;
presentation of GL during a meeting held by a clinical opinion leader with recognised expertise in VTE prophylaxis;
distribution of a pocket version of GL containing easy to use tables for VTE prophylaxis to all clinicians;
production of specific reminders, indicating individual and procedure-related risk factors with corresponding appropriate prophylaxis, sent to all departments to be attached to patients’ clinical charts.
For a better understanding of the clinical and economic consequences of the actual adherence to GL recommendations, we estimated the impact of GL introduction on overall costs and benefits at the hospital level.
The cost-effectiveness analysis of the decision-tree model estimated that the main impact of the GL on VTE prophylaxis was an overall reduction in total costs and an increase in event-free patients. These results do not seem to be sensitive to variations in the parameters, as shown by the use of alternative scenarios. For the low-risk patient group, we found a slight cost increase due to an inappropriate use of prophylaxis not supported by GL recommendations. An optimal GL implementation would lead to increased cost savings.
In our analysis, we only considered the length of patient hospitalisation, referring to possible adverse events during the hospital stay. The inclusion in the model of an extended follow-up period (6 months to 1 year) would allow further VTE events to be collected for patients who were asymptomatic at discharge, adding consistency to our results.
Due to the need for a large group of patients in order to observe some of the complications considered in our analysis, we took data from different sources to assign values to model parameters. In particular, we needed to use data from the literature to estimate the risks of VTE and of major bleeding episodes in hospitalised patients.
The measure of effectiveness we used (number of event-free patients) considered as “failure” those cases in which at least one of the possible adverse outcomes occurred. In this way, we attributed the same weight to all adverse events (VTE events and major bleeding complications). Alternative methods could also be used—for example, a distinction between fatal and non-fatal events. However, as we were interested in studying all adverse consequences of care practice on patient safety, we preferred not to discriminate between adverse outcomes on the basis of severity.
One limitation to our study was the lack of individual data about the use of elastic stockings as an alternative to (when the bleeding risk is high or there are strong contraindications to heparins) or in combination with heparins (for highest VTE-risk patients). In general, hospital data on pharmaceutical consumption showed that the use of elastic stockings increased seven- to eightfold after GL implementation.16 In order to take this marked increase into account, we prudently applied a corresponding proportion of the cost of stockings to each patient who received heparin for prophylaxis after GL implementation. Finally, we did not perform a probabilistic sensitivity analysis, despite the fact that it is a strong statistical technique, as we think that our analysis sufficiently considered possible variations in the results.
Despite the limits mentioned above, we believe that our analysis, based on a decision-tree model, allowed for a reasonable estimate of the clinical and economic impact of the introduction of VTE prophylaxis guidelines in our hospital. This study represents one of the few evaluations of GL impact, not only on the appropriateness of care, but also in terms of clinical benefits, side effects and costs.
In conclusion, locally adapted VTE prophylaxis guidelines may lead to gains in terms of cost savings and reduction in adverse events, but a suboptimal adherence to clinical recommendations could affect the potential benefits. The implementation process should be strictly monitored, collecting data at the individual level, in order to rapidly identify negative effects, such as a generalised increase in routine prophylaxis.
REFERENCES
Footnotes
Funding: The study was partially supported by the Compagnia San Paolo/FIRMS, within the project “Economic evaluation and quality assessment in clinical epidemiology,” and by a Regional Health Service grant.
Competing interests: None.