Article Text

Abstract
Background: Patient safety is recognised worldwide as a major healthcare issue. The US Agency for Healthcare Research and Quality developed a series of evidence-based Patient Safety Indicators for use with hospital administrative data, but to date these have not been translated for use in the UK. They measure harm due to treatment and include infections, obstetric tears and foreign bodies left in the patient following surgery. We aimed to apply 10 of the AHRQ indicators for use in English routine hospital admissions data as the first step in validation, and describe their rates in relation to established measures of negative outcome such as mortality.
Methods: Translation of US coding systems into England systems using look-up files and clinical coding advice. Descriptive analysis of rates, length of stay, mortality and emergency readmission. Qualitative feedback from hospitals on their rates and level of interest in the indicators.
Results: The translation presented a number of challenges, particularly regarding the lack of direct correspondence between the two procedure coding systems. There were a total of 35 918 potential adverse events among the nine successfully translated indicators in England in the financial year 2005/6, with wide variation between hospital trusts. Potential adverse events were usually associated with higher mortality and unplanned readmission rates and longer length of stay. Postoperative sepsis, for example, had a rate of 4.2 per 1000 admissions and was associated with a median length of stay of 19 days compared with 6 days for admissions for operations without sepsis recorded, and was associated with a mortality of 14.7% compared with 0.5%.
Conclusions: These indicators have potential for use in tracking progress in harm-reducing programmes, but prospective evaluation of data quality and coding practices is required to fully assess their utility.
Statistics from Altmetric.com
Patient safety is recognised worldwide as a major healthcare issue. A study in the UK suggested that about 6% of hospitalised patients had an adverse event that was judged to be preventable with ordinary standards of care.1 The Institute for Healthcare Improvement estimates that 15 million incidents of medical harm occur in US hospitals each year.2 The World Health Organization launched the World Alliance for Patient Safety in 2004 to facilitate the development of patient safety policy and practice in member states.3 In the UK, the Safer Patients Initiative, now operating in 20 hospitals in its second phase that began in 2006, is run by the Health Foundation with a programme designed by the US-based Institute for Healthcare Improvement, and covers five clinical areas, teaching methods for quality and a specific role for senior management.4 One of its first tasks was to build data-collection systems for quality-improvement purposes rather than what is required for government inspection, and measurement of patient safety is the first step.
There are a number of different and potentially complementary ways to measure adverse events in hospital, such as voluntary reporting (an example of which being the National Patient Safety Agency’s National Reporting and Learning System; see http://www.npsa.nhs.uk/patientsafety/reporting) and chart review. The use of administrative data to identify complications was first systematically reviewed by Iezzoni et al56 who reported on the US Complications Screening Program that relied on ICD9 codes to identify potentially preventable in-hospital complications. Despite their relatively poor sensitivity compared with record review, administrative data have been recommended by various groups as an inexpensive method of screening for potential problems with less bias and greater specificity7 than other methods.89 The US Agency for Healthcare Research and Quality (AHRQ) therefore developed a set of Patient Safety Indicators, which are evidence-based measures of patient safety designed for use in administrative databases.10 Their development was based on the Institute of Medicine’s definition of patient safety—“freedom from accidental injury due to medical care, or medical errors.” Rivard et al11 discuss their potential for assisting organisational learning at the system level and conclude that their simplicity and reliability make them valuable as a higher-level safety performance measure. The Organization for Economic Cooperation and Development Quality Indicator Project has developed an initial set of patient safety indicators and embraced many of the AHRQ ones.12
We chose the AHRQ indicators on account of their evidence base and their design for use with administrative data, and translated them into the coding systems used in England. We first describe the coding issues and present a descriptive analysis of overall indicator rates and how they relate to three more established measures related to quality and safety of healthcare: in-hospital mortality, unplanned readmission rate within 28 days, and length of stay.13 A tailored report was sent to all National Health Service (NHS) hospital trusts (a trust can comprise several hospitals) in England, giving their figures for 1 year and inviting informal feedback on their level of interest in these indicators and their own rates. We give a qualitative summary of the hospitals’ views and conclude with a discussion of the issues, including our next planned steps to validate and improve the indicators for use in the NHS.
METHODS
Hospital Episode Statistics14 data comprise records of every hospital admission in the English NHS and their collection and central submission are mandatory. Each row comprises a “consultant episode,” which covers the period of time during which a patient is continuously under the care of a given consultant specialist. An admission may consist of several such episodes, and the episodes with matching hospital, patient details and dates were linked into admissions; admissions ending in a transfer to another hospital were also linked together. Each episode contains one primary and 13 secondary diagnosis fields plus 12 procedure fields.
The AHRQ technical specifications for the indicators are available at their website (http://www.qualityindicators.ahrq.gov/psi_overview.htm). There are 20 indicators for use at hospital level, but for this project we translated the 10 that appeared easiest to translate and of most clinical interest. However, we dropped iatrogenic pneumothorax from the list because although ICD9CM (the clinical modification version of ICD9) has a specific code for this condition, ICD10 has no equivalent.
Each indicator consists of a set of diagnosis, procedure and/or other codes in the numerator and in the denominator, each taking account of a list of codes or conditions that exclude a given record from both numerator and denominator. Each admission was given a flag for each indicator to show whether it counted in the denominator and a flag to show whether it also counted in the numerator. Many records were in the denominator of more than one indicator, and some were even in the numerator of more than one.
The AHRQ indicators were specified using the ninth revision of the International Classification of Diseases (ICD9) for both diagnoses and procedures, whereas English admissions data use ICD10 for diagnoses and OPCS4 for procedures (the latter is unique to the UK). Another difference is the use of Diagnosis-Related Groups (DRGs) in the USA, which are based on the diagnosis, and Healthcare Resource Groups (HRGs) in the UK, which are based on either the diagnosis or procedure. We translated ICD9 to ICD10 diagnosis codes using a look-up file from the National Centre for Classification in Health in Australia available on the internet.15 Translation of the ICD9 procedure codes into OPCS4 codes was performed by a trained clinical coder. Many indicators included a long list of all surgical and all medical DRGs in the denominator. Instead of trying to find an equivalent HRG for each DRG, we made use of the fact that only a small number of DRGs (those relating to the perinatal period) were not on the AHRQ list of medical or surgical DRGs; once we had identified the equivalent perinatal HRGs, we took the remainder to be the list of surgical and medical HRGs. Surgical HRGs were defined by inspecting their descriptions and choosing all those that included the word “procedure” or that clearly denoted operations. Several indicators required the definition of operating room procedures (this was used as an exclusion criterion). As this is a long list, we devised a (much shorter) list of non-operating room procedures instead by an inspection of their description with assistance from the clinical coder. Table 1 shows the elements of the indicators that required translation. The AHRQ PSI software was not used.
AHRQ suggests that many of the indicators be risk-adjusted,16 as older patients, for example, are more prone to infection than younger patients, and they specify that this should be done by age, sex, DRG and comorbidity. In practice, however, there were too few cases in many age–sex-comorbidity strata (if HRG was used in place of DRG) for robust adjustment, and we limited the adjustment to using 5-year age band and sex (age alone was used for the two obstetric indicators requiring adjustment). Table 2 describes the nine indicators with their principal coding issues.
For each indicator, rates of death and unplanned readmission within 28 days were calculated for records matching the denominator criteria, dividing records into two groups according to whether they also matched the numerator criteria. The length of stay was also summarised for the two groups, calculated as the difference in days between the date of discharge and the date of admission: a length of stay of zero days means that the patient was admitted and discharged on the same day (outpatients are covered by a different dataset in England). We wanted to find out if the PSIs, which try to measure patient harm, were associated with established negative outcome measures.
We wanted to determine whether NHS hospitals would be interested in these indicators and how they would want the figures presented. Indicator rates were calculated for each NHS hospital trust (a trust can comprise several hospitals, but data were aggregate to trust level) and are given for the financial year 2005/6. Primary Care Trusts acting as providers (typically for community and mental health services) were excluded. Each NHS trust was sent a report, giving their raw and adjusted rates of each indicator compared with the national figures, by Dr Foster Intelligence, an independent healthcare information company. The trust’s position relative to all the other trusts for each indicator was shown on a funnel plot (see Results) with 95% and 99.8% control limits.17 Also included in the report was a description of the methods and our indicator specifications using ICD10 and OPCS4, as well as the original AHRQ specification file using ICD9. Our specifications may be found at http://www1.imperial.ac.uk/medicine/about/divisions/ephpc/pcsm/research/drfosters/. We invited trusts to give their opinions on the figures and the way in which they were presented, the codes used and the potential utility of the indicators for driving improvements in patient safety.
RESULTS
There were 13 974 949 admissions in total for 2005/6. For the nine indicators, a total of 35 918 potential adverse events were recorded.
Admissions with a potential adverse event recorded (“flagged” records) had a higher crude mortality and unplanned readmission rates and longer lengths of stay than denominator-only (“not flagged”) admissions, shown in the right-hand columns of table 3. Perhaps the most striking differences in in-hospital mortality between flagged and non-flagged records were for decubitus ulcer (with a rate ratio of 33.0/8.2 or approximately 5), postoperative hip fracture (rate ratio of nearly 40) and sepsis (rate ratio of nearly 30—all statistically significant using χ2 tests). The most striking absolute difference in median LOS was for decubitus ulcer (25−10 = 15 days) with similar values for selected infections due to medical care, postoperative hip fracture and postoperative sepsis (all statistically significant using Mann–Whitney tests).
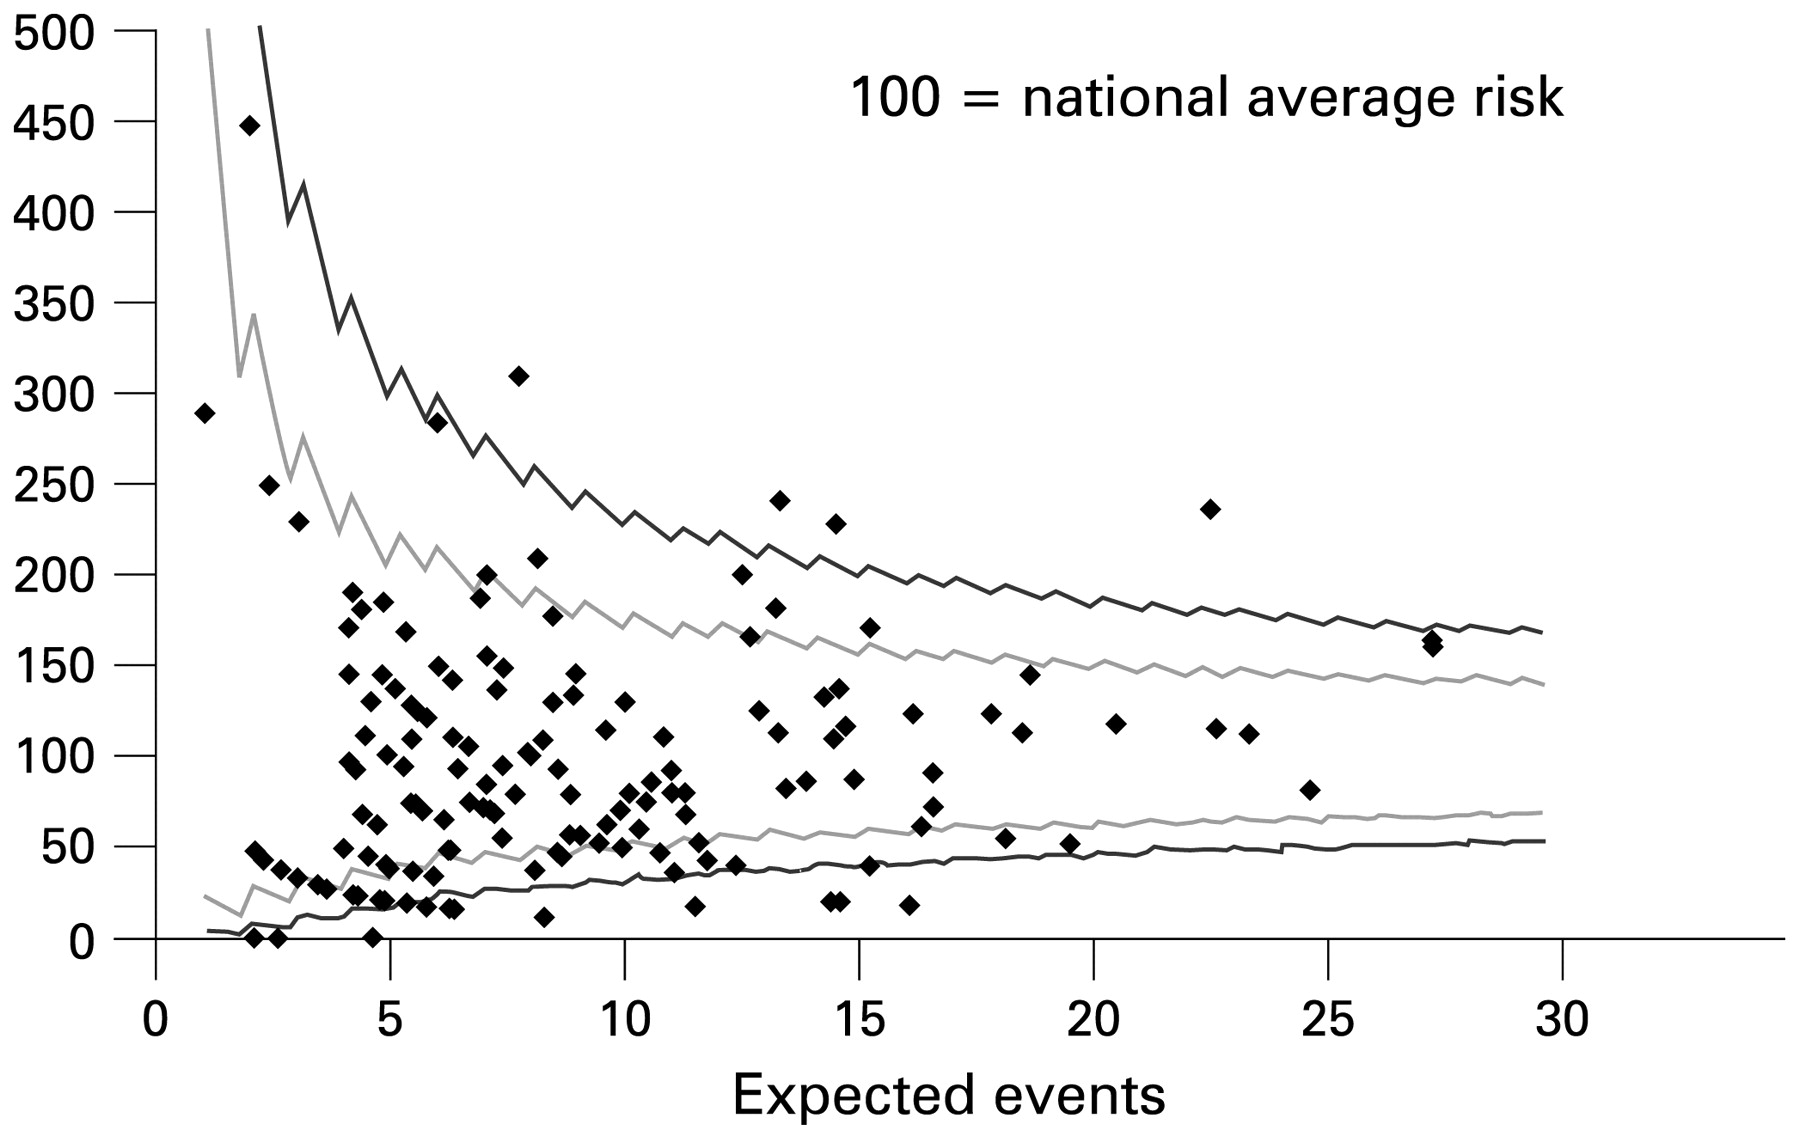
There was a wide variation between trusts for all indicators, even after adjusting for age and sex where indicated. As an example, chosen because the distribution of values allows clear viewing of points, fig 1 is a funnel plot of observed-to-expected ratios for acute trusts (those offering emergency hospital services) for postoperative sepsis, with the expected counts adjusted by age and sex and exact control limits (95% and 99.8%) derived from the Poisson distribution. By chance, 5% of points are expected to lie either above the upper or below the lower 95% control limit, whereas just 0.2% are expected to lie either above the upper (top line) or below the lower (bottom line) 99.8% control limit. The solid central black line represents the national average, which will equal 1 for observed-to-expected ratios. Of 153 acute trusts, 14 fell below the lower 99.8% control limit, with just four above the upper 99.8% control limit. By chance, at most only two trusts are expected to lie above the top line and at most two below the bottom line; the plot shows that there is more than just random variation between trust rates for this indicator. Three trusts had no recorded postoperative sepses and hence had a zero ratio.
Funnel plot of age- and sex-adjusted relative risks (observed/expected) for postoperative sepsis for acute trusts, with 95% and 99.8% control limits.
Qualitative feedback from trusts on their reports
Out of 170 trusts sent data, 36 (21%) responded with questions or comments. Trusts were generally positive about receiving the reports and about the presentation of the information in the form of funnel plots. Although they believed that this was potentially very useful, the commonest responses fell into four main areas: accuracy of secondary diagnosis fields, both at their own trust and at other trusts; concern from those with high rates about how they would be perceived if the data were published; belief that further case-mix adjustment was needed; and concerns about the choice of codes used. Some carried out a case-note audit (chart review) and reported that this gave a lower rate than the admissions data: we did not receive reports of case-note audits that gave higher rates. There were only a small number of queries concerning the codes used, such as for sepsis and obstetric tear repair. One trust expressed grave doubts about using routine admissions data for decubitus ulcer because of the variation in ulcer severity and definition, which cannot be captured using ICD.
DISCUSSION
We found 35 918 numerator events for the nine indicators in total in England in 2005/6 and wide variations between hospitals. Compared with denominator-only admissions, numerator records were associated with a higher mortality, greater risk of unplanned readmission and longer length of stay. Twenty-one per cent of hospital trusts responded to being sent their figures, and most were positive about using these PSIs in principle.
The explanation for differences between hospitals of most interest is variation in quality of care. A low rate might be due to a genuinely low risk of harm or, particularly likely for large denominators with zero numerators, to poor coding. It might be argued currently that a hospital with above-average rates is safer than one with very low rates due to the greater vigilance and attention it pays to patient safety, which is manifested by higher recording. For example, one hospital reported having a particular interest in obstetric tears, leading to careful (ie, better than average) recording, and that its maternity database did not contribute to the administrative data feeding into Hospital Episode Statistics. English rates have steadily increased year on year, as has the proportion of records with any secondary diagnosis filled in. We inspected all unplanned admissions in England and found that in 1996/7, only 29% had one or more secondary diagnoses recorded, increasing to 55% the following year and then to 63% in 2005/6. This still varies between hospitals.1819 The move towards “payment for performance”-led systems such as the UK’s Payment by Results initiative20 should improve the recording because of the financial incentive to accurately capture comorbidity and other clinical details—as is already the case in the US with DRGs.
Having a potential adverse event recorded for any indicator was usually associated with longer length of stay and greatly increased risk of death and unplanned readmission. This suggests that, although this is partly explained by case mix, there is an appreciable “signal” despite the “noise.” Perhaps the most notable association involved postoperative sepsis. Adverse events such as infection are known to prolong hospitalisation and increase mortality, which has led in the US to the creation of the Surgical Care Improvement Project,21 which provides for national data-collection and quality-improvement activities for hospitals.
Adaptation of the AHRQ specifications for systems used by the NHS presented several challenges. We decided to translate only the specified codes into ICD10 and OPCS, rather than add new codes that might be useful, because of the evidence base supporting the AHRQ choices. The exception to this translational approach was the derivation of a list of operating room procedures, which we considered to be best done de novo. Only prospective validation of the codes in the NHS, such as determining prevalent diagnostic and coding practice regarding infection and ulcers, will inform the need to amend the specifications. However, although ICD10 has some codes for iatrogenic conditions and complications of medical or surgical care, it was not designed to capture adverse events and cannot handle “near misses.”
Some hospital trusts raised the question of whether our case-mix adjustment was sufficient to make valid comparisons between trusts’ PSI rates, as adverse events are more common in older and iller patients. For example, many factors other than maternal age were found to predict obstetric tears in a study of 142 US hospitals.22 Zhan et al23 found that the type of procedure was an important predictor of iatrogenic pneumothorax, and Rosen et al24 also found that not just age, sex and DRG were associated with higher indicator rates, though she was more positive than Grobman et al22 about the impact of his findings on the utility of safety indicators with their current level of case-mix adjustment. We did not adjust by HRG due to instability of rates, but will consider using the AHRQ comorbidity software after translation of the diagnosis codes into ICD1025 in future. It is important, however, not to adjust for factors that are within the control of the hospital, otherwise important sources of variation will be obscured.
Some studies have looked at whether indicator rates are higher in some population subgroups such as schizophrenics26 and ethnic groups,2728 while others have considered hospital-level factors such as teaching status29 and Joint Commission accreditation scores.30 Others have suggested that the safety indicators should not be used by themselves or in a single year but with other indicators such as short-term readmissions31 or in temporal trends.32 Comparing a hospital’s rates with its own earlier rates has the advantage that coding practice will vary less over time than between different hospitals.
As well as improving the recording of secondary diagnoses in particular, there are other ways of getting more value from administrative data. A common feature of these databases, which Hospital Episode Statistics and Medicare share, for example, is the inability to assuredly distinguish between comorbidity and complication, as the timing of the secondary diagnosis is not given, meaning that it is impossible to tell, for example, whether a patient had the ulcer on admission or developed it subsequently. A few studies have tried successfully adding a flag to each record to indicate postadmission onset33 and found that it adds great value and that coders are very good at determining the relative timing of the secondary diagnosis 34. The Centers for Medicare and Medicaid Services now require that hospitals report Present On Admission (POA) information for secondary claims to Medicare (effective October 2007), which will allow Medicare to create at least two reduced payment DRGs for postadmission infections.
The Institute for Healthcare Improvement believes that data on safety are best used internally by the hospitals rather than being used to make judgements on them by external bodies.35 Several trusts expressed a desire to see the details of their flagged patients via a secure web front-end that is currently in use for an outcome monitoring tool described elsewhere that uses data lagging 6–8 weeks behind real time.36 In an appropriately secure system (to maintain patient confidentiality), clicking on a flagged record could show patient details including which safety indicator affects the patient and a pseudonymised patient identifier, which would appreciably facilitate an audit process.
Future directions
We have recruited a group of interested trusts to participate in a project designed to raise the accuracy of English hospital admissions data and assess their true usefulness for measuring and monitoring patient safety. This will involve first a case-note audit of flagged admissions, trying to understand the barriers to accurate coding, and second a comparison of admissions data with other available data sources within a hospital such as bed sore registers, laboratory results and incident reporting forms such as the National Reporting and Learning System mentioned earlier. We view our current definitions of the translated safety indicators to be preliminary and will be informed by the results of this future work. We have to date taken only the ICD9 codes and translated them, but a logical next step that we have planned is to go through ICD10 to try to make use of its greater richness for capturing adverse events. The task of improving patient safety is great, but we believe that accurate information presented appropriately for key users has a crucial role and that validated safety indicators that can be routinely derived and regularly monitored can form an important part of this effort.
Acknowledgments
We are extremely grateful to C Sweeting, a freelance clinical coding consultant, for her expertise in translating ICD9 to OPCS procedure codes. We also thank Dr Foster Intelligence, an independent healthcare information company, for sending out the reports to hospitals and collating feedback, and the Healthcare Commission for collaborating on the translation of the indicators, which they did in parallel to us.
REFERENCES
Footnotes
Funding: AB is 100% and PA is 50% funded by Dr Foster Intelligence via a research grant for the Unit. The Dr Foster Unit at Imperial is affiliated with the Centre for Patient Safety and Service Quality at Imperial College Healthcare NHS Trust which is funded by the National Institute of Health Research.
Competing interests: The Unit is funded by a grant from Dr Foster Intelligence (an independent health service research organisation).
Ethics approval: Ethics approval was provided by the Patient Information Advisory Group (PIAG) and St Mary’s Local Research Ethics Committee.
Patient consent: Obtained.
AB and PA conceived the study. AB performed all analyses. AB and PA wrote the manuscript. AB is the guarantor for the study.