Article Text

Abstract
Objectives To describe the authors' hospital-wide efforts to improve safety climate at a large academic medical centre.
Design and setting A prospective cohort study used multiple interventions to improve hospital-wide safety climate. 144 clinical units in an urban academic medical centre are included in this analysis.
Interventions The comprehensive unit-based safety programme included steps to identify hazards, partner units with a senior executive to fix hazards, learn from defects, and implement communication and teamwork tools. Hospital-level interventions were also implemented.
Main outcome measures Safety climate was assessed annually using the safety attitudes questionnaire. The safety culture goal was to meet or exceed the 60% minimum positive score or improve the score by ≥10 points.
Results Response rates were 77% (2006) and 79% (2008). For safety climate, 55% of units in 2006 and 82% in 2008 achieved the culture goal. For teamwork climate, 61% of units in 2006 and 83% in 2008 achieved the culture goal. The mean safety climate improvement (difference score) for 79 units at or above 60% in 2006 was 0.201 in 2008; the mean improvement for the 65 units below the threshold was 18.278. The mean teamwork climate improvement (difference score) for the 89 units at or above 60% in 2006 was 0.452 in 2008; the mean improvement for the 55 units below the threshold was 16.176. Climate scores improved significantly from 2006 to 2008 in every domain except stress recognition.
Conclusions Hospital-wide interventions were associated with improvements in safety climate at a large academic medical centre.
- Continuous quality improvement
- culture
- healthcare quality
- patient safety
- safety culture
Statistics from Altmetric.com
Introduction
Establishing a sound culture of safety in healthcare is important and may be associated with patient outcomes.1–13 Although culture definitions vary, a common definition is the set of norms, values, perceptions and beliefs that govern behaviour and ultimately outcomes.6 14 15 Anthropologists measure culture through careful, long-term observations, whereas survey researchers measure climate through employee assessments of work-related norms.16 17 The term safety culture is frequently used when describing survey results that are technically climate.18 Climate will only be used when referring to survey results.
While safety culture varies among hospitals, emerging evidence suggests an even larger variation among units within a hospital.19–21 Climate within clinical areas is responsive to interventions. The comprehensive unit-based safety programme (CUSP) improved climate in intensive care units (ICUs) at the Johns Hopkins Hospital (JHH)22 and throughout Michigan in the USA,23 and was associated with improved climate, reduced risks and decreased nurse turnover in a surgical inpatient unit at JHH.24
A core behaviour of a safe culture is the capacity to learn from mistakes. The healthcare industry is better at recovering rather than learning from defects. Recovering from defects fails to decrease the probability that future patients will experience the same problem.25 Healthcare organisations must also learn from mistakes.
Although the methods to improve climate in a specific unit26 are maturing, methods to improve culture across an entire hospital are nascent. The purpose of this manuscript is to describe our hospital-wide efforts to improve safety climate.
Methods
This prospective cohort study describes safety climate improvements occurring between 2006 and 2008 at the JHH, a large academic medical centre with 170 clinical areas in Baltimore, Maryland. The JHH started building the infrastructure to support a safety culture in 2001. This included investing in staff to conduct safety initiatives,27 creating a patient safety budgeting process and developing a code of conduct and a safety star recognition programme. The hospital's Patient Safety Committee was launched in 2001, and in 2003 safety culture improvement became a strategic objective. Many leaders and quality and safety committees at JHH are now involved in monitoring and improving patient safety in collaboration with the Quality and Safety Research Group (School of Medicine), and the Risk Management and Quality Improvement Departments, and the Center for Innovations in Quality Patient Care (JHH). The series of interventions implemented to develop a hospital-wide safety culture are described below. The study was approved through an expedited review by the Johns Hopkins University Institutional Review Board; informed consent was waived.
Safety attitudes questionnaire
By 2002, the Safety Attitudes Questionnaire (SAQ) was being used sporadically in a dozen clinical areas across JHH. Systematic and methodologically rigorous administration of the SAQ across the entire JHH began in 2006. The SAQ elicits frontline worker assessments of the following domains: safety climate, teamwork climate, job satisfaction, stress recognition, working conditions, and perceptions of hospital-level and unit-level management. The SAQ is valid and psychometrically sound,28 reliable29 and responsive to interventions.22–24 26 30 31 The survey items use a five-point Likert response scale, from ‘disagree strongly’ to ‘agree strongly.’
SAQ inclusion criteria and administration
Staff members with a ≥50% commitment to their unit for at least four consecutive weeks prior to survey administration were invited to complete the SAQ. Respondent categories included: administrative support, attending/staff physician, clinical social worker, clinical support, dietician/nutritionist, environmental support, fellow physician, nurse manager/charge nurse, other, other manager, pharmacist, physician assistant/nurse practitioner, registered nurse, resident physician, technologist/technician and therapist (respiratory, physical, occupational, speech). The survey elicits respondent demographic information, including whether or not they have completed the survey before. Units that participated in 2006 and 2008 SAQ administrations were included in our analyses.
Interventions
The hospital-level quality improvement interventions included the CUSP and others listed in box 1 and briefly described below.
Box 1 Efforts implemented at Johns Hopkins Hospital to improve safety culture and climate
Efforts to improve safety culture and climate
Comprehensive Unit-Based Safety Programme rolled out in more than 30 units
Annual culture assessment and feedback
Web-based event reporting system
Lessons Learnt newsletter
Patient Safety Grand Rounds series
Quality and Safety Journal Club
Departmental Quality and Safety Dashboards
Infrastructure investments (Director of Patient Safety, Departmental Patient Safety Officers, Patient Safety Analysts)
Patient safety budget process
‘Safety Star’ Recognition Programme
Developed and implemented a new Code of Conduct Policy
Board of Trustees engagement
Comprehensive Unit-Based Safety Programme
The Comprehensive Unit-Based Safety Programme (CUSP) was implemented by unit (patient care area or ward) with the long-term goal of hospital wide use. Initially, units volunteered to implement CUSP. Since 2006, units with a low safety climate were encouraged to implement CUSP. After a unit expressed interest in CUSP, a CUSP coach from the hospital patient safety office met with the unit manager to describe the programme, formalise a team and outline next steps. Before starting the programme, the coach partnered a hospital senior leader with the CUSP team and met with the team leader to review the unit's climate scores and develop a strategic plan. The coach stays with the CUSP team to support implementing the programme (table 1). A full description of CUSP has been published,24 and training materials are available online (http://www.safercare.net).
Comprehensive Unit-Based Safety Programme*
Event reporting
In July 2004, JHH implemented an electronic event-reporting system, Patient Safety Net University HealthSystem Consortium (Oakbrook, Illinois, USA) for use throughout the hospital. All staff members are trained to use this system.
All events are reviewed by the hospital patient safety office, categorised and assigned to the responsible improvement team. This review helps to identify trends, triage events for significance (regardless of harm score) and feed back results to managers and frontline reporters. A multidisciplinary group of safety and quality leaders from across the organisation also meet weekly to review significant events reported from the previous week. The nurse manager and physician advisor from the involved unit receive an email describing the event. Since fiscal year 2005, staff members have reported over 10 000 events annually.
Science of safety training
Hospital-wide training on the science of safety was accomplished through presentations at all departmental grand rounds at least once over the last 3 years (and in several departments annually), and to departmental administrators, new orientees, all new house staff, the hospital Board of Trustees, and medical and nursing students (http://www.safercare.net).
Communication of lessons learnt
Several communication tools were developed and implemented to broadly share lessons learnt from adverse events and share effective interventions. A health system newsletter called OnGuard is published five to 10 times annually with messages from leadership and safety experts, current safety research, safety tips, outcomes from sentinel events and root cause analyses, and success stories from improvement teams and safety champions. Other strategies include:
A patient safety grand rounds series (for all employees);
A patient safety journal club (for quality and patient safety leaders);
Patient safety research meetings (for all employees interested in strategies to design, implement, and evaluate interventions);
Discussion and networking groups (for patient safety officers and quality improvement staff).
Quality and safety dashboard
A web-based quality and safety dashboard was developed to report weekly harm (hospital-acquired infections, hand hygiene compliance rates and use of evidence-based interventions) to hospital leaders and Board of Trustees' members. The dashboard has been an agenda item at every Board of Trustees meeting.
Culture assessment as an intervention
The SAQ28 was used to conduct annual safety climate assessments. The feedback from these data stimulates discussions and improvements of poor scoring items. A minimum of 10 possible respondents per unit and a 60% response rate was required to analyse results. Results were reported to unit leadership. When physicians were not affiliated with a particular clinical area, they were grouped as a unit within a department. Hospital patient safety office staff, trained to debrief results,37 reviewed SAQ results with each unit, and discussed strategies such as CUSP to improve.
Safety culture goal
The safety culture goal was two-pronged: either maintain a good score or improve a poor score. Departmental leadership and unit managers were asked to meet or exceed minimum threshold scale scores of 60% for good teamwork climate and safety climate over time, with a ‘goal zone’ of 80–100% or to improve scores by 10 points.31 39 40 While these goals are somewhat arbitrary, they help units interpret their scores.
Statistical analysis
Descriptive data were reported for 2006–2008 and expressed as percentages and means with SD (±SD). Scale scores were calculated for individual respondents by taking the average of the scaled items. At the unit level, results were calculated as the percentage of individual respondents within a unit who reported a positive climate (those who agreed slightly or strongly).28 40 41 Of the 150 units surveyed in 2006, 144 (96%) completed the survey in 2007 and 2008, leaving a set of 144 units for cross-year comparisons. We used paired-samples t tests to compare hospital-wide 2006 and 2008 scores for each domain and for each item. We calculated the mean improvement in safety climate and teamwork climate for units with 2006 scores that were either above or below the 60% threshold. Statistical significance was defined as p≤0.05. All statistical analyses were performed using SPSS version 15.0 (SPSS, Chicago, Illinois).
Results
SAQ respondents
The hospital-wide response rates were ≥75% for each year analysed (table 2). Most survey respondents were female. One-third of 2006 respondents, and over half of 2007 and 2008 respondents were previously surveyed. Figure 1 shows hospital-wide descriptive safety culture results by domain over the 3 years studied.
Safety Attitudes Questionnaire respondent characteristics

Hospital-wide score by Safety Attitudes Questionniare (SAQ) domain. This figure shows the mean percentage of the 144 clinical areas at the JHH reporting positive scores for the six domains of culture on the SAQ. For comparison purposes, only the 144 clinical areas with survey results from all 3 years were included in this analysis.
Safety culture goal
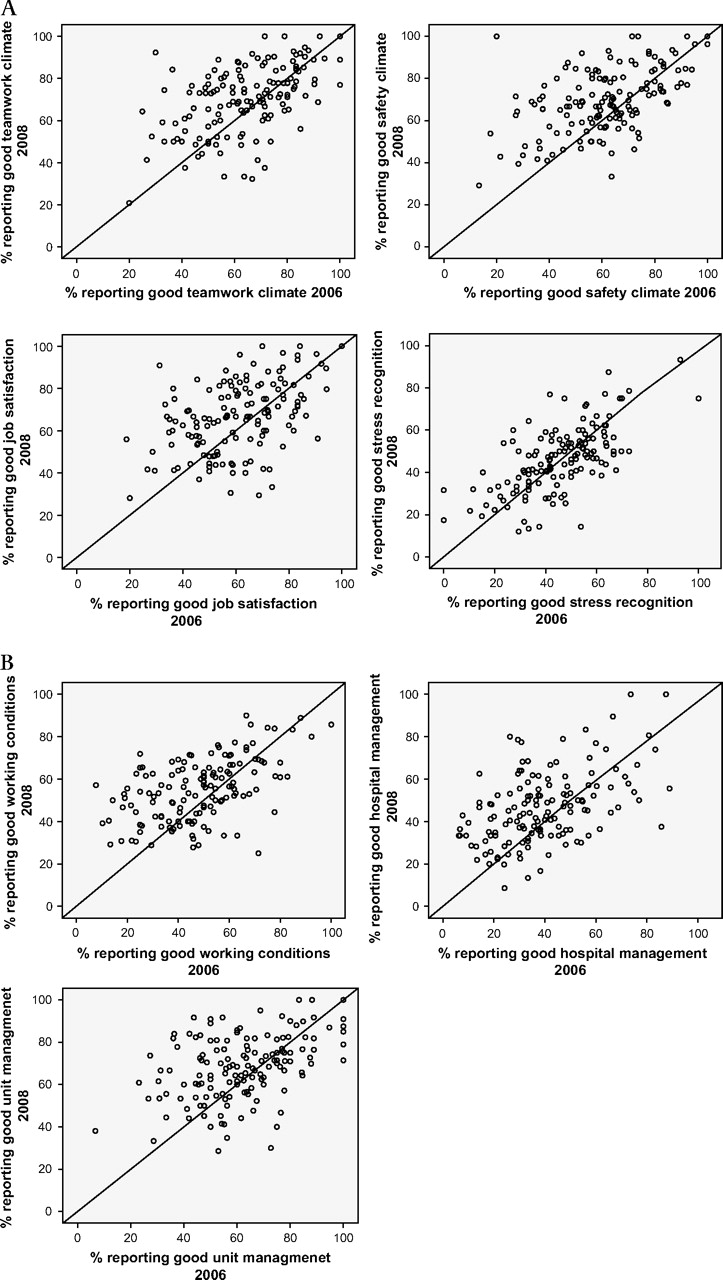
Relative to safety climate, 55% (79 of 144) of units in 2006, 67% (96 of 144) of units in 2007 and 82% (118 of 144) of units in 2008 achieved the 60% positive threshold or the 10-point improvement goal. Relative to teamwork climate, 61% (89 of 144) of units in 2006, 75% (108 of 144) of units in 2007 and 83% (119 of 144) of units in 2008 reached the goal. The mean safety climate improvement (difference score) for the 79 units at or above 60% in 2006 was 0.201 in 2008; the mean improvement for the 65 units below the threshold was 18.278. The mean teamwork climate improvement (difference score) for the 89 units at or above 60% in 2006 was 0.452 in 2008; the mean improvement for the 55 units below the threshold was 16.176. Figure 2A, B illustrates individual unit scores for each domain from 2006 (x axis), plotted against their scores from 2008 (y axis).

Individual unit climate score comparison of 2006 with 2008 by culture domain. (A) Graph of the 144 Johns Hopkins Hospital units (represented by a circle) in 2006 plotted against 2008. One panel represents each safety culture domain for teamwork climate, safety climate, job satisfaction and stress recognition. Individual unit climate scores from 2006 (x axis) are plotted against their scores from 2008 (y axis). Units above the reference line were better in 2008 than in 2006, whereas units below the reference line were worse in 2008 than 2006. (B) Graph of the 144 Johns Hopkins Hospital units (represented by a circle) in 2006 plotted against 2008. One panel represents each safety culture domain for working conditions, hospital management and unit management. Individual unit climate scores from 2006 (x axis) are plotted against their scores from 2008 (y axis). Units above the reference line are better in 2008 than 2006, whereas units below the reference line are worse in 2008 than in 2006.
Table 3 is a cross-comparison of 2006 and 2008 SAQ results by domain and item level. The SAQ scores improved significantly from 2006 to 2008 in paired-samples t tests for every domain and item except stress recognition. The mean teamwork climate scale score was 64.74 in 2006 and 70.64 in 2008 (t=−4.30, p<0.001). In this domain, the item ‘I have the support I need from other personnel to care for patients’ improved the most. The mean safety climate scale score was 61.01 in 2006 and 69.37 in 2008 (t=−6.02, p<0.001). In this domain, the item ‘I am encouraged by my colleagues to report any patient safety concerns I may have’ improved the most. Moreover, the item ‘The culture in this clinical area makes it easy to learn from the errors of others’ significantly improved from 66.91 in 2006 to 71.55 in 2008 (t=−3.94, p<0.001). t Test comparisons of scale scores from 2006 to 2007 revealed significant improvements in safety climate, 61.01 to 64.59 (t=−2.81, p=0.006).
Safety attitudes questionnaire domain item scores (N=144 JHH Clinical Areas)
The safety climate score decreased by 9.53 points in 17 of 144 units (11.8%). Culture is influenced by many variables not measured here. Informal staff interviews revealed that change of managers, unit construction and implementation of information technology appeared to contribute to lower SAQ results.
Learning from mistakes
As part of CUSP, units were asked to learn from one defect a month. Below is one example from an ICU:
What happened?
A patient required transvenous pacing during the night. This procedure requires two catheters; an introducer called a sheath and a pacing catheter to go through the sheath. Both catheters come in different sizes, and each packaged and typically stored separately. The clinical fellow performing the procedure grabbed the wrong size catheter, and the patient subsequently suffered an air embolism but recovered. In discussing the case, a senior nurse declared this was a 20-year recurring event, highlighting our failure to learn from mistakes.
Why did it happen?
The CUSP team investigated the event and determined that insufficient training and supervision were prominent causes. A major reason for this inadequacy was a system that made the clinical fellow guess the correct combination of catheters rather than packaging equipment together.
What did you do to reduce risk?
Using their science of safety training, the CUSP team developed several interventions. First, they shared the event with the residency training directors, who developed a simulation and certification program for placing these catheters. Second, the nurses immediately taped the correct size catheters together as a pacing kit, reducing the risk of grabbing the wrong size catheters. Third, the team surveyed doctors throughout the hospital to identify equipment they wanted in a pacing kit. After gaining consensus, JHH's Central Supply was asked to make pacing kits.
How do you know risks were reduced?
These events are too rare to measure as rates. Therefore, measures of risk reduction were completing the simulation and certification programme, and stocking new pacing kits in the ICU. Within a month, pacing kits were in the ICU. Within 6 months, all residents and clinical fellows had completed the programme.
Discussion
To our knowledge, this is the first hospital-wide initiative to evaluate the impact of a patient safety program on safety climate. We found significant improvements across six of the seven safety culture domains, which included the teamwork climate and safety climate domains that we explicitly targeted to improve hospital-wide collaboration and many examples of learning from defects. Stress recognition did not improve, yet our programme did not include an intervention to improve this domain. We are currently developing interventions to improve stress recognition.
In our study, instituting a climate goal helped hospital and unit leaders identify units that needed to improve their culture. Eighty-two per cent of units either maintained at least a 60% positive threshold score or improved their score by at least 10 points in 2008.
Our results suggest that safety climate is measurable and can be improved across a large and complex organisation. We implemented interventions that are grounded in a conceptual model of high-reliability organisations,42 43 prior unit-based research22 and our experience44 to achieve this.
Because climate is unit-specific, CUSP was implemented at the unit level.19–21 Through CUSP, we partnered senior leaders with frontline clinicians to learn rather than just recover from mistakes. The CUSP team and executive jointly solved problems, and the executive supported improvement efforts. Executive walkrounds have previously demonstrated safety culture improvements.39 45
We learnt several lessons about implementing a culture improvement programme.22 24 32–36 46 47 First, CUSP provides enough structure to establish a system of safety and enough flexibility to encourage units to address their unique problems. Second, because CUSP takes institutional resources, it is important to focus on units with low culture scores. Third, a CUSP team leader (usually a nurse) and physician leader need 10–20% of time for their efforts. Without dedicated time, it was difficult to investigate defects, develop effective interventions and reduce future harms. Fourth, it is essential that all staff understand the science of safety, have practical tools to improve patient safety, and make CUSP a continuous unit process. Fifth, our methods to robustly investigate mistakes, define interventions and evaluate risk reduction remain immature.48 Hospitals will likely need to make greater use of systems and human factors engineers who study the interactions of people and work systems to identify risks.49 Nonetheless, CUSP provides a strategy for improving culture unit by unit, which facilitates spread throughout the organisation.
Limitations
We recognise several limitations. First, the study was observational, and JHH and individual units undertook a variety of efforts to improve culture, preventing us from establishing a causal relationship between culture improvements and any specific intervention. Second, units varied in the extent to which they fully implemented CUSP. Third, our learning from defects tool was less formal and designed for a more practical application on units where time and resources are constrained. Fourth, this study occurred in one academic medical centre, and may not be generalisable to other hospitals. Nevertheless, CUSP was used in ICUs throughout Michigan and achieved similar results. Fifth, climate assessment relies on self-reported survey data, and respondents may have answered falsely to feign improvement. Sixth, our ability to assign staff to units, and units to departments improved over time. There are complexities in defining a unit. Within cardiac surgery, for example, paediatric cardiac surgery was part of cardiac surgery in the first year but identified as a separate unit in subsequent years at the staff's request. Also, it was difficult to assign physicians to units that did not have a dedicated physician team. Seventh, the science of measuring, reporting and improving culture must mature. Though practical, we know that the 60% positive threshold and ≥10-point change are based on limited experience,39 but are comparatively conservative.50 Eighth, we did not attempt to link improvements in culture to other patient outcomes. Outcome measures of safety apply to specific areas (eg, ICUs) and process measures of safety apply to specific patient populations (eg, acute myocardial infarction). There are no valid outcome safety measures that apply to the entire hospital, and it was impractical to measure individual outcomes across 144 units.51 Finally, improvements in climate could be influenced by several threats to validity including historical trends, maturation and repeated testing.
Conclusion
The use of hospital-wide structured interventions was associated with improvements in safety climate over 3 years in a large academic medical centre. Further research is needed to better understand how to measure, improve and utilise climate data in ways that maximise the extent to which they are diagnostic and actionable in monitoring and facilitating quality-improvement efforts.
What is already known on this subject
Establishing a sound safety culture in healthcare is widely recognised as important. Yet culture varies widely among units within a hospital.
What this study adds
Multiple interventions were associated with hospital-wide safety climate improvements in all domains except stress recognition.
Stress recognition was the only domain that was not targeted by any intervention and did not improve significantly over time, demonstrating that culture can be improved with intervention.
The comprehensive unit-based safety programme provides a framework to spread culture activities and improvements throughout the hospital.
Lessons learnt in multiyear hospital-wide survey administrations included aggregating physicians unaffiliated with a specific unit to a departmental staff physician group, using methodologically rigorous baseline assessments to consistently capture staff across administrations, and using safety climate assessment as an intervention provides an evidence-based focus for quality improvement.
Acknowledgments
C Fullwood posted blank SAQs to sites, managed the data and assembled results. C Blackledge helped produce and mail SAQ reports.
References
Footnotes
Competing interests PJP reports receiving grant support from the Agency for Healthcare Research and Quality for patient safety and culture research, and receives honoraria from various hospitals and hospital associations to speak about patient safety and culture. JBS has a non-financial interest with Pascal Metrics in that he created the Safety Attitudes Questionnaire, but licensed the rights of the SAQ to them. JBS does not receive royalties from the SAQ, but does have permission to act as a paid consultant with Pascal Metrics but has not done so as yet.
Provenance and peer review Not commissioned; externally peer reviewed.