Article Text

Abstract
Background: Current “flags” for adverse events (AEs) are biased towards those with serious outcomes, potentially leading to failure to address mundane common problems.
Aim: To provide a basis for setting priorities to improve patient safety by ranking adverse events by resource consumption as well as by outcome. This was done by classifying a set of AEs, according to how they may be prevented, into “Principal Natural Categories” (PNCs).
Setting: AEs associated with a representative sample of admissions to Australian acute care hospitals.
Design: AEs were classified into PNCs which were ranked by overall frequency, an index of resource consumption (a function of mean extended hospital stay and the number of cases in each PNC), and severity of outcome.
Results: The 1712 AEs analysed fell into 581 PNCs; only 28% had more than two cases. Most resource use (60%) was by AEs which led to minor disabilities, 36% was by those which led to major disabilities, and 4% by those associated with death. Most of the events with serious outcomes fell into fewer than 50 PNCs; only seven of these PNCs had more than six cases resulting in serious outcomes.
Conclusions: If interventions for AEs are triggered only by serious outcomes by, for example, using recommended risk scoring methods, most problems would not be addressed, particularly the large number of mundane problems which consume the majority of resources. Both serious and mundane problems should be addressed. Most types of events occur too infrequently to be characterised at a hospital level and require large scale (preferably national) collections of incidents and events.
- patient safety
Statistics from Altmetric.com
There has been considerable interest in improving patient safety since the release of some major reports in the USA,1,2 the UK,3–5 and Australia.6 The emphasis, quite reasonably, has initially been on identifying and addressing events with serious or catastrophic outcomes which should definitely not have occurred, such as the inadvertent intrathecal injection of drugs for chemotherapy that should have been given intravenously (“sentinel events”7).
Systems have been or are being put into place to “flag” events immediately which exceed a certain risk threshold for other patients or the health facility, based on the likelihood of recurrence and severity. A 5 × 5 matrix of frequency and severity is being set up by the National Health Service in the UK,4 and a similar system based on a 3 × 3 matrix has been established at all 173 health care facilities of the Veterans Administration (VA) in the USA.8 However, these very serious events occur relatively infrequently and, while it is necessary and desirable that they receive high priority, there is a risk that they will receive a disproportionate amount of the finite resources available for improving patient safety. Initial estimates have indicated that some quite mundane problems, such as pressure sores and catheter related infections, account for a substantial fraction of the resources consumed by “things that go wrong” in health care.9
A study was undertaken to examine the adverse events representative of all admissions to private and public acute care hospitals in Australia in 1992 in the Quality in Australian Health Care Study (QAHCS),10 with a view to trying to set priorities based not only on the severity of outcome but also on resource consumption. All the adverse events in the QAHCS were classified into categories according to how they might have been prevented, in line with a suggestion made in 1989 by Vincent,11 so that they could be ranked according to an index of resource use as well as numbers of deaths and major disabilities.
METHODS
The method used in the QAHCS study to identify adverse events has been described in detail elsewhere; a brief outline is given in box 1.10 For this analysis, those events with a less than 50% chance of being caused by healthcare management, rather than an underlying disease process, were excluded. Those events discovered after the randomly selected “index admission” were also excluded. This was done to include only those cases thought more likely than not to constitute an adverse event, and which would reflect the number expected to occur in a year. This left 1712 cases out of the 2353 included in the original study.
Box 1 QAHCS methodology 10
-
14 179 randomly selected admissions to 28 hospitals in two Australian states (SA, NSW) were reviewed in two stages for the presence of an adverse event (defined as “an unintended injury or complication which results in disability, death or prolonged hospital stay and is caused by health care management”).
-
First stage review of the medical record by trained nurse reviewers for one or more of 18 explicit criteria previously shown to be associated with adverse events identified 6200 records positive for these criteria (43.7%).
-
Second stage review of these 6200 records by two or three medical officer reviewers to identify any adverse events.
-
For each of these cases the details of the adverse event, patient characteristics, extra bed days attributable to the event, disability attributable to the event, and the preventability of the event were recorded. Disagreements between the two primary medical officer reviewers were resolved by a third medical officer.
-
This process identified 2353 adverse events.
These cases were coded into Principal Natural Categories (PNCs) according to the principles developed for the Generic Occurrence Classification (GOC, box 2).12,13 Adverse events were coded into PNCs by experienced coders with a background in nursing and were then independently checked by other experienced coders. Queries raised by the primary or secondary coder were discussed on a regular basis with a team of coders and an investigator (WBR). In this way, new categories were established as necessary and all the adverse events were coded into relevant categories using an iterative process.
Box 2 The Generic Occurrence Classification (GOC) 12, 13
-
This is a multi-axial classification of things that go wrong in health care (for example, incidents or adverse events) into natural categories.
-
Natural Categories are descriptors of incidents or adverse events which are recognisable by, and potentially useful to, clinicians so that clinical problems, together with their causes, potential preventability and outcomes can be characterised, priorities can be set, comparisons can be made, and the stage set for trends to be tracked over time.
-
Basic Natural Categories (BNCs) capture attributes of an event such as which medical speciality was responsible, where the event took place, what pre-existing conditions the patient had, and what the outcome was in pathophysiological terms. Each adverse event may be classified into as many BNCs as are necessary to characterise it from about 12 500 in the GOC.
-
Principal Natural Categories (PNCs) allow each adverse event to be classified into a single category according to how it may be prevented. There are currently about 1000 PNCs in the GOC.
-
Dominant Natural Categories (DNCs) consist of one or more PNCs and were devised so that sufficient adverse events could be aggregated into like categories to allow comparisons between Australian and American data.13 There are currently about 100 DNCs in the GOC.
The adverse events, data from the initial reviews, and categorisation into PNCs were all stored in a Microsoft Access database (Microsoft Corporation, Redmond, WA, USA). Subsequent analysis was performed using Access, Microsoft Excel and S-Plus 2000 (Insightful Corporation, Seattle, WA, USA). The number of cases per PNC was calculated and information from the initial review was retrieved to determine the outcome score and additional length of stay in hospital attributed to each adverse event.
Resource use
The additional length of stay in hospital attributed to each adverse event had been independently estimated by the two original reviewers. For each case the mean estimate was used. Where the length of stay question was not answered by one of the reviewers, the value given by the other reviewer was used. From the length of stay per case we calculated the mean length of stay per PNC. The total length of stay for each PNC, calculated as the product of the mean length of stay attributed to the adverse events and the number of cases in that PNC, was used as an index of resource use by that PNC.
Outcomes
Outcomes were originally recorded for the QAHCS using a scale of 1–9. Scores 1–8 were combined into three categories using a previously described convention (minor disability, major disability, and death).13 Where a score of 9 (“cannot reasonably judge”) or 0 (not answered) was recorded for one reviewer, the score from the other reviewer was used. Where there were no answers or only a score of 9 was recorded, the case was not classified for an outcome. Where there was disagreement of the reviewers between the three categories, the outcome recorded by one of the reviewers was randomly chosen.
RESULTS
Frequency
The 1712 adverse events were distributed among 581 PNCs. Of these, 1291 were recorded as having led to a minor disability, 312 to a major disability, and 79 were associated with death. Of the 581 PNCs, 165 had at least three cases with only 56 having more than six cases and only 23 more than 12. Only seven PNCs contained more than 24 cases. The 20 most frequent PNCs are shown in table 1.
The 20 most frequent principal natural categories (PNCs)
Resource use
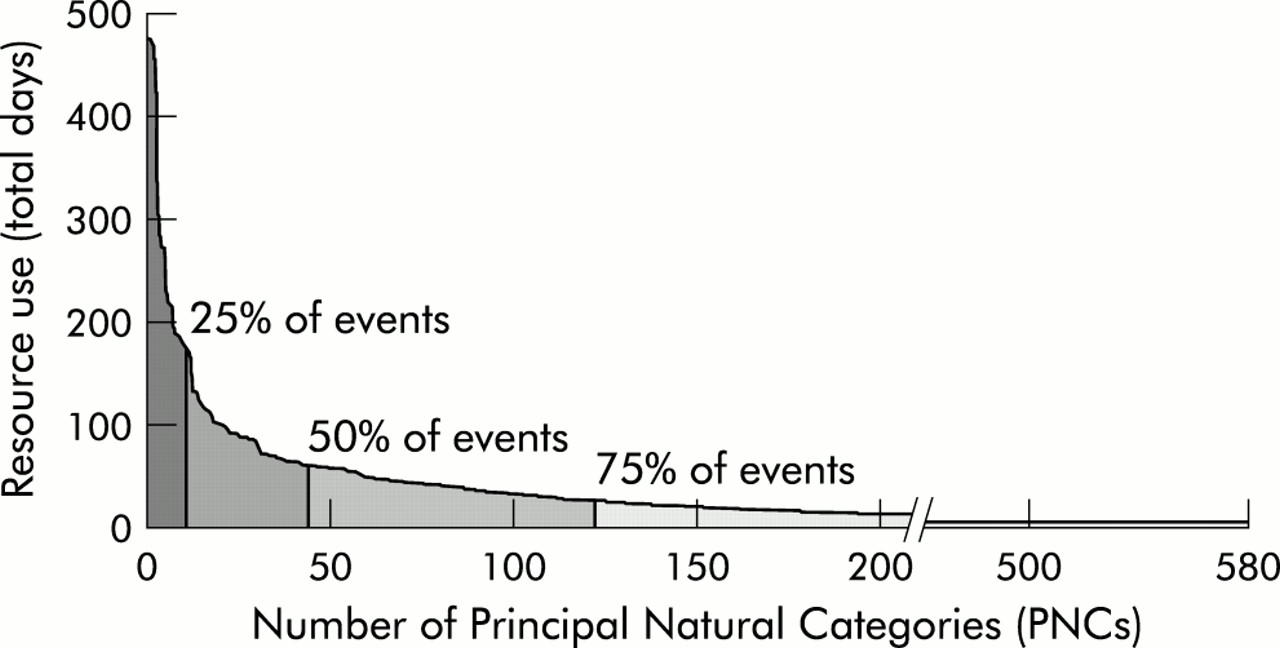
The 1712 adverse events led to over 11 500 extra days in hospital. Most of the resource use (60%) was attributed to events that led to minor disability, 36% to adverse events that led to major disability, and 4% to those associated with death. The 20 PNCs with the highest resource use are shown in table 2. The PNCs in table 2 accounted for 34% of the total resource use attributed to adverse events; 25% was attributed to the top 11 PNCs (fig 1).
The 20 principal natural categories (PNCs) with highest resource use

Resource use taken as a function of the mean length of stay attributed to adverse events in each category and the number of events in that principal natural category (PNC). The area under the curve shows the total resource use due to these events and indicates that 25% of the resources were used by the top 11 PNCs and 50% by the top 45 PNCs.
Many of the PNCs associated with high resource use were also in the 20 PNCs that led to the most major disabilities (table 3). This is partly because the stay in hospital attributed to each adverse event which led to a major disability was longer on average (13.4 days) than those which led to minor disability (5.4 days) or death (6.4 days). The mean extra length of stay in hospital attributed to all adverse events was just under 7 days.
The 20 principal natural categories (PNCs) with most major disabilities
Outcomes
The 20 PNCs with the most major disabilities are shown in table 3. These 20 PNCs accounted for 36% of all major disabilities, with 25% being caused by only nine PNCs (fig 2). Thirteen of the PNCs in table 2 were also among the top 20 most common, and 13 were among the top 20 resource consuming PNCs.

All of the 312 major disabilities fell into 178 PNCs. The area under the curve shows the total number of major disabilities, of which 25% were caused by 11 of the PNCs and 50% by 36 of the PNCs.
Seventy nine adverse events were associated with death, spread across 53 PNCs. Only six of these had three or more deaths. The PNC with the most deaths was “No, delay, inadequate investigation ischaemic heart disease” with five. Other categories with a high number of deaths were “Pressure sore/decubitus ulcer” (4), “Diagnosis delay/no/wrong, cancer lung/lung lesion” (4), “Iatrogenic - organ failure/SIRS/sepsis/septicaemia - non perioperative” (3), “Postoperative cardiac arrest” (3), and “Post procedure - organ failure/SIRS/sepsis/septicaemia - perioperative” (3). The top 15 categories account for 50% of all adverse events associated with patient death. Of the PNCs with at least five cases, the highest mortality rates were found in “Post procedure - organ failure/SIRS/sepsis/septicaemia - perioperative” (50% of six cases), “No, delay, inadequate treatment of complications/progression of cancer” (25% of eight cases), “Diagnosis no/delay/wrong, cancer large bowel” (22% of nine cases), “Diagnosis no/delay/wrong, cholecystitis/gall stones” (20% of five cases), and “No, delay, inappropriate treatment of congestive cardiac failure/left ventricular failure” (18% of 11 cases).
When the cases leading to major disability or death were combined, only one PNC had more than 12 cases—namely, “No, delay, inadequate investigation ischaemic heart disease” with 25 cases. Only six other PNCs had more than six cases with these outcomes: “Ongoing pain/restricted movement following back surgery” (10), “Postoperative bowel obstruction/adhesions” (9), “Pressure sores/decubitus ulcer” (9), “Injury due to fall in nursing home” (8), “Problems post radiation” (8), and “Failed/blocked/ruptured/aneurysm, vascular grafts” (7).
A full table of all 581 PNCs, the number of cases and outcomes can be found in electronic format in the Appendix on the QSHC website (www.qualityhealthcare.com).
DISCUSSION
Although much comment arose from the information published about the rates of adverse events,1,3,6 the classifications of adverse events used in the original publications10,14,15 were too crude to allow clinical problems to be characterised with sufficient specificity to allow clinicians to know where to start or what to do with respect to preventive or corrective strategies (except for the general category of adverse drug events16). For this reason, adverse events were classified for this analysis into PNCs—clinically meaningful categories according to how they could be prevented.
It is important to note that the PNCs used here are not “set in stone” and that events may be reclassified with particular interventions in mind. The GOC database has been set up in such a way that the data may be “cut” in many ways, depending on the issue. Coding events into basic natural categories simply deconvolutes “things which go wrong” in health care into component elements which can then be used as building blocks to construct profiles made up of aggregates of phenomena of relevance to the problem at hand. In this case they were used to construct the PNCs in tables 1 and 2. For this analysis adverse drug events have been divided up into specific drug type consequence combinations. However, if the potential impact of introducing computerised prescribing with decision support and unit patient dosing was to have been assessed, then all medication related adverse events which arise from problems amenable to resolution by these strategies would be combined into a PNC of relevance to this particular problem, regardless of drug types or event outcomes. Likewise, wound infections which require different preventive strategies have been separated in this analysis, whereas they could be combined if the impact of a universally available evidence-based decision support system was to be assessed, as will be discussed later in this paper. All the PNCs have been published in electronic form to allow the interested reader to gain some idea of how different “cuts” of the data may have altered the profile of adverse event categories.
The number of medical records reviewed for the QAHCS (approximately 15 000) is equivalent to the number of discharges and deaths expected per year in a 250 bed hospital running at 90% occupancy, with a mean stay of 5.5 days. As the demographic data of the QAHCS sample matched those of the Australian inpatient population, we will use this notional 250 bed hospital in our discussion to put the adverse event data into context. There has already been some comment on the implications of the low frequencies of most PNCs based on this notional hospital,6 but none on resource use or outcome profiles.
Frequency
This analysis indicates that such a hospital that sees approximately 15 000 patients per year would encounter approximately 1700 adverse events each year. Over 300 of these adverse events would lead to a major disability, and over 70 would be associated with death. The adverse events fell into nearly 600 PNCs. There were only one or two events in over 400 (72%) of the categories, more than six in only 56 categories (10%), more than 12 in only 23 (4%), and more than 24 in only seven categories (0.01%). Thus, in our notional hospital only one in 10 categories would be encountered more than once every 2 months, only 4% more than once a month, and only 0.01% more than twice a month. Experience from incident monitoring suggests that, to characterise an event properly with respect to contributing factors, manner of presentation and progression, it is best to have more than 100 cases in each category. To get a comprehensive picture of what is going wrong would require a national or at least a large scale collection of events.
Major disabilities
The situation would be even worse if only events resulting in major disabilities were collected. The 312 major disabilities fell into over 170 PNCs, with more than four cases in fewer than 20 categories; only one category had more than 12 cases (table 2). This means that, if root cause analysis was to be triggered by only those events that produce a major disability more than once per month, only one out of the nearly 600 event categories would be flagged. If root cause analysis was triggered by events producing a major disability at least every 2 months, only five PNCs would be flagged. Examination of the nature of the top 20 causes of major disability reveals that only a few would be likely to trigger a root cause analysis in any event—for example, “incomplete resection tumour/dysplasia/cyst”, “Osteomyelitis after inadequately treated wound”—as problems such as readmission for further back surgery or a small bowel obstruction are usually seen as “business as usual”. This suggests that triggering investigations or basing interventions purely on scores from risk management matrices would lead to nothing being done about the vast majority of adverse events.
It is interesting that the frequency of the two problems accounting for the most major disabilities may be a function of how health care is organised in Australia. “No, delay, inadequate investigation ischaemic heart disease” was almost exclusively a problem in public hospitals, while “Ongoing pain/restricted movement following back surgery” was almost exclusively a problem in private hospitals (p<0.001).
Resource use
Adverse events also led to a considerable amount of extra stay in hospital, and hence to considerable resource use. The 11 500 extra days in hospital attributed to adverse events by this analysis amounts to more than 10% of our notional hospital's total bed days per year. Taking account of the fact that care for a patient after an adverse event is more expensive than that of an average patient,16 this represents a substantial portion of a hospital's budget.
While this index of resource use is only a crude estimate because of limitations in the available data, our analysis of resource use by PNC shows us that there are a few frequent problems that lead to high resource consumption (50% by the top 45 PNCs), but there is also considerable resource consumption by rare problems (50% by the remaining 536 PNCs). This indicates a need not only to intervene for the common problems, but also to characterise and try to identify strategies for rare problems. An example of an analysis of a number of rare events which led to a definitive intervention at a national level is presented in a paper published in this issue of Quality and Safety in Health Care.17
Minor disabilities
This analysis also shows that adverse events that led to minor disabilities consume more resources than those that led to major disabilities and death. This suggests that particular efforts should be made to allocate resources to prevent some of these “minor” adverse events as they tend to be overshadowed by more dramatic events with serious outcomes. In terms of quality of care, this also affords some improvement to a far larger number of patients.
Because a large number of PNCs capture few events (less than 6), a potential bias in this study might occur if the high frequency PNCs that would be identified in sentinel event monitoring differed from the PNCs with lower frequencies. We found that the percentage of major disabilities and death varied slightly between the high frequency PNCs (28%) and low frequency PNCs (34%). Figure 3 shows that the mean excess length of stay for the two groups is similar across all outcomes. This indicates that, even if the PNCs were reorganised, the conclusions of this analysis would be consistent.

Average resource use per case leading to minor disability, major disability or death for the subgroups of PNCs containing at least six cases and those containing fewer than six cases. There is an almost identical distribution of resource use between “sentinel events” and “minor” events between these subgroups. LOS=length of stay.
Interventions
Some of the problems that lead to major disability or substantial resource use are not preventable with our current state of knowledge—for example, problems following radiation therapy—but, for many, improvements in clinical practice may lead to a reduction in frequency of adverse events—for example, postoperative pulmonary embolism, infected central venous catheter lines. Assessment of the evidence in the literature is required to determine the risk and cost benefit of a range of interventions for these problems. Unfortunately, the evidence for even the most common of these problems is incomplete, especially in the face of rapidly advancing technology and medical innovations, as well as for those associated with high rates of serious outcomes. We intend to review the levels of evidence in the literature for the common adverse events identified by this analysis which are amenable to prevention, earlier detection, or better management.
While human nature demands that attention be given to dramatic events leading to serious harm which should not have occurred—in this case, those events leading to major disability and death—this can result in disproportionate amounts being allocated to a very small number of rare problems. An extreme example of this is the ongoing £5 million per annum being spent in Australia on nucleic acid testing to reduce the “window” period for HIV and hepatitis C for donated blood; one additional case of hepatitis C was detected in the first year of testing (N Boyce, personal communication).
Priorities for adverse events should be set from a dual approach: high scores on a risk management matrix—that is, adverse events with severe outcomes—should trigger detailed root cause analysis but lower scores should also be monitored for accurate assessment of overall resource consumption. The current approach of sentinel event monitoring draws attention to the obvious “tip of the iceberg”. However, a large number of common adverse events of lower severity contribute significantly to patient morbidity and resource consumption. Problems which are rare may rate attention if an obvious simple solution is evident when they are characterised by analysis of a national dataset.
With evidence of problem frequency, outcome severity, and resource consumption, an institution can plan proactive measures to reduce adverse events. We have identified a set of problems that is amenable to evidence-based decision support tailored to individual patients which may be carried out at the time of structured preoperative assessment. The intervention involves the automatic generation of perioperative protocols for thromboembolism, pain, nausea and vomiting, and postoperative infection based on a standard computer protocol based history–investigation sequence. A project is underway coupling the generation of these protocols to improved work flow at a dedicated perioperative clinic. The intention is to address these problems, which currently consume 14% of all resource use attributed to adverse events, using the best evidence available. After a trial period, endorsement will be sought from professional bodies representing anaesthetists and surgeons so that the system can be widely applied. This represents another approach to problem solving—opportunistically using tailored protocols as an adjunct to a set of questions and investigations which are indicated in any event. Routine monitoring of adverse events in this context will also inform the effectiveness of these interventions; this is particularly important because randomised studies are difficult to perform in many areas of patient safety for ethical and logistical reasons.
Key messages
-
Current “flags” for adverse events are biased, appropriately, towards dealing with those with serious outcomes.
-
Only 40% of the resources consumed by adverse events is by those which lead to major disability or death.
-
Minor adverse events consume 60% of the resources.
-
The majority of events leading to both serious and minor outcomes occur too infrequently to be characterised or tracked at a hospital level and require large scale collections of events.
-
Attention must be directed to adverse outcomes with minor as well as major outcomes, and large scale collection of incidents and adverse events are required to characterise the individually rare events which collectively make up the bulk of all events.
In conclusion, limiting risk management to events with serious outcomes or potentially serious outcomes—an inevitable consequence of using currently recommended risk scoring methods—will limit interventions to a small range of problems. It is important also to target the large number of mundane problems which consume substantial resources, as well as to collect sets of individually rare but collectively important events so that they can be characterised as a prerequisite for devising preventive and corrective strategies.
Acknowledgments
This study was funded by the National Health Priorities and Quality Branch of the Department of Health and Aged Care of the Commonwealth Government of Australia.
Supplementary materials
Setting priorities for patient safety
W B Runciman, M J Edmonds, and M Pradhan
Web-only Table
Appendix: Outcomes for all principal natural categories