Article Text

Abstract
Background Quality indicator collection and feedback improves stroke care. We sought to determine whether quality improvement training plus indicator feedback was more effective than indicator feedback alone in improving inpatient stroke indicators.
Methods We conducted a cluster-randomised quality improvement trial, randomising hospitals to quality improvement training plus indicator feedback versus indicator feedback alone to improve deep vein thrombosis (DVT) prophylaxis and dysphagia screening. Intervention sites received collaborative-based quality improvement training, external facilitation and indicator feedback. Control sites received only indicator feedback. We compared indicators pre-implementation (pre-I) to active implementation (active-I) and post-implementation (post-I) periods. We constructed mixed-effect logistic models of the two indicators with a random intercept for hospital effect, adjusting for patient, time, intervention and hospital variables.
Results Patients at intervention sites (1147 admissions), had similar race, gender and National Institutes of Health Stroke Scale scores to control sites (1017 admissions). DVT prophylaxis improved more in intervention sites during active-I period (ratio of ORs 4.90, p<0.001), but did not differ in post-I period. Dysphagia screening improved similarly in both groups during active-I, but control sites improved more in post-I period (ratio of ORs 0.67, p=0.04). In logistic models, the intervention was independently positively associated with DVT performance during active-I period, and negatively associated with dysphagia performance post-I period.
Conclusion Quality improvement training was associated with early DVT improvement, but the effect was not sustained over time and was not seen with dysphagia screening. External quality improvement programmes may quickly boost performance but their effect may vary by indicator and may not sustain over time.
- Healthcare quality improvement
- Cluster trials
- Audit and feedback
- Six Sigma
- Team training
Statistics from Altmetric.com
Background
Stroke quality improvement efforts worldwide have included a major focus on development and implementation of a core set of quality indicators.1 ,2 The most common and most uniformly assessed are indicators for inpatient stroke care quality; in the USA, a ‘harmonised’ set of stroke inpatient indicators measuring processes of care among eligible patients has been developed and endorsed by the Joint Commission (JC), the National Quality Forum and the Meaningful Use programme. The US Veterans Health Administration (VHA) conducted a national assessment of these indicators in 2009 and provided performance data back to all VHA facilities at that single point in time.
While inpatient stroke care quality is thus frequently measured by standardised indicators, the methods that a given hospital or healthcare system uses to improve performance is more variable and less studied. Many different approaches to quality improvement have been used with varying degrees of success in various healthcare settings, including educational interventions, use of an opinion leader, academic detailing, audit and feedback of performance data, collaborative-style interventions for clinical teams and application of lean manufacturing improvement methods to clinical care.3
Inpatient stroke care improvement efforts have used many of these methods,4–7 but often are single-site projects, involve self-reported data from the clinical teams engaged in the improvement activity or lack a defined control group. These designs make it difficult to gain knowledge about the generalisable impact of a given quality improvement method. Many of these studies also are not designed to clearly distinguish intervention-related improvement from secular trends. Other well-designed cluster-randomised trials, using a variety of audit and feedback, clinical opinion leaders and collaborative-based interventions, have shown mixed effects on individual stroke indicators and on overall stroke care quality.8–10
Because of the lack of knowledge about how effective different quality improvement methods are for improving different stroke indicators, and based on VHA stroke performance data from 2009, we conducted a cluster-randomised trial to rigorously compare the effect of a more intensive quality improvement intervention with indicator performance feedback alone to improve two specific stroke indicators in 11 Veterans Administration Medical Center (VAMC) hospitals.
Methods
Study design was guided by the CONSORT cluster-randomised trial guidelines.11 A cluster-randomised design was chosen because the intervention was aimed at inpatient stroke teams. VAMC hospitals with at least 70 ischaemic stroke admissions and baseline passing rates (completion of the process among all eligible patients) on the two stroke indicators defined as primary outcomes of ≤80% annually were invited to participate (figure 1); 14 facilities were eligible. We used participating hospitals’ performance data from the VHA Office of Performance Measurement Stroke Special Study to calculate the ratio of between and within-hospital variation on a composite measure (# passes/# opportunities) of the two primary outcomes (intraclass correlation for this composite measure=0.16) and to estimate study power.12 Taking this correlation into account, with seven hospitals in each group, the power of detecting a difference in improvement of at least 28% on the composite measure (value chosen based on indicator improvement in a pilot quality project) was 83% with <5% type I error. However, of the 14 eligible hospitals, only 11 gave assent and were able to complete regulatory requirements to initiate ongoing assessment of performance by the time of study initiation, leaving 11 total sites participating.
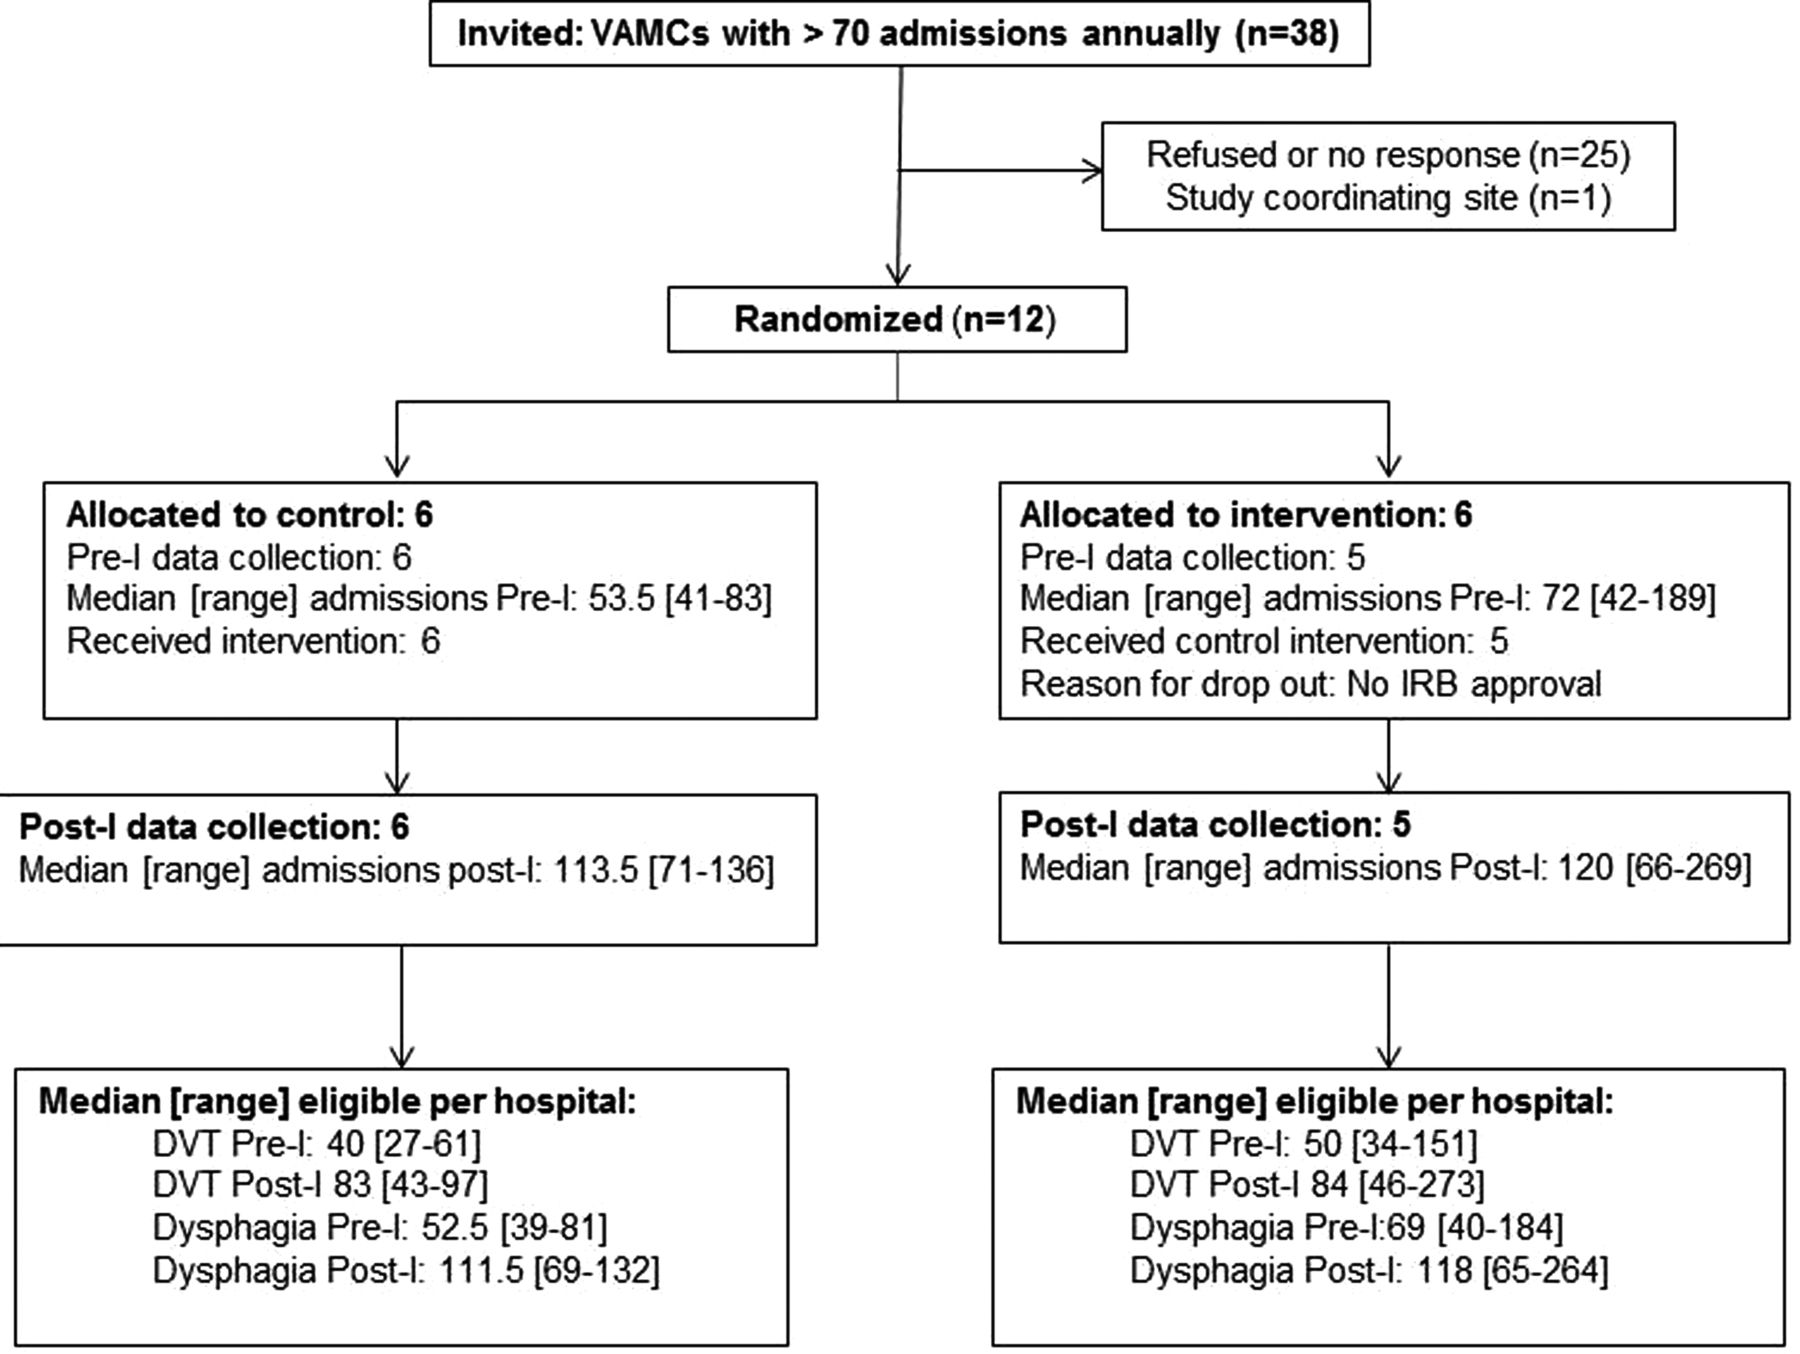
Study flow diagram. DVT, deep vein thrombosis; post-I, post-implementation; pre-I, pre-implementation; VAMC, Veterans Administration Medical Center.
We randomised participating sites stratified by presence of a baseline stroke data collection programme (JC certification, Get with the Guidelines-Stroke (GWTG) or local stroke indicator collection programmes) to a system redesign-based quality improvement training programme plus indicator feedback versus indicator feedback alone. IRB approval was obtained for conducting baseline interviews with hospital personnel about the structure of their current stroke care systems; the improvement activities were considered quality improvement and so facility assent but not IRB approval was required and documented.
Quality improvement intervention
The intervention focused on improvement in two stroke quality indicators: deep vein thrombosis (DVT) prophylaxis and dysphagia screening. These indicators were chosen based on need for improvement in the VHA and number of eligible patients12 ,13 and on inclusion in the current GWTG Stroke programme and VA stroke improvement efforts.14 Notably, during this study (figure 2), the VHA released an Acute Ischemic Stroke Directive that included dysphagia screening before oral intake as one of three inpatient stroke indicators to be collected nationwide beginning in July 2012.15

Study timeline. This figure shows the three study periods of interest (pre-I, active-I and post-I), and the relative timing of the release of the VA AIS Directive. active-I, active-implementation; AIS, Acute Ischemic Stroke; post-I, post-implementation; pre-I, pre-implementation; VA, Veterans Affairs.
The intervention consisted of a 6-month active implementation (active-I) phase where a quality improvement programme was delivered to intervention sites. This programme included a face-to-face collaborative training session for stroke team members followed by 6 months of external facilitation by improvement experts (see online supplementary table S1, for additional intervention details).16 Up to three stroke team members from each intervention site attended an in-person collaborative where 2 days of training and external facilitation was conducted by VA systems engineers and implementation researchers. Training focused on Systems Redesign/Operational Systems Engineering didactic and experiential learning, including developing a stroke process map, workflow analysis, identifying operational barriers, using lean process improvement tools and developing and control monitoring of specific Plan-Do-Study-Act cycles. External facilitation during the collaborative included pairing an engineer and an implementation researcher with each stroke team for direct assistance in developing their site-specific plans. External facilitation after the training included monthly telephone contact by the same engineer/implementation expert pair to review team progress and problem-solving and at least one on-site visit by the pair of facilitators to review data and follow example ‘tracer’ patients. Control sites did not receive training or external facilitation. Both intervention and control sites received monthly feedback on their performance on the two primary indicators of interest and on nine additional stroke quality indicators (see online supplementary table S2) and quarterly feedback on their performance in relation to group performance during the 6-month active-I phase and for 12 months post-implementation (post-I).
Trained centralised chart reviewers collected data to construct the indicators via remote review of electronic health records. All possible ischaemic stroke admissions at each facility were identified monthly using discharge diagnosis ICD9 codes with chart review verification; all admissions verified as ischaemic stroke were included in this study cohort. Indicators were assessed using existing JC definitions and, for VA-specific indicators, the definitions used in prior VA studies,12 ,13 including a validated method of constructing a retrospective National Institutes of Health Stroke Scale (NIHSS) score.17 We used a standard mock data set to train chart reviewers and conducted a 10% random resampling of cases throughout the study to assess inter-rater reliability (IRR) for all data elements; all IRRs (κ) for data elements in the indicator calculations were >0.80.
Outcomes
The two primary outcomes of the study were improvement in indicator passing rates from pre-implementation (pre-I) to post-I for DVT prophylaxis and dysphagia screening. A prespecified secondary analysis compared improvement pre-I (12 months prior to study initiation, figure 2) with active-I. In year one of the study, we conducted site interviews to assess baseline organisation and also initiated pre-I data collection; site randomisation took place after all interviews were completed.18 Post-I was defined as the 12 months immediately following active-I. Secondary outcomes included nine other JC and VHA stroke indicators. Numerator and denominator definitions for these indicators were based on the JC definitions in 2010, except for NIHSS assessment (a VHA indicator). We defined NIHSS eligible patients as any patient with hospital stay >1 day, and NIHSS passing as having a documented NIHSS score (total score only or individual elements) within 1 day of admission. We constructed two prespecified secondary outcome measures representing overall quality of care: a composite indicator (number of passes divided by the number of opportunities) and a measure of defect-free care (a dichotomous variable indicating whether a patient received all indicated processes of care).
Analyses
The unit of analysis for this study was the stroke admission; thus, readmissions for a new stroke were included. We compared intervention and control site baseline data using Student's t tests and χ2 tests. We also computed stroke team members’ site-level baseline mean self-ratings of the quality of stroke care (10-point Likert scale with 0=the worst care possible and 10=the best care possible). We calculated a baseline intraclass correlation coefficient (ICC) for the composite measure of the two primary outcomes as described above. We calculated unadjusted estimates of performance on the two primary outcomes in the pre-I, active-I and post-I periods. We estimated the OR with 95% CI of pre-I to active-I and pre-I to post-I improvement, and calculated the ratio of ORs (with 95% CI) for intervention compared with control sites’ improvement.
To estimate the effect of the intervention, we constructed separate mixed-effect logistic models of the DVT and dysphagia indicators comparing pre-I to active-I and pre-I to post-I. We included time, group, age, race, NIHSS score, baseline data collection programme, baseline indicator performance and time–group interaction (the independent measure of the intervention effect). A random intercept was included to model within-hospital correlation. Similarly, we constructed models of the overall composite quality score (a linear model) and a defect-free model (a logistic model), adjusting for the same independent variables. The logistic mixed-effect models (or generalised linear mixed-effect model for logistic regression) allowed for the analysis of cluster-randomised data, as well as the repeated measures. All analytic assumptions were verified and all analyses were performed using SAS V.9.3 (SAS Institute, Cary, North Carolina, USA).
Results
Patient and site characteristics are summarised in table 1. Patients with stroke at intervention sites were slightly younger compared with control sites. Annual stroke admission volume, length of stay, baseline self-rating of stroke care, baseline indicator passing rates and composite measures of quality were similar in intervention and control sites. The baseline ICC for DVT and dysphagia was 0.043 and 0.128, respectively.
Baseline characteristics
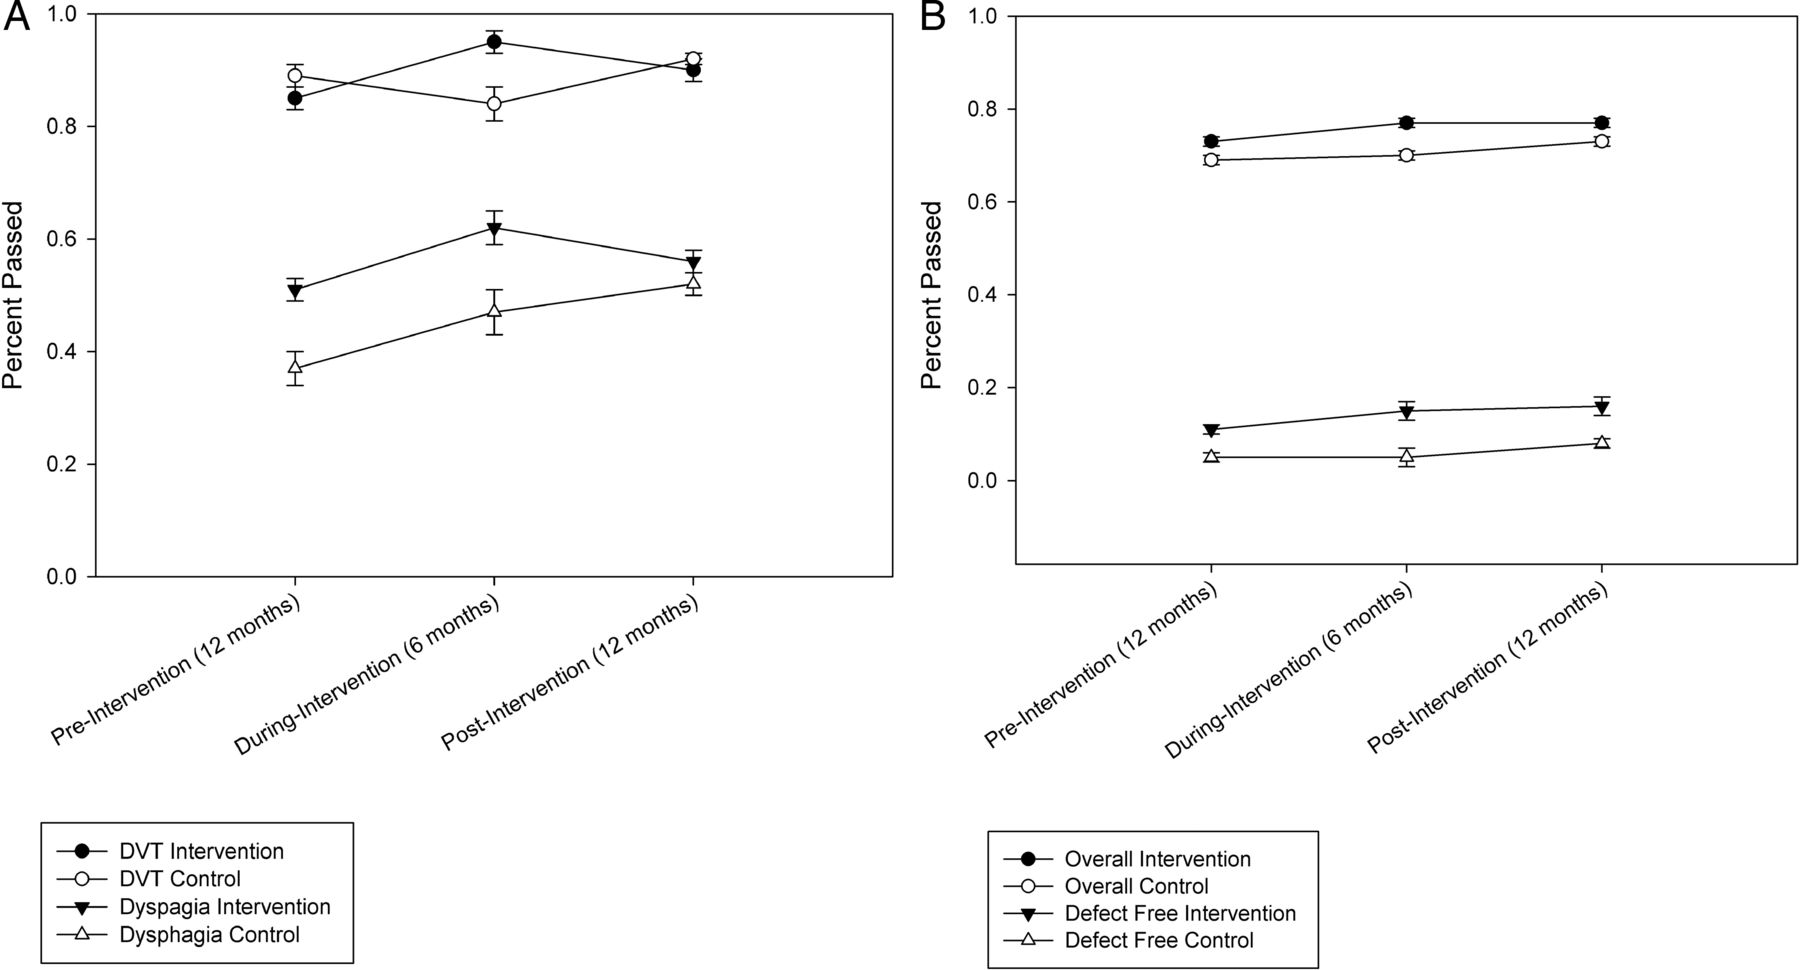
Odds of improvement over the specified time periods for the two primary outcomes and the two secondary outcomes are shown in table 2, and a visual depiction of performance rates over time is shown in figure 3. Data on the other nine indicators are available in online supplementary table S1, and individual site performance on the two indicators is shown in the online supplementary figure. Intervention sites significantly improved DVT performance during the active-I period (OR 3.38, p 0.002), and this improvement was significant compared with control sites (ratio of OR 4.90, p 0.001). However, intervention and control site improvement was similar pre-I to post-I (ratio of OR 1.02, p 0.97). For dysphagia, intervention and control sites had significant and similar improvement during the active-I period, but only the control sites had continued improvement post-I (ratio of OR 0.67, p=0.04). On the composite quality measure, intervention sites showed significant improvement in both time periods, while control sites showed significant improvement in the post-I period only. Defect-free care was significantly improved in only the intervention sites in the post-I period. Overall, however, improvements were not significantly different between intervention and control sites in either period.
Odds of indicator improvement between time periods
Quality indicator and composite quality performance in pre-implementation, during implementation and post-implementation periods. (A) Shows estimates and SE bars for DVT and dysphagia performance; (B) shows estimates for overall composite quality and defect-free care. DVT, deep vein thrombosis.
Multivariate models of DVT and dysphagia performance are shown in table 3. Similar models of the secondary quality outcomes are given in online supplementary table S2. The main intervention effect (time–group interaction) was independently positively associated with DVT performance during the active-I period and was negatively associated with dysphagia performance during the post-I period. Time and baseline indicator performance were consistently and positively associated with performance on the individual and the composite indicators.
Models of DVT and dysphagia indicator improvement
Discussion
This study demonstrates that, in hospitals agreeing to participate in a quality improvement intervention study, a 6-month programme including quality improvement training and external facilitation, plus stroke indicator feedback may be effective in rapidly boosting performance but this effect may not sustain post-intervention and may differentially impact different quality indicators. Although intervention sites improved DVT performance significantly more than control sites during the active-I phase, no difference was seen during the post-I period. This difficulty in sustaining performance beyond the period of primary programme activity is well documented in the quality improvement literature and requires foundational organisational culture change and not simply time-limited, focused activities.19–22 Ongoing participation in the GWTG Stroke programme has been associated with sustained improvements in stroke indicator performance, with time in the programme independently associated with odds of delivering high-quality care; however, what specific programme or hospital contextual elements are driving this improvement is not known.5
Our finding that baseline performance was positively associated with quality improvement adds to the mixed results reported in studies examining the influence of baseline performance on the success of quality improvement collaboratives.23 Poorer baseline performance would suggest a theoretical greater capacity for improvement; however, for complex care processes such as acute stroke care, clinical teams which have begun to engage in high-quality care at baseline may be more likely to continue to improve over time. The degree to which other characteristics of the teams including their mutual respect, team functioning and ratings for implementation climate may also be associated with baseline performance and with improvement over time will be explored in ongoing mixed methods analysis that includes our baseline qualitative data.
An unexpected finding was that control sites in this study were significantly more likely to improve on dysphagia screening post-I compared with intervention sites. The possible explanation for this result is complex but may relate to the unanticipated national VHA Stroke Directive that included a mandate for all VAMCs to measure dysphagia screening in patients with stroke. This directive was released to the field in November 2011, and response was required by June 2012, a time period that overlapped with the post-I period of this study. Thus, control sites, who did not receive the quality improvement training but who had been receiving dysphagia indicator feedback, may have been spurred to additional efforts to improve dysphagia care. This is an example of the type of external influence that may unpredictably influence behaviour and is difficult to account for in quality improvement trials.
We also found that, in general, performance on most of the indicators and on the overall quality measures improved over time, and both time and baseline performance were independently associated with overall quality. Interestingly, NIHSS scores were positively associated with dysphagia screening throughout the study, meaning that patients with more severe stroke were more likely to have dysphagia screening completed before oral intake than less severely affected patients. One possible explanation is that patients with more severe stroke may have greater early attention focused on their care; thus, some individual processes of care may be better attended to than in patients with milder stroke. Moreover, stroke severity may be associated with earlier and/or greater likelihood of involvement from a neurologist or with admission to a designated stroke unit, which could increase the likelihood of receiving consistent high-quality stroke care as suggested by findings in other stroke quality improvement studies.9 ,10
This study joins relatively few other cluster-randomised trials of quality improvement interventions in stroke, and also is one of the few to compare intervention effects over time as the intensity of the intervention is reduced. Our data show that the quality improvement training and external facilitation were associated with more rapid improvements in DVT performance and to a lesser degree for overall stroke care quality. This suggests that in areas where rapid improvement is needed, a more intensive quality improvement programme may be beneficial over indicator feedback alone, and also may suggest that response to a collaborative-based intervention may be greater for simpler indicators or for those in which a clear geographical unit or responsible party is identified. This hypothesis has been suggested by other investigators9 and could be a possible explanation for our observation that DVT performance demonstrated initial improvement in the intervention group while dysphagia screening (a more complex and less uniformly implemented measure) did not.
Our data also show that the effect of an intense external intervention may not sustain after it is withdrawn, suggesting that additional intervention or a longer period of active facilitation may be necessary if continued improvement is desired. A single-site study using a Six Sigma approach to improve door-to-needle times, however, has shown sustained improvements over time, suggesting that sustainability may also be more achievable in a single hospital setting rather than across a hospital system.24 As in other studies, our data confirm the smaller but significant and sustained effect of data feedback alone to improve performance, especially in sites that are organised and motivated to change and when external system mandates for improvement exist, although in a qualitative analysis of response to data sharing in collaboratives, not all participants find benchmarking of data to be a positive experience.25 Although more work to tease out the differential effects of various implementation strategies on specific types of indicators is needed, our finding that time and baseline performance were most consistently associated with early and sustained improvement suggest that these factors should be clearly documented and included when evaluating the effect of any new quality improvement programme.
Our study has several limitations, including the unique characteristics of VHA hospitals with generally lower stroke admission rates, mainly male patients, and lower stroke severity than are included in other US stroke quality registries. Like other quality improvement studies, we enrolled hospitals willing to participate, so the impact of this intervention on less-motivated hospitals is not known. Unlike some other studies, we did not combine indicators into ‘care bundles’ and we did not have the individual site teams collect their own performance data (based on their preferences at the time of study initiation); the extent to which these factors influenced study results is unknown. Although we expect that improvement over time may have been occurring in other VHA facilities as a result of the National Directive, our study did not plan to collect chart review data from non-study facilities in order to be able to assess temporal trends in non-participating facilities.
Despite these limitations, this study provides a rigorous design for investigating the implementation strategies of collaborative-based quality improvement training programme to indicator feedback alone and for examining the initial impact and sustainability of a quality improvement intervention using team-based training and external facilitation. Our study suggests that rapid initial improvement can result from this type of intensive intervention, but that improvements are not likely to sustain without some additional period of ongoing intervention. This effect has been demonstrated in manufacturing and healthcare studies, for example, where organisational elements such as learning and stewardship culture have been identified as key predictors of sustained transformation.26 ,27 Ongoing work from this project will attempt to analyse whether qualitative assessments of organisational culture during and after this intervention are similarly related to sustained effects of stroke care improvements. If we think of the hospital system in the same way as we do a patient with a chronic medical condition requiring ongoing intervention, assessment and management, the realisation that sustained improvement requires some ongoing effort in an environment supportive of change should not be surprising. Just as we investigate characteristics of the patient, provider, intervention and environment in studies of chronic disease management, we also need to further investigate the intensity, timing and culture required to implement and sustain programmes that can lead to ongoing improvements in healthcare and patient outcomes.
References
Supplementary materials
Supplementary Data
This web only file has been produced by the BMJ Publishing Group from an electronic file supplied by the author(s) and has not been edited for content.
- Data supplement 1 - Online figures
- Data supplement 2 - Online tables
Footnotes
Contributors All authors meet the three criteria: (1) substantial contributions to conception and design and/or analysis and interpretation of data; (2) drafting the article or revising it critically for important intellectual content; and (3) final approval of the version to be published.
Funding Support for industrial engineers in this study was provided by the VA Center for Applied Systems Engineering. Project funding was provided by the VA HSR&D Quality Enhancement Research Initiative (grant no. SDP 09-158 and STR 03-168).
Competing interests None declared.
Ethics approval Local institutional review boards at each participating facility.
Provenance and peer review Not commissioned; externally peer-reviewed.
Data sharing statement Data sharing from this study is available for de-identified data to the extent allowed by the Veterans Health Administration and its research policies.