Article Text

Abstract
Objective To identify factors that influence the intentions of health professionals to improve their practice when confronted with clinical performance feedback, which is an essential first step in the audit and feedback mechanism.
Methods We conducted a theory-driven laboratory experiment with 41 individual professionals, and a field study in 18 centres in the context of a cluster-randomised trial of electronic audit and feedback in cardiac rehabilitation. Feedback reports were provided through a web-based application, and included performance scores and benchmark comparisons (high, intermediate or low performance) for a set of process and outcome indicators. From each report participants selected indicators for improvement into their action plan. Our unit of observation was an indicator presented in a feedback report (selected yes/no); we considered selecting an indicator to reflect an intention to improve.
Results We analysed 767 observations in the laboratory experiment and 614 in the field study, respectively. Each 10% decrease in performance score increased the probability of an indicator being selected by 54% (OR, 1.54; 95% CI 1.29% to 1.83%) in the laboratory experiment, and 25% (OR, 1.25; 95% CI 1.13% to 1.39%) in the field study. Also, performance being benchmarked as low and intermediate increased this probability in laboratory settings. Still, participants ignored the benchmarks in 34% (laboratory experiment) and 48% (field study) of their selections.
Conclusions When confronted with clinical performance feedback, performance scores and benchmark comparisons influenced health professionals' intentions to improve practice. However, there was substantial variation in these intentions, because professionals disagreed with benchmarks, deemed improvement unfeasible or did not consider the indicator an essential aspect of care quality. These phenomena impede intentions to improve practice, and are thus likely to dilute the effects of audit and feedback interventions.
Trial registration number NTR3251, pre-results.
- Audit and feedback
- Quality improvement
- Decision making
Statistics from Altmetric.com
Introduction
Healthcare organisations increasingly adopt audit and feedback (A&F) strategies to monitor and improve their quality of care.1–3 A&F interventions provide health professionals with an objective summary of their clinical performance over a specified period of time4; typically on a set of quality indicators derived from clinical guidelines or expert opinion. Despite the widespread use of A&F interventions and the inherent efforts and costs put into their development and application, they show variable effectiveness on improving quality of care: a Cochrane review reported a median 4.3% absolute improvement (IQR 0.5%–16%), with only a quarter of the studies showing a strong positive effect.4
A&F appears to be most effective if provided by a supervisor or colleague, more than once, both verbally and in writing, if baseline performance is low, and if it includes explicit targets and an action plan.4–7 Other suggested effect modifiers are the perceived quality of the underlying data, recipients' motivation to change, organisational support for quality improvement8 and how benchmarks are derived.9 The value of identifying potential modifiers notwithstanding, previous studies have not helped us understand the mechanisms through which A&F influences quality of care.10 Reviews attempting to deepen this understanding have equally failed to do this because most A&F studies were designed without explicitly building on extant theory.11–14
According to control theory, feedback prompts its recipients to take action when their current clinical performance does not meet a predefined standard.15 When A&F is ineffective, this must therefore be the result of either an information–intention gap (feedback fails to convince its recipients that change is necessary), an intention–behaviour gap (intentions are not translated into action) or a behaviour–impact gap (actions do not yield effect). To the best of our knowledge, there has been no research investigating these steps in A&F separately within the context of healthcare quality improvement, and electronic A&F interventions provide novel opportunities to address this. In particular, they can be used to investigate the information–intention gap by recording whether, and under which circumstances, feedback sets intentions to change.
Therefore, the aim of our study was to identify what are feedback-related determinants of health professionals' intentions to improve their practice when confronted with feedback on clinical performance. The context of our study was an electronic A&F intervention targeting improvement of cardiac rehabilitation (CR) in the Netherlands.16
Methods
Theoretical framework
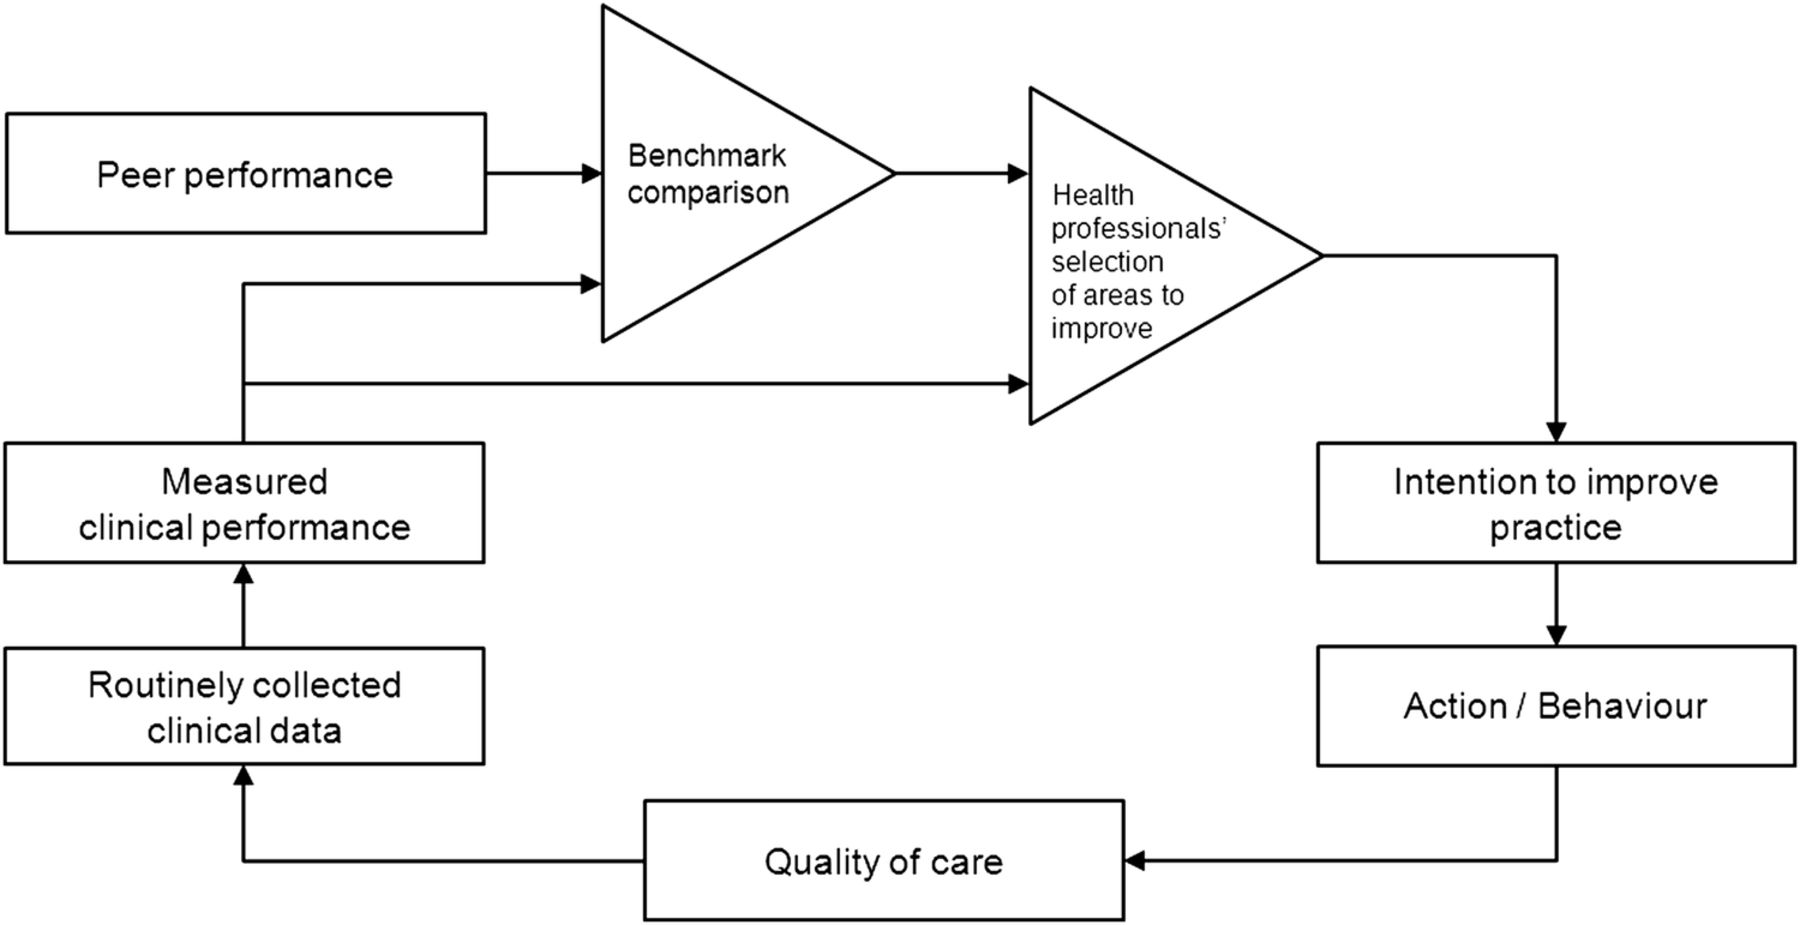
Feedback loops have been studied by mathematicians, engineers and behavioural scientists, typically building on control theory. It provides a basis for understanding the dynamic behaviour of a system or a person in response to a performance–benchmark comparison.15 Figure 1 depicts control theory, adapted to present the improvement cycles that A&F interventions aim to facilitate. It assumes that A&F prompts health professionals to improve practice when observing a discrepancy between their performance and the benchmark, and that it will continue to prompt quality improvement actions until the discrepancy has been solved. Hence, control theory predicts that—in order for A&F interventions to be effective—feedback recipients should focus their improvement efforts on areas for which their performance is low compared with the benchmark.

The audit and feedback cycle; adapted from control theory.15
Study design
The first part of our research consisted of a laboratory experiment. It was conducted under controlled conditions with individual professionals working in CR in the Netherlands. The experiment aimed to minimise the influence of organisational and social context on participants' intentions to improve practice when confronted with feedback. The second part of our research was a study in clinical practice among multidisciplinary CR teams (‘field study’). It involved a secondary analysis of data on 14 847 patients from 18 centres collected during a cluster-randomised controlled trial, which evaluated an electronic A&F intervention in Dutch CR (see box 1, figure 2).16 In both the laboratory experiment and field study we investigated the same feedback-related factors.
Description of the clinical setting and the electronic audit and feedback intervention
Clinical setting
Cardiac rehabilitation (CR) is a multidisciplinary outpatient therapy to support patients with coronary heart disease recovering from a cardiac incident, and aims to improve their overall psychosocial and physical condition.36 It is offered by multidisciplinary teams that generally include cardiologists, physical therapists, nurses, psychologists, dieticians and social workers.
Intervention
The intervention was evaluated in a cluster-randomised trial among 18 CR centres in the Netherlands. It consisted of four quarterly feedback reports in combination with educational outreach visits. Centres were randomized to receive performance feedback on indicators concerning either psychosocial or physical rehabilitation. Feedback reports were available through a web-based feedback system.37 During the outreach visits, local quality improvement teams used the system to review their performance and to develop an action plan. They selected indicators for improvement and formulated concrete actions and goals linked to selected indicators. During the subsequent outreach visit (ie, the next audit and feedback (A&F) iteration) teams reviewed new feedback and updated their action plan accordingly.
Feedback reports consisted of performance scores on 11 (study group A) or 12 (study group B) quality indicators for CR, accompanied by ‘traffic light’ coloured icons to represent the benchmark category (green=high performance; yellow=intermediate performance and red=low performance); a screenshot is available in figure 2. The set of indicators was developed in close collaboration with a panel of CR professionals.23 To determine scores on the indicators, data were automatically extracted from an electronic health record used at the point of care. Benchmark categories were determined by comparing the centre's performance with the performance of other centres, following the concept of achievable benchmarks9 as shown in table 3. In case a centre submitted insufficient data to calculate the score for a specific indicator, the feedback report lacked a score and showed a grey icon. Clicking on an indicator revealed how the score and benchmark category were determined. In the current study, we focused on 18 process and outcome indicators that reflected binary measures at patient level. Performance scores therefore took values between 0% and 100%.16

Example report in the web-based feedback system with performance scores (percentages) and colours (green or yellow checkmark, red exclamation mark or grey icon) on 18 quality indicators. The checkboxes in the right column under ‘Select for improvement?’ represent the measured outcome in this study. CR, cardiac rehabilitation.
Participants
For the laboratory experiment, we invited all CR professionals who originally participated in the trial (n=132). They received a personalised email with up to two reminders after 2.5 and 5 weeks. For the field study, we analysed the data generated by the 18 participating CR teams during the trial.
Procedure for the laboratory experiment
Participants in the laboratory experiment were shown two reports, which we randomly selected from the 50 reports generated during the trial (see box 1, figure 2). The two reports were presented in the web-based feedback system as concerning a ‘virtual’ CR centre. We asked participants to select indicators for the virtual centre's action plan. Not selecting an indicator for which performance was benchmarked ‘low’ or ‘intermediate’ prompted a question asking participants to explain their choice. We provided the following predefined reasons: ‘not a relevant aspect of quality of CR’; ‘improvement is not feasible’ and ‘indicator score is high enough’.17 Similarly, we asked for an explanation if they selected an indicator for which performance was ‘high’, with predefined reasons being: ‘essential aspect of quality of CR’; ‘easy to improve’ and ‘indicator score is too low’. If none of these statements applied, participants could state their reason in free text.
Outcome of interest
Our outcome of interest was whether health professionals had the intention to improve a particular performance score or not. As described in box 1, recipients of the A&F intervention selected quality indicators from a feedback report into an action plan. We defined our outcome measure as “whether or not the indicator was selected for improvement”. Therefore, our unit of observation was an indicator presented in a particular feedback report.
Statistical analysis
We performed mixed-effects logistic regression analyses to determine the association between feedback-related factors and whether or not indicators were selected for improvement. First, we constructed univariate models for each factor while the other variables were considered for inclusion as confounder.18 We evaluated factors associated with quality indicators themselves (type of indicator), clinical performance (data availability, score, above or below benchmark value) and iteration of the A&F cycle, while adjusting for characteristics of participating professionals and teams. Because the centre type and size displayed strong collinearity, we omitted centre size when both variables were identified as potential confounder. For all fixed effects, we calculated ORs and 95% CIs.
To account for clustering effects due to correlations between observations on the same quality indicator (some indicators may be generally preferred to others), the same participant (some professionals (laboratory experiment) or teams (field study) may select more indicators than others), the same feedback report (in a report showing (almost) only ‘low performance’ indicators, a lower percentage of those indicators may be selected than a report showing only a few ‘low performance’ indicators) and the same CR centre (laboratory participants from the same centre may have similar preferences), we added random intercepts for these clusters in all our regression models. We calculated the marginal and conditional R2 for the full models (ie, all fixed and random effects included).19 To determine whether there were systematic differences between clusters (eg, Are some indicators systematically more often selected than others? Do some professionals select more indicators than others?), we compared the full model with a model where we left out the random effect of interest using analysis of variance. All analyses were performed using R V.3.1.2 (R Foundation for Statistical Computing; Vienna, Austria).
The analyses were performed on the complete cases, that is, leaving out indicator values for which no performance score or benchmark comparison was available due to incomplete data. Additionally, we performed similar analyses on the full set of indicator values while leaving out the performance score as covariate to estimate the impact of data incompleteness (‘full data set analysis’, see online supplementary appendix A). Finally, by means of sensitivity analysis in the field study, we repeated the analyses on only the first A&F iteration data (ie, intentions formed based on a centre's first feedback report).
Supplementary appendix
Results
Forty-one CR professionals (response rate, 31%) accepted our invitation and participated in the laboratory experiment. The majority were CR nurses and physiotherapists, had a coordinating function, and reported to spend more than half of their time on direct patient care (table 1). At the time of the experiment, they had attended on average two outreach visits in the field study. Two of the 18 CR centres in the field study were not represented in the laboratory study sample. In the field study, almost all centres received four outreach visits, with one non-teaching hospital receiving three. On average, quality improvement teams counted seven members (range 3–13). They were always part of a centre's larger CR team, which consisted of between six and 16 professionals.
Participant characteristics of the laboratory experiment (CR professionals) and field study (CR centres)
Feedback reports
Professionals in the laboratory experiment and teams in the field study evaluated 82 and 71 feedback reports, respectively. At the time of the laboratory experiment, teams in the field study had evaluated a total of 50 reports (average per team, 2.8; range, 1–4). From these, 40 randomly selected reports were used in the laboratory study, and each evaluated by one to four professionals. They contained 767 observations of 18 unique indicators; 603 (79%) concerned process indicators and 164 (21%) outcome indicators. For 437 observations (57%) a performance score lacked due to incomplete data. The remaining 330 observations had a mean score of 68.2% (SD, 25.0%). The field study reports included a total of 614 observations; 525 (86%) process indicators and 89 (14%) outcome indicators, of which 152 (25%) had incomplete data. The remaining 462 values had a mean score of 61.9% (SD, 31.5%). The distribution of benchmark categories varied substantially between indicators: performance on some indicators was never benchmarked as ‘low’, while for others it was never ‘high’ (see online supplementary appendix B).
Determinants of intentions to improve practice
Laboratory experiment
Individual professionals selected an average of 75% (range, 52%–100%) of all indicators in each feedback report. In the complete case analysis (table 2), we found that each 10% decrease in performance score increased the probability of selection by 54% (OR, 1.54; 95% CI 1.29 to 1.83). In addition, the benchmark comparison showed a strong influence, even after adjusting for score (low vs high performance: OR, 12.04; 95% CI 1.33 to 108.90; intermediate vs high performance: OR, 23.15; 95% CI 6.96 to 76.95). Nevertheless, participants ignored the benchmark comparison in 88 (27%) cases; they did not select 55 (34%) indicators with low or intermediate performance scores, and did select 33 (19%) that were benchmarked as high performance. Indicator type (process or outcome) was not associated with improvement intentions. The full model explained 61.3% of the total variance (conditional R2), of which 34.7% was explained by fixed effects alone (marginal R2). A significant amount of the unexplained variance was attributed to the random effect for CR professional (16.0%, p=0.006), indicating that the number of selected indicators varied substantially between participants, even after correcting for potential confounders. The full data set analysis (see online supplementary appendix A) revealed that indicators without scores (incomplete data) were always selected.
Results of sequential logistic regression analyses to evaluate factors that influence intentions to improve practice
Field study
CR teams selected an average of 39% (range, 0%–100%) of all indicators in each feedback report; on average 1.7 times less process indicators and 4.8 times less outcome indicators compared with the laboratory experiment. The complete case analysis (table 2) again showed lower scores to increase the probability of selection (OR, 1.25; 95% CI 1.13 to 1.39 per 10% decrease in score). However, benchmark comparisons did not have additional influence (low vs high performance: OR, 0.64; 95% CI 0.10 to 4.34; intermediate vs high performance: OR, 1.42; 95% CI 0.55 to 3.70). Teams ignored 156 (34%) of the benchmarks by not selecting 109 (48%) indicators reflecting low or intermediate performance, and by selecting 47 (20%) reflecting high performance. The analysis further revealed that indicators that had been selected during a certain A&F iteration were 10 times more likely to be reselected in the subsequent iteration than indicators that had not (OR, 10.22; 95% CI 4.98 to 20.98); each iteration was associated with a decrease in selection probability of 54% (OR, 0.46; 95% CI 0.32 to 0.66). The researcher who conducted the outreach visits observed that indicators were often reselected because improvement actions had not yet been completed. The full model explained 50.4% of the total variance, of which 37.9% was explained by the fixed effects alone. The random effect for indicator accounted for 5.8% (p=0.004) in this difference, indicating that some indicators were more often selected than others; again independent of score, colour, indicator type and other confounders. The full data set analysis (see online supplementary appendix A) revealed that indicators for which data were incomplete were more likely selected than those benchmarked as high performance (OR, 4.13; 95% CI 2.08 to 8.16). In addition, it showed that outcome indicators were less likely to be selected than process indicators (OR, 0.34; 95% CI 0.14 to 0.86). This was especially true in case of incomplete data: 59% of the 115 process indicators without a score were selected, as opposed to only 16% of the 37 outcome indicators without a score. Sensitivity analyses of only first A&F iteration data showed similar findings.
Reported reasons for (lack of) intention to improve practice in the laboratory experiment
Participants' main reasons for not selecting indicators with low or intermediate performance scores were that they reckoned the score was high enough (n=16, 29%; 14 ‘intermediate’ and two ‘low’ indicators), and that improving the indicator was not feasible (n=14, 25%). Furthermore, they thought that improving the indicator lacked priority (n=14, 25%), or did not represent a relevant quality aspect of CR (n=8, 15%).
The main reason for participants to select an indicator reflecting high performance was that they considered the indicator an essential aspect of CR care quality, and should thus belong in every quality improvement plan (n=27, 82%). All other reasons were selected in <10% of cases.
Discussion
Following our study findings, we identified four mechanisms of how A&F influences professionals' intentions to improve their practice. This contributes to our understanding of how we can minimise the information–intention gap in order to increase the effectiveness of A&F interventions.
Measured clinical performance and benchmark comparisons influence professionals' intentions to improve practice
We found that professionals tend to select indicators that reflect low performance. This is in line with a Cochrane review showing that A&F is more effective if baseline performance is low.4 In addition, our findings from the laboratory experiment suggest that benchmark comparisons in feedback reports might trigger intention more strongly than the underlying performance scores. The comparisons in our intervention were colour-coded using a traffic light colour scheme. Coloured icons are commonly used to present performance information in feedback reports and quality dashboards20 and have previously been shown to influence decision-making.21 ,22
Professionals have their own view of what constitutes quality of care
Health professionals ignored between a third (laboratory experiment) and half (field study) of benchmark comparisons when selecting indicators into their action plan. Participants particularly indicated that they did not select indicators reflecting low or intermediate performance because they disagreed with the benchmark, deemed improvement unfeasible or lacking priority or did not consider the indicator an essential aspect of care quality. Also, we found that the number and type of selected indicators varied strongly between individuals. Our analyses did not reveal any systematic professional-level factors that may explain this variation. Hence, our results strongly suggest that individuals had their own opinions about quality, and that these opinions differed from the external recommendations imposed by the benchmarks. This variation in personal preferences widens the information–intention gap and reduces the potential of A&F interventions to improve healthcare quality. More specifically, it implies that A&F may be met with some disagreement by its recipients, even if the underlying indicators have been developed using established methods.23 For example, because no single benchmark algorithm can set targets that are perceived as both desirable and achievable by all recipients. Also, the more indicators are advised for improvement, the more competing priorities come into play, resulting in more indicators not selected despite being benchmarked as low performance.24 ,25
We found more variation in intentions among individuals than among teams; differences in personal opinions about quality and performance target values were apparently dissolved when discussed within the teams. Furthermore, teams in the field study systematically selected fewer indicators for improvement than individuals in the laboratory experiment. This may be attributed to practical and organisational barriers in the real world causing professionals' improvement intentions to be more conservative.26 ,27 A third difference was that in the field study outcome indicators were less often selected than process indicators. This concurs with van der Veer et al's8 systematic review which found that feedback is more likely to improve care processes than patient outcomes. It is conceivable that outcomes were perceived as being more difficult to change because they were beyond the direct control of professionals.28 Apparently, these barriers were less important in the laboratory environment, and mainly arose when devising a plan for action in real-world settings.
Improvement intentions tend to remain similar in subsequent A&F iterations
In the field study, teams received a new feedback report each three-monthly A&F iteration; they used it to create or update their action plan. Indicators selected into an action plan once were very likely to be selected into the next plan. One plausible explanation is that specified actions had not yet yielded the desired outcome after one iteration. Underlying causes may include not knowing the root problem, or lack of guidance on how to address it. This suggests that quality improvement may progress slowly, providing another potential explanation of why many A&F studies have reported limited effects.
Professionals give priority to improving data quality
Data quality issues often lead to gaps in the image of clinical performance that A&F interventions present. In our study, we reported no score and showed a grey icon for indicators with insufficient available data; we found that such indicators were often targeted for improvement. This concurs with earlier research describing that optimising data quality is usually the first step before other improvement actions are taken28 ,29; this is supported by qualitative evaluations suggesting A&F increases availability and quality of data.30 ,31 Using A&F to work on quality of data rather than quality of care implicates dilution of the measurable effects of A&F interventions.
The role of theory in our study
Theory-based approaches add to the understanding of the feedback mechanism, but are scarcely used.10 ,14 Colquhoun et al13 found that 20 out of 140 studies (14%) from the Ivers review4 reported use of theory in any aspect of the study design, measurement, implementation or interpretation. Overall, a total of 18 different theories were identified, spanning educational, psychological, organisational and diffusion of innovation perspectives on A&F; no theory was used in more than five studies. In our opinion, the large variation in theories that are used in this field reflects the complex, multifaceted nature of quality improvement interventions. While some theories focus on adoption of interventions across established social networks (eg, Diffusion of Innovations32), others focus on the behavioural aspects of A&F interventions (eg, Social Cognitive Theory33) or their organisational context (eg, Lawler's Organization Theory34). Our work was informed by control theory15 and has confirmed a specific hypothesis of that theory, namely that health professionals' improvement intentions will be steered by feedback messages indicating substandard clinical performance. We should emphasise that neither control theory nor our work makes any assumptions regarding other aspects of A&F interventions, such as their social or organisational dimensions. Although those dimensions are also relevant to explaining causal pathways in the A&F mechanism, they fall beyond the scope of our study. Similarly, our study does provide empirical evidence for Feedback Intervention Theory,17 which builds on the control theory's central mechanism and includes other aspects that did not play a role in our study.
Strengths and limitations
The large majority of previous quantitative studies evaluated two-arm trials of A&F interventions against usual care without further exploring the underlying mechanism of feedback; essentially treating the feedback intervention as a ‘black box’. To our knowledge, we are the first to evaluate the underlying mechanism—specifically the information–intention gap—quantitatively by exploiting the electronic nature of an A&F application. Furthermore, we conducted our study in a laboratory setting that mimicked clinical practice as much as possible, for example, by confronting the same professionals with similar feedback reports, presented in the same web-based application. Laboratory experiments in this field are scarce at best, but yield new insights into professionals' decision processes in addition to studies in clinical practice alone.
Due to a lack of data at the start of the study, we applied a relatively simple method to determine benchmark categories (see table 3). This limits the generalisability of our findings to A&F interventions that use more sophisticated methods, such as achievable benchmarks of care.9 Furthermore, there were three design differences between the laboratory and the clinical setting in our study: individual professionals versus multidisciplinary teams, laboratory setting versus clinical practice and no further support versus educational outreach visits. Therefore, we cannot attribute any discrepancies in findings to one particular design difference. Also, participants in the laboratory experiment may have been a selective, more motivated sample of those participating in the field study. This may have caused a higher number of indicators on which participants intended to improve in the laboratory experiment. Next, laboratory participants may have been more likely to choose a predefined reason for (not) selecting an indicator, rather than using the free-text field. This may have limited the spectrum of potential reasons for a (lack of) intention to improve performance. Finally, even though we instructed laboratory participants to treat the feedback reports as if they concerned a virtual centre, they may have unwittingly been influenced by their previous experiences in the field study. This potentially disrupted individuals' true personal preferences for setting improvement goals.
Decision rules applied in the A&F intervention for assigning benchmark categories to indicators based on a centre's performance score (performance) and the average peer performance (benchmark)
Unanswered questions and future research
A large number of qualitative studies have been published that investigate the mechanisms through which A&F interventions achieve change. A qualitative evidence synthesis could strengthen the interpretation of our findings.35 Future research could focus on exploring (1) the influence of latent structures in the indicator set (eg, indicators reflecting processes or outcomes of care that share clinical features) on observed intentions, and (2) the extent to which the influence of performance scores and benchmark comparisons depends on recipients' attitudes toward improvement (eg, perceptions of importance and feasibility). Furthermore, the fact that feedback recipients intend to improve practice does not mean that improvement is actually achieved: future research should investigate mechanisms for translating intentions into effective action.
Conclusion
When confronted with clinical performance feedback, performance scores and benchmark comparisons influenced health professionals' intentions to improve their practice. However, these intentions varied substantially because professionals disagreed with benchmarks, deemed improvement unfeasible or did not consider the indicator an essential aspect of care quality. Furthermore, in real-world settings improvement goals were often reselected because improvement actions were not yet completed, and professionals gave higher priority to improving data quality than to improving care. All these phenomena create a gap between providing feedback and developing intentions to take action, and hence likely dilute the effects of A&F interventions on quality of care.
References
Footnotes
Contributors WTG, SNvdV, MMvE-V and NP designed the study, with additional support from NFdK. WTG analysed the data with support from NP. All authors were involved in data interpretation. WTG wrote the first draft of the manuscript, which was then critically reviewed and revised by the other coauthors. All authors approved the final version of the manuscript for submission.
Competing interests None declared.
Provenance and peer review Not commissioned; externally peer reviewed.