Article Text

Abstract
Background Many emergency admissions are deemed to be potentially avoidable in a well-performing health system.
Objective To measure the impact of population and health system factors on county-level variation in potentially avoidable emergency admissions in Ireland over the period 2014–2016.
Methods Admissions data were used to calculate 2014–2016 age-adjusted emergency admission rates for selected conditions by county of residence. Negative binomial regression was used to identify which a priori factors were significantly associated with emergency admissions for these conditions and whether these factors were also associated with total/other emergency admissions. Standardised incidence rate ratios (IRRs) associated with a 1 SD change in risk factors were reported.
Results Nationally, potentially avoidable emergency admissions for the period 2014–2016 (266 395) accounted for 22% of all emergency admissions. Of the population factors, a 1 SD change in the county-level unemployment rate was associated with a 24% higher rate of potentially avoidable emergency admissions (IRR: 1.24; 95% CI 1.04 to 1.41). Significant health system factors included emergency admissions with length of stay equal to 1 day (IRR: 1.20; 95% CI 1.11 to 1.30) and private health insurance coverage (IRR: 0.92; 95% CI 0.89 to 0.96). The full model accounted for 50% of unexplained variation in potentially avoidable emergency admissions in each county. Similar results were found across total/other emergency admissions.
Conclusion The results suggest potentially avoidable emergency admissions and total/other emergency admissions are primarily driven by socioeconomic conditions, hospital admission policy and private health insurance coverage. The distinction between potentially avoidable and all other emergency admissions may not be as useful as previously believed when attempting to identify the causes of regional variation in emergency admission rates.
- health services research
- ambulatory care
- emergency department
Statistics from Altmetric.com
Background
Since the early 2000s, countries such as England, Wales and Northern Ireland have experienced increases in emergency admissions to acute hospitals.1 2 Over the past 10 years in Ireland, emergency admissions have increased by almost 1000 per annum from 32 000 in 2005 to 41 500 in 2016.3 As of 2016, emergency admissions accounted for approximately one in four of all hospital admissions.3
Potentially avoidable emergency admissions have been deemed indicative of health system performance.4–6 These admissions may occur due to an exacerbation from an underlying condition, in which case the admission may have been preventable if the appropriate management of the condition was observed. For example, it has been proposed that the risk of emergency admission due to an exacerbation of asthma may be reduced if the condition is monitored by specialist nurses within the primary care system.5 An emergency admission may also be potentially avoidable if the patient could have been treated more appropriately elsewhere, such as in the patient’s home or in a community setting.4 5 The designation ‘potentially avoidable’ refers to a subset of total emergency admissions, and focuses on conditions which are assumed to be sensitive to the quality of primary care management and the availability of alternatives to hospitalisations.5
To understand the drivers of potentially avoidable emergency admissions, it is important to distinguish between population and health system factors.
At a population level, older demographics,7–9 socioeconomic deprivation7 10 11 and rurality10 12 13 are major sources of geographical variation in emergency admissions.
At a health system level, continuity of primary care and barriers to accessing primary care,7 8 including the number of available general practitioners (GPs), have been identified as reasons for regional disparities of emergency admissions within a country.14 Certain hospital-level factors such as the availability of acute beds15 and emergency department (ED) admission procedures16 have also been shown to drive geographical variation in potentially avoidable emergency admissions.
ED practices play an increasing role in admissions for almost all conditions.16 In Ireland, attendance at an ED can occur as a result of a patient’s self-referral or due to the referral of a GP. In addition to need, the use of such services may be motivated by whether the patient or GP believes viable alternative services exist.17 Since 2010, a number of EDs have been reconfigured to urgent care centres, which include medical assessment units (MAUs) and local injury units (LIUs). There are now 10 such centres in Ireland.18 These centres provide an alternative to traditional acute services which are required for serious emergency conditions. In 2016 there were 83 354 attendances at LIUs, representing 6% of all emergency presentations.18 However, this leaves a large majority of emergency presentations still occurring at EDs.
The Organisation for Economic Co-operation and Development (OECD) found that in 2015 Ireland had a high occupancy rate of acute beds: 93.8% in Ireland, compared with an OECD average rate of 84.3%.19 It argued that this was due to an excess of people seeking care and being treated at a secondary care level.19 It strongly recommended a focus on reducing avoidable emergency admissions for those cases that could be treated in a primary care setting.19 Improving primary care services to prevent and manage disease is a key aim of recent government policies and a focus of recent reports.20–22
Service use in Ireland, regardless of condition, may also be driven by eligibility for medical card schemes.4 For example, the General Medical Services (GMS) card allows the use of the majority of health services free of charge, including doctor visits, all inpatient services to public wards in public hospitals and all outpatient services in public hospitals, as well as use of EDs, casualty and outpatient services.23 24 Eligibility for this card is based on income thresholds and consideration of an undue burden of the cost of an illness. In 2016, 68%25 26 of those over 65 years of age were eligible for this scheme.27 The Irish Longitudinal Study on Ageing found that among older adults in poor health, those with a medical card were more likely to have a hospital admission, a GP visit and an ED attendance than those not covered by the GMS or those with medical insurance.28
A factor that has not been fully considered in the Irish context is the role of private health insurance. Ireland’s public hospital system is financed through a mix of both public and private spending. Older adults with private health insurance are more likely to have an overnight stay in a public hospital than those without insurance,29 possibly because it is financially beneficial for public hospitals to keep such patients within the health system for longer. It is suggested that this may also reflect a general lower threshold for a hospital admission for those patients with private health insurance.29
Given the multitude of factors identified by the literature as potentially influencing the level of emergency admissions, this paper aims to explore the population and health system factors that contribute to the county variation in potentially avoidable emergency admissions within Ireland. We also investigate whether the drivers of these emergency admissions differ from those that impact total/other emergency admissions
Methods
Study area
Ireland is a country of 70.2 thousand km² on the west of Europe with a population of 4.8 million as of 2016.26 The smallest geographical area level at which emergency admissions, population drivers of admission and health system factors can be studied is county. There are 26 counties, the populations of which range from 1.3 million in Dublin to 32 000 in Leitrim.26
Admissions data sources
Fourteen conditions derived from consensus work carried out in the UK30 were included in the definition of potentially avoidable emergency admissions. These conditions include non-specific chest pain, chronic obstructive pulmonary disease (COPD), urinary tract infection, non-specific abdominal pain and falls for those over 74 years of age (see online supplementary appendix 1for a full list of conditions). A group of 48 clinicians, researchers and healthcare commissioners identified these conditions as being rich in potentially avoidable emergency admissions, and that such admissions could be reduced by a well-performing health system.30 31 Similar consultation work was undertaken by a study in Ireland32 to ensure that these conditions were applicable to the Irish context. Many of these conditions have also been assessed across a number of international studies of ED attendance and hospital admissions.33–35
Supplemental material
The incidence of emergency admissions for the selected conditions is available from the Irish Hospital In-Patient Enquiry (HIPE) admissions system.3 The county population required to determine admission rates was made available from the Central Statistics Office 2016 Census.26
A priori factors and data sources
Two principal studies were identified as the most appropriate for considering drivers of potentially avoidable emergency admissions in Ireland, one based in Ireland4 and one in the UK.5 A priori factors were chosen from these studies and other literature, and adapted for the Irish context (see table 1 and online supplementary appendix 2 for factor construction).
A priori factors considered for inclusion in the analysis
Population factors relating to age, deprivation and rurality were included. Deprivation at a geographical level may be defined as ‘an area’s potential for health risk from ecological concentration of poverty, unemployment, economic disinvestment, and social disorganisation’.36 For this study, four measures of deprivation were considered: a measure of unemployment,37 the Survey of Income and Living Conditions (SILC) measure of deprivation,38 the Pobal Haase Pratschke (HP) Deprivation Index39 and the Small Area Health Research Unit (SAHRU) Deprivation Index40 (see online supplementary appendix 2 for further details).
Also considered were health system factors that related to hospital activity/turnover (the rate of short-term length of stay (LOS) for emergency admissions, and conversion rates of emergency presentations to emergency admissions) and a proxy measure for the availability of primary care (the number of GPs per 100 000). The proportion of admissions with an LOS of 1 day and conversion rates were not included in the same model given the possible tautological association between the two factors.
Two factors related to healthcare funding were considered, eligibility for the GMS scheme and the percentage of the population with private health insurance in each county, by age group. Both of these factors have been shown to be important drivers of service use in Ireland.29
Level of data availability
The explanatory factors used in this analysis were available from administrative sources and the majority of the data were available at a county level.
SILC deprivation38 was only available at a larger geographical regional level. The larger regional rates were attributed to each of the counties nested within the areas.
HP deprivation,39 SAHRU deprivation40 and GMS25 were available at a subcounty level. These factors were weighted by their respective smaller area population and summed to construct the factor at a county level.
Each of the following factors—unemployment,37 LOS of 1 day,3 GMS25 and private health insurance41 42was available at an age-specific county level.
All hospital admissions and hospital-based factors were reported by the county of residence of the patient. The details of patients’s LOS following admission were available by county of residence from HIPE.3 However, the conversion rate of all emergency presentations to emergency admissions at a county level was constructed by weighting the ratio of emergency admissions to emergency presentations for each hospital by the probability of a patient from each county being admitted to that hospital.
Statistical analysis
Avoidable admission rates
The age-specific admissions for a 3-year period (2014–2016) were calculated for the 26 counties, using six age groups (0–19, 20–44, 45–54, 55–64, 65–74 and 75+). Age stratification was constrained by the age-specific level of the other independent factors included. The rates were standardised to the national population’s age distribution in 2016.
Model selection—negative binomial regression
Initial goodness-of-fit tests indicated significant extra-Poisson variation or overdispersion. Therefore, mean adjusted negative binomial regression models, in which overdispersion is modelled as the impact of unmeasured confounders, were fitted. The yearly, age-specific admissions by county for the 14 selected conditions were set as the dependent variable. Analysis was clustered by county to allow for intragroup correlation.
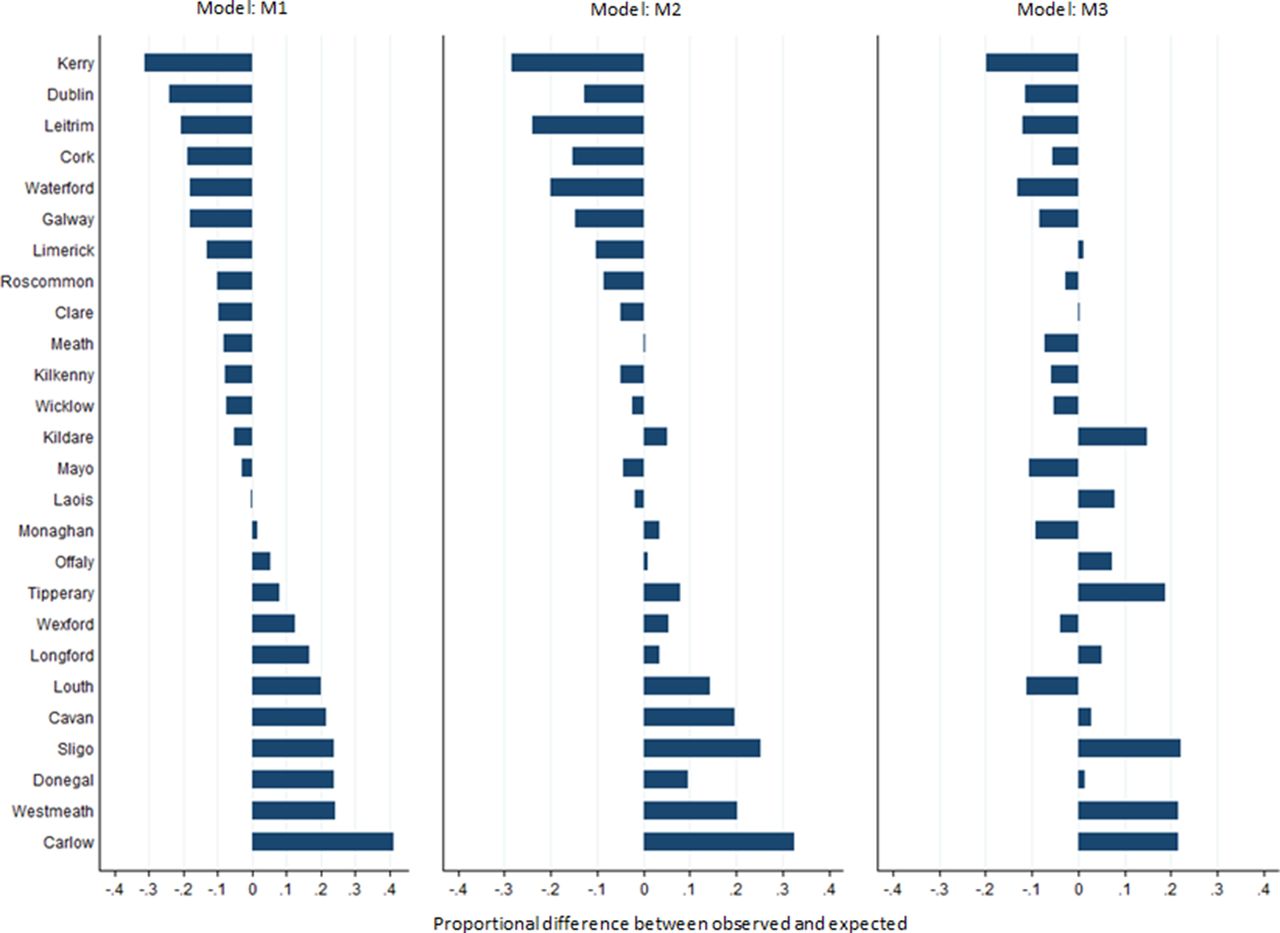
Three multivariable models were run: an age-adjusted model (M1), a model with all population level factors (M2), and finally a full model that included age, population level and health system factors (M3). The Pearson χ2 measure of model fit was assessed, with χ2 values close to 1 deemed to be the better fit. The results from each negative binomial model, M1, M2 and M3, were used to predict the number of potentially avoidable emergency admissions in each county. The observed number of admissions was compared with that expected based on each model. The degree of overdispersion remaining after each model was also measured by calculating the absolute difference between observed and expected admissions for each model and graphed using lowess smoothing.
Additional analysis considered other emergency admissions, defined as the total emergency admissions minus the selected 14 conditions, and total emergency admissions. To assess the sensitivity of the results, the analysis was repeated with each of the top five potentially avoidable emergency admission conditions alternatively excluded. Finally, to identify factors associated with the ratio of potentially avoidable to total emergency admissions, a negative binomial model with potentially avoidable emergency admissions as the outcome and total emergency admissions equal to the population was fitted.
Results were presented as incidence rate ratios (IRRs) and 95% CIs. The quoted IRR represents the incidence rate ratio associated with a 1 SD change in the risk factor. This allows for different units across the independent factors, making the IRRs comparable. Statistical significance was defined as p<0.05. All analyses was carried out using Stata V.13.
Results
Avoidable admission rates
There were 266 395 emergency admissions for the selected 14 conditions in 2014–2016.3They accounted for 22% of the total emergency admissions over the 3-year period.3 The age-adjusted admission rates for the combined 14 conditions were found to vary across counties over the period of 2014–2016. Six of the 26 counties had age-adjusted rates greater than 2500 per 100 000 population. Six had age-adjusted rates below 1750 per 100 000 population, including counties with the largest urban centres, Dublin, Cork and Galway (see figure 1).

Age-adjusted admission rates per 100 000 for potentially avoidable emergency admissions, 2014–2016.
Analysis and selection of factors for inclusion in the model
The age-adjusted analyses of individual factors revealed each of the following to be significant: each measure of deprivation, LOS of 1 day, GMS and private health insurance coverage (see table 2 and online supplementary appendix 3 for the results).
Negative binomial regression results for models 1–3 (n=468, 26 counties, 6 age groups, 3 years)
Due to the previously outlined concerns regarding the conversion rate and LOS of 1 day, and based on the univariate analysis, conversion rate was not included in the full model.
Of the four measures of deprivation, unemployment and HP Deprivation Index were found to have the lowest, and very similar, akaike information criterion (AIC) values (11.29 and 11.27). Unemployment was included as it most closely matched that of the UK study.5
Tests for multicollinearity indicated low levels of multicollinearity (variance inflation factor (VIF)=3.71 for GMS, VIF=3.09 for LOS and VIF=1.66 for unemployment).
Potentially avoidable emergency admissions
The results for each of the three models (M1, M2, M3) are given in table 2. The full model (M3) found unemployment, LOS of 1 day and private health insurance were significant.
Higher levels of unemployment were associated with a greater level of potentially avoidable emergency admissions (IRR: 1.24; 95% CI 1.04 to 1.41). Those counties whose patients had a high percentage of short stays following an emergency admission were also more likely to see higher potentially avoidable emergency admissions (IRR: 1.20; 95% CI 1.11 to 1.30). Higher levels of private insurance were associated with lower rates of potentially avoidable emergency admissions (IRR: 0.92; 95% CI 0.89 to 0.96).
The degree of overdispersion fell from α=0.05 following age adjustment, to α=0.04 after adjusting for the population-level factors of unemployment and rurality. This represents a decrease of 20%. This fell by a further 30%, to α=0.027, having allowed for health system factors (see table 2). The inclusion of all factors, population level and health system level reduced the absolute difference between the observed and expected admissions by approximately 50% (see online supplementary appendix 4).
The proportional differences between the observed and expected admissions are given in figure 2. For M1, the values range from 40% above for Carlow and 30% below for Kerry, with 10 of the 26 counties within 10% of a difference.

Proportional differences between observed and expected potentially avoidable emergency admissions.
The number of counties within 10% increases to 62% (16 of the 26 counties) based on M3. The range also decreases to 20% below for Kerry and 20% above for Sligo (see figure 2).
An analysis of total emergency admissions and other emergency admissions, defined as the total emergency admissions minus the selected 14 conditions, revealed that for most factors the effect size was similar whether looking at potentially avoidable, total or other emergency admissions (see table 3). The results for the selected 14 conditions combined were not sensitive to the exclusion of individual conditions (see online supplementary appendix 5).
Negative binomial regression results for other emergency admissions and total emergency admissions (n=468, 26 counties, 6 age groups, 3 years)
For both the total and other emergency admissions, 25% of the overdispersion was explained by population factors. An α=0.04 following age adjustment fell to α=0.03 after adjusting for the population-level factors of unemployment and rurality. The inclusion of both population and health system factors reduced the unexplained variation by a total of 50% (α=0.02) (see table 3). This reduction was similar to that found by the models run for potentially avoidable emergency admissions (see table 2).
Analysis of the ratio of potentially avoidable emergency admissions to total emergency admissions identified age, unemployment and rurality as significant factors (see online supplementary appendix 6). As expected the ratio of potentially avoidable emergency admissions to total emergency admissions increased with age. Although rurality was not associated with either potentially avoidable or other emergency admissions, it was associated with the proportion of potentially avoidable emergency admissions among all emergency admissions (see online supplementary appendix 6).
Discussion
Summary of findings
This study found that variation exists in potentially avoidable emergency admission rates between counties in Ireland.
The model which included both population and health system factors identified unemployment, a hospital LOS of 1 day and the rate of private health insurance as being significantly associated with potentially avoidable emergency admissions. The full model accounted for almost 50% of the degree of unexplained variation in emergency admissions in each county.
The results also suggest that the identified associations apply equally to potentially avoidable and total/other emergency admissions.
Interpretation
Deprivation
Deprivation has been found to play a significant role in explaining the variation in standardised illness ratios13 and hospital admission rates.4 5 43 In the UK study, employment deprivation was found to account for 72% of the variation in potentially avoidable emergency admissions.5
Attendance at EDs is also higher among deprived populations.44 Higher levels of unemployment can be associated with higher rates of ill health.45 Therefore, it is more likely that those counties with high unemployment will experience high emergency admissions for the 14 selected conditions.46 As it currently stands, those who are unemployed and with low incomes may be supported in accessing health services through the GMS card scheme, thereby reducing the negative impact of deprivation.4 However, other aspects of health may suffer, such as quality of diet, levels of physical activity and so on.47 The result of these changes may have long-term consequences on health, particularly with regard to chronic conditions,48 and health service use.5
Addressing health inequalities and reducing the impact of the inverse care law,49 that is, the tendency for medical care to be available to those in the population that need it the least, have been a significant theme of recent government policy documents.20–22 These policy documents acknowledge the need to tackle the broader determinants of health, including increased education, which may help to increase job opportunities in deprived areas, and promote the early identification of disease and secondary prevention of complications.
Our findings underline the importance of risk adjustment for differences in deprivation levels when comparing health system performances at a geographical level. Ireland, in common with many countries covered by the OECD, uses region-level hospitalisation rates for a select group of chronic conditions (asthma, diabetes, COPD and heart failure) to detect variation in the quality of primary care.50 These comparisons are age-sex standardised but do not adjust for county-level variation in deprivation. Our findings suggest that these unadjusted comparisons may reveal little about primary care performance, particularly for conditions such as COPD where most hospitalisations occur on an emergency basis.51
Short-term lengths of hospital stay
Short-stay emergency admissions were associated with a higher rate of emergency admissions for both potentially avoidable and total/other emergency admissions, which may point to limited capacity to cater for longer LOS,15 resulting in a revolving door readmission pattern.52 It may also reflect the hospital policy or the availability of more senior emergency doctors or consultants.53 For example, smaller hospitals tend to have more junior staff and a culture of admitting patients overnight for observation may exist.32 54 It could also be argued that short LOS may be a consequence, rather than a cause, of a high volume of potentially avoidable emergency admissions, perhaps driven by the need to meet certain waiting time targets for emergency presentations.55
The availability of clear frameworks and local protocols for the management of patients with the selected 14 conditions could help to reduce the impact of this factor. Ideally, each ED should have frameworks/protocols based on national guidelines, and staff should be familiar with these documents and how to implement them. Further analysis of this finding is required to understand whether a consistent inference can be applied. Therefore, this result should be interpreted with caution.
Private health insurance
This study’s analysis shows private health insurance is associated with lower potentially avoidable emergency admissions and total/other emergency admissions to public hospitals. This may reflect the engagement with other services such as outpatient services, GP visits or admissions to private hospitals or better access to care. The Irish Longitudinal Study on Ageing reports there is ‘ suggestive evidence that insured people are likely to use slightly more outpatient services’.29 In addition, the study found that those with private health insurance are more likely to have a GP visit and to have an overnight stay in hospital. It is suggested that this may reflect lower thresholds for hospital admissions for patients using private services.29 While a longer LOS once admitted may be more likely for private patients, it has been found that there is equity of access among public and private patients with regard to emergency services.56 A study of the characteristics of ED admissions at four Irish hospitals found that ‘privately insured patients and individuals with no additional cover are significantly less likely to be admitted relative to medical card holders’.57 This report also found that unemployed individuals and medical card holders were both more likely to be admitted and that this may be in line with assumptions of higher deprivation and poorer health among this group.57
Strengths and limitations
A strength of this study is the investigation of both population and health system factors as drivers of potentially avoidable emergency admissions, extending the traditional methods used by previous studies.4 5 In addition to a previous Irish study, which focused on primary care resources and deprivation,4 this study widens the number of potential drivers to include hospital factors and the role of private health insurance.
Although potentially avoidable emergency admissions were the initial focus of this study, the associations with total emergency admissions were also examined. This allowed the identification of factors associated with total emergency admissions, while also highlighting those factors that have a differential effect on potentially avoidable and other emergency admissions. The robustness of results to the inclusion of particular conditions in the definition of potentially avoidable emergency admissions was also considered.
There are a number of limitations to this study. First, this study is an ecological study and therefore may be subject to ecological fallacy, that is, the assumption that county-level associations apply at an individual level.
Data were collected from administrative sources. As the majority of these data were only available at a county level, the ability to capture all existing variability within a large geographical level is limited. It is possible that small area associations between variables such as primary care resources and emergency admissions may not be detected when data are aggregated to county level. For example, the study results suggest that higher rates of unemployment at a county level are associated with higher potentially avoidable emergency admissions. Although smaller area deprivation details are available, the study was limited by the fact that there are only 26 counties, and data on many of the predictor variables, such as primary care resources, are unavailable at a smaller level than county or at an age-specific level.
A further limitation of the study is our inability to directly measure quality of care factors at the primary and secondary levels, factors that might be expected to drive emergency admission rates. This information is not available at present in Ireland and we have had to rely on proxy variables instead.
Emergency admissions to private hospitals were not included in this analysis as private hospitals are not required to submit data to HIPE. Therefore, results for counties with a high level of private hospital usage may be higher than reported here.
The prevalence rates of each individual of the 14 conditions are also not available at a county level. These data would further the understanding of causal mechanisms in the pattern of emergency admissions.
The ability to assess appropriateness of service use based on final diagnosis also has its limitations. The diagnosis of patients may lead to the conclusion that the hospital was an inappropriate setting to receive care. However, that determination may only be possible in hindsight; investigations and tests may have been necessary to exclude a more serious diagnosis.58
Policy implications
Previous research in Ireland has highlighted deprivation and primary care provision (GP supply and GMS coverage) as important factors in partially explaining the variation of emergency admissions.4 43 In Ireland,20 22 and elsewhere,59 GPs and primary care are increasingly expected to relieve hospitals of patient care.60 As more pressures are placed on GPs, the risk of growing inequality of access is also a concern, particularly among more vulnerable and disadvantaged patients.60 The level of resources available to primary care has a significant role in ensuring quality where such services are most needed.61 62 Therefore, as Ireland continues to move towards providing care at the safest, lowest level of complexity, a consistent and agreed on measure of monitoring quality in primary care is necessary.22 An information system for primary care services in Ireland, similar to the hospital system of HIPE,3 may help support this monitoring. Our findings suggest that unless these data are available, it will not be possible to determine how large a role primary care quality has in light of our findings regarding the impact of deprivation and hospital policy.
Continued investment in the management of chronic conditions should also be considered. There is also a good evidence base on management approaches that minimise the risk of admission for specific conditions. A recent Cochrane review found that self-management interventions for COPD that include an exacerbation plan are associated with a lower probability of a respiratory-related hospital admission.63 Of the ‘potentially avoidable’ conditions included in this study, COPD had the second highest share of emergency admissions at 15%. However, if other services in the wider care system were available such as a ‘hospital at home’64 or ‘care outreach’ model65 which can respond to patients’ need, it may be possible to avoid such admissions.5 66
At a county level, our findings show that the emergency admissions we designated as ‘potentially avoidable’ seem to be driven by the same factors as total emergency admissions, and are influenced strongly by regional deprivation and hospital-level policies. This implies that the main drivers of regional variation in emergency admission rates may not be at the primary care level, although this finding is tentative as we have not directly measured primary care quality and have used resource levels as a proxy. These findings have two important policy implications. First, the ‘potentially avoidable’ designation may not be as useful as previously believed when attempting to identify the causes of regional variation in emergency admission rates. Second, potentially avoidable emergency admission rates may not be a useful quality indicator for regional (eg, county-level) primary care systems.55
This study has also revealed the need to consider the role that hospital factors have to play in the patterns of total emergency admissions, specifically the role of short-term LOS. Continued monitoring of hospitals which experience a high number of short-term LOS should be studied closer to determine the causes for these patterns. As previously suggested, the availability of clear frameworks and local protocols for the management of patients with the selected 14 conditions could help to reduce the impact of this factor.
Conclusion
Potentially avoidable emergency admission rates have been proposed as a method to detect variation in the performance of regional healthcare systems, particularly the primary care services that manage conditions where the risk of exacerbation-related hospital admission is high.67
However, this study shows that at a regional level much of the variability in emergency admission rates can be explained by socioeconomic deprivation, hospital policies and private insurance coverage. While deprivation may be associated with lower resources for primary care (a manifestation of the inverse care law), it is likely that much of the variation in county-level potentially avoidable emergency admissions does not relate to the quality of primary care. At present, the relevant data do not exist to categorically confirm the role that the quality of primary care plays in reducing potentially avoidable emergency admissions. This study does show that reductions across all emergency admissions, including potentially avoidable emergency admissions, may be achieved by targeting deprived regional populations, the drivers of short-term LOS and the way in which patients with private health insurance are managed.
References
Footnotes
Contributors All authors (BL, APF, PC, OH, CB and JB) made substantial contributions to the conception and design of this article. BL contributed to the acquisition of data. BL and APF contributed to the analysis of data. BL, APF, PC and JB contributed to the interpretation of data. BL, APF and JB drafted the article. PC, OH, and CB revised the article critically for important intellectual content. All authors gave final approval of the version submitted. All authors agree to be accountable for all aspects of the work in ensuring that questions related to accuracy or integrity of any part of the work are appropriately investigated and resolved.
Funding Funding was received from the Health Research Board (HRB), 'Funding University College Cork Collaborative Applied Research Grant 2012' (CARG/2012/28).
Competing interests OH is a member of the Reconfiguration Forum for Cork and Kerry (having been a member of the Project Team 2008–2011) and is currently seconded to the Department of Health as part of the National Establishment of Hospital Groups project team.
Patient consent Not required.
Provenance and peer review Not commissioned; externally peer reviewed.
Data sharing statement The data sets studied during the current study are not publicly available due to confidentiality agreements made with both the CSO and HIPE regarding potential identifiability of data analysed. Aggregated levels of the data may be available from the corresponding author on reasonable request.