Article Text

Abstract
Current methods used to evaluate the effects of healthcare improvement efforts have limitations. Designs with strong causal inference—such as individual patient or cluster randomisation—can be inappropriate and infeasible to use in single-centre settings. Simpler designs—such as prepost studies—are unable to infer causal relationships between improvement interventions and outcomes of interest, often leading to spurious conclusions regarding programme success. Other designs, such as regression discontinuity or difference-in-difference (DD) approaches alone, require multiple assumptions that are often unable to be met in real world improvement settings. We present a case study of a novel design in improvement and implementation research—a hybrid regression discontinuity/DD design—that leverages risk-targeted improvement interventions within a hospital readmission reduction programme. We demonstrate how the hybrid regression discontinuity-DD approach addresses many of the limitations of either method alone, and represents a useful method to evaluate the effects of multiple, simultaneous heath system improvement activities—a necessary capacity of a learning health system. Finally, we discuss some of the limitations of the hybrid regression discontinuity-DD approach, including the need to assign patients to interventions based upon a continuous measure, the need for large sample sizes, and potential susceptibility of risk-based intervention assignment to gaming.
- quality improvement methodologies
- comparative effectiveness research
- continuous quality improvement
- health services research
- implementation science
Statistics from Altmetric.com
- quality improvement methodologies
- comparative effectiveness research
- continuous quality improvement
- health services research
- implementation science
Introduction
Measuring the causal effects of initiatives to improve healthcare delivery is a major challenge for learning health systems,1–4 which seek continuous improvement in healthcare delivery using data generated at the point of care. Causal inference is particularly important when interventions are based on weak evidence (‘evidence informed interventions’) or when the generalisability of existing evidence to the study context is unknown. Traditional methods for impact evaluation have significant limitations. Individual patient randomisation can produce causal evidence but is subject to contamination in implementation studies and often requires an infrastructure for point-of-care consent and randomisation that may bias enrolment and practice away from usual care.5 Cluster randomisation limits contamination but requires multiple sites. Non-randomised methods that evaluate effects ‘before’ and ‘after’ improvement efforts are vulnerable to confounding by secular trends, and difference-in-difference (DD) 6 approaches require both treated and control sites.
We propose and demonstrate an alternate evaluation strategy that leverages the common practice of prioritising new interventions for those patients who are expected to have the greatest benefit—often those at the highest risk for an adverse outcome. Our approach combines elements of DDs and regression discontinuity designs (RD) in a manner that improves robustness over each method alone. RDs can be used in situations where interventions are implemented at a threshold value of a continuous measure (such as above a certain level of risk).7–9 When the measure is truly continuous and cannot be precisely manipulated by the patient or provider, then—given noise in measurement—patients just above and below the threshold are similar (ie, the ‘exchangeability’ assumption is met) and causal effects can be estimated by assessing the difference in outcomes across the threshold at which the intervention of interest is delivered (online supplementary figure 1A).
Supplemental material
However, two common features of improvement settings make meeting assumptions required in RD studies difficult. First, risk scores are often estimated using composite point-based scores that yield a discrete integer, rather than a fully continuous measure of risk, which may reduce exchangeability across the intervention threshold. For example, with a composite risk score that assigns a discrete value of 5 (with predicted risk 40%) or 6 (with predicted risk 60%), patients with a score of 5 are less comparable to those with a score of 6 (see online supplementary figure 1B) than are patients with a 56% vs 57% predicted risk estimated on a continuous scale. However, the assumptions of RD that require similar risk profiles (exchangeability) across the intervention threshold are attenuated when adding a DD approach that can then adjust for modest risk differences that exist across an integer risk threshold used to direct implementation (online supplementary figure 1C). Second, the relationship between the risk score and outcomes may by non-linear, further leading to biassed estimates when the functional form of the association between the risk score and the outcome around the intervention threshold is mis-specified (online supplementary figure 2A). However, assumptions needed for linearity at the intervention threshold can be addressed by using the complementary information gained from evaluation of preintervention relationships across the threshold using a hybrid RD-DD design (online supplementary figure 2B). Similarly, DD assumes that trends in outcomes in intervention and control groups are parallel prior to implementation of the interventions; however, when combined with RD, parallel trends assumptions need only be met near the assigned intervention threshold. Thus, the strengths of RD complement the weaknesses of DD, and vice versa, resulting in a novel combined RD-DD approach that more readily meets exchangeability and linearity assumptions for RD and parallel trends assumptions of DD. In addition to more robust inference as compared with either method alone, a combined RD-DD design can simplify evaluation of interventions within a learning healthcare system by: (1) Allowing a within-site comparison group and eliminating the need for external control sites. (2) Using existing data. (3) Leveraging risk-targeting for interventions of interest, a common strategy to roll out new interventions ethically and efficiently to patients most likely to benefit.
We demonstrate the novel RD-DD approach through an evaluation of a hospital readmissions reduction programme. Hospital readmission reduction programmes represent a scenario in which few strong evidence-based strategies exist;10 thus, hospitals often implement multiple weak evidence-informed interventions in an attempt at rapid improvement. However, such an approach severely limits the ability to learn what has or has not worked to change the outcome of interest—a necessary capacity of a learning health system. We demonstrate a novel approach to evaluation using a hybrid RD-DD design in order to evaluate multiple, simultaneous hospital readmission reduction interventions.
Methods
Readmission risk reduction strategy
Readmission Risk Score
In 2016, the hospital leadership initiated an all-cause readmission reduction programme in an approximately 500-bed, academic, safety-net hospital in USA. The readmission reduction strategy included development of a novel risk score to identify patient risk for readmission, with increasingly intensive interventions implemented at thresholds of readmission risk. The details of the Readmission Risk Score are beyond the scope of this manuscript. However, in brief, the hospital data analytics department used multiple logistic regression to analyse several prior years of clinical data to create a composite Readmission Risk Score in which each patient was assigned an Integer Risk Score from 0 to 23. The risk score (table 1) was calculated automatically in the electronic medical record and stratified patients into one of four risk groups based on the individual’s numerical score. Patients with a score from 0 to 4 were considered ‘Low Risk’, scores from 5 to 8 were ‘Moderate Risk’, scores from 9 to 13 were ‘High Risk’, scores of 14 or more were ‘Super Utilizers’.
Relative weights of factors used to calculate the Readmission Risk Score
Beginning in February 2016, the hospital implemented a series of new interventions at different levels of readmission risk (online supplementary table 1). Patients with risk scores of 5 or higher (moderate risk) were assigned to receive a postdischarge phone call from a clinician. Patients with scores 9 or higher (high risk) additionally received a negotiated follow-up appointment, a pharmacist-directed medication review at admission and discharge, and comprehensive psychosocial assessment by social workers prior to hospital discharge. Patient with risk scores of 14 or higher (Super Utilizers) received all the intervention of a high-risk bundle and were provided supplementary resources and individualised high-touch case management from a dedicated Super Utilizer team. The Readmissions Reduction Programme was implemented gradually from February 2016 until full implementation in October 2016. No changes in the calculation of the risk score occurred during the study analytical frame.
Data and study population
Baseline data were collected from admissions starting 1 February 2015 to 31 January 2016, a period prior to the implementation of the readmissions reduction initiative. Postimplementation data were collected from admissions starting 1 November 2016 to 31 October 2017. Data during the period of programme scale-up were excluded from analysis. All patients admitted to adult inpatient wards at over the study period were included. An individual hospital visit/admission was used as the unit of analysis.
Outcome and process measures
The primary outcome for this study was all-cause, unplanned 30-day readmission using the National Quality Forum/Centers for Medicare and Medicaid Services measure specifications; briefly, we measured rates of readmissions to the same hospital within 30 days of hospital discharge for all causes.11 The exposure variables of interest were the three risk threshold levels that triggered the postdischarge phone call (moderate risk), pharmacy and social work (high risk), and Super Utilizer team interventions.
Applying the RD-DD Approach to Readmissions
The discrete nature of the readmission risk score—patients could only score whole integers—and the fact that there is (by construction) a strong increasing relationship between risk score and the outcome means that patients just above and below the threshold are not likely exchangeable—that is, the distribution of outcomes (readmissions) may differ across the chosen discontinuity threshold. Exchangeability is a requirement in RD.12 However, the availability of historic preintervention data allows for the opportunity to adjust for the preintervention relationship between the risk score and outcome. Given the random noise inherent in the data used to generate the risk score, as in RD, we assume that patients near either side of a cut-off—5 (as compared with 4) for the low-risk–moderate-risk cut-off, 9 (as compared with 8) for the moderate-risk–high-risk threshold, and 14 (as compared with 13) for the high-risk–Super Utilizer threshold—are expected to be similar in unmeasured possible confounders after adjusting for preintervention differences using the combined RD-DD approach. Although the RD assumptions12 may not apply to the raw risk score data, assumptions apply to the differences over time for each value of the risk score. We calculated risk scores in both the preimplementation and postimplementation periods. Patients scoring just below the threshold—and thus not assigned to receive the intervention(s)—can be treated as control or comparison group for those patients just above the threshold, who are assigned to receive the intervention, allowing for a form of DD analysis that does not require the often infeasible collection of control data from external sites and only requires the weak assumption of parallel trends across the intervention threshold. We visually inspected trends in readmissions in the ‘pre’ and ‘post’ groups to evaluate for parallel trend assumptions of DD.
Statistical analysis
We use intention-to-treat analysis with treatment assignment determined by a patient’s risk group cohort (ie, low, moderate, high or Super Utilizer) and estimated separate linear regression models for the readmission outcome at each of the three thresholds—low risk/moderate risk, moderate risk/high risk and high risk/Super Utilizer. Each of the models included three terms: an indicator for the treatment (patient was assigned to the postdischarge phone call, to the high-risk bundle or to the Super Utilizer team based on the value of the risk score), the pre/post variable (in this case prior to or after implementation of the readmissions intervention) and the interaction term of treatment * post (which is the difference in difference estimator, or effect size), as well as a constant. Treatment effects (risk differences) were calculated for the low-risk/moderate-risk threshold, the moderate-risk/high-risk threshold and the high-risk/Super Utilizer threshold along with associated 95% CIs. Because strongest inferences in RD can be made just above and below the implementation thresholds, but use of small windows of evaluation around the intervention thresholds may limit precision of estimates, we performed sensitivity analysis evaluating the robustness of our findings using larger ranges above and below the intervention threshold in the RD-DD design. Standard errors were clustered by patient to account for the fact that some patients contributed multiple observations. All analysis were performed using R (V.3.3.2).
Results
There were 18 634 patient visits in the preintervention period and 10 714 in the postimplementation period. Figure 1 demonstrates the distribution of risk scores before and after implementation of risk-based readmission reduction strategies.

Distribution of risk scores before and after implementation. Distribution of risk scores for patient visits by relative frequency with ‘pre’ representing visits that occurred in the study period prior to implementation of the readmission reduction interventions and ‘post’ representing visits occurring after implementation. The observation of continuity across the intervention thresholds and similar distributions of risk scores in the preintervention and postintervention time frames suggests that assumptions of lack of ‘gaming’ of the risk score to assign individual patients to interventions, as well as parallel trends, are met.
Process measure assessment at moderate-risk and high-risk thresholds
Figure 2A,B,C,D,E shows the adoption of strategies designed to reduce hospital readmissions at readmission risk thresholds. At the moderate-risk threshold, performance of the discharge phone call (figure 2A) increased from 22.9% (95% CI 11.8% to 33.9%) at a risk score of 4, to 51.8% (95% CI 48.8% to 54.8%) at a risk score of 5; the proportion of patients receiving a follow-up appointment prior to discharge demonstrated no significant increase (figure 2B). At the high-risk threshold, the proportion of patients receiving admission medication reconciliation increased from 10.5% (95% CI 8.5% to 12.4%) at a score of 9% to 91.5% (95% CI 89.2% to 93.8%) at a score of 10 (figure 2C); discharge medication reconciliation increased similarly (from 6.4% (95% CI 4.8% to 8.0%) to 70.6% (95% CI 66.8% to 74.4%), figure 2D). The proportion of patients receiving a psychosocial evaluation by social work demonstrated high (>80%) levels of implementation throughout, with no significant increase at the risk threshold (figure 2E).

Adoption of processes intended to reduce readmissions at thresholds of readmission risk, with low-risk/moderate-risk and high-risk/Super Utilizer thresholds delineated. (A) Proportion of patients receiving postdischarge phone call (moderate-risk and high-risk groups). Proportion of patient visits after implementation where a postdischarge phone call was attempted, binned by risk score with associated SE bars. (B) Proportion of patients receiving a scheduled follow-up appointment (high-risk group, score >8). Proportion of patient visits after implementation where a postdischarge follow-up appointment was made prior to discharge, binned by risk score with associated SE bars. (C) Proportion of patients receiving admission medication reconciliation (high-risk group, score >8). Proportion of patient visits after implementation where an admission medication reconciliation was performed on admission, binned by risk score with associated SE bars. (D) Proportion of patients receiving discharge medication reconciliation (high-risk group, score >8). Proportion of patient visits after implementation where a discharge medication reconciliation was performed on admission, binned by risk score with associated SE bars. (E) Proportion of patients receiving social work evaluation (high-risk group, score >8). Proportion of patient visits after implementation where a psychosocial evaluation was performed by a social worker during admission, binned by risk score with associated SE bars.
Thirty-day readmission outcome
Figure 3 shows the readmission rate preimplementation and postimplementation, and figure 4 shows the difference in prepost rates according to the Readmission Risk Score. Table 2 presents the preimplementation and postimplementation readmission rates for scores near the treatment cut-offs, as well as the DD results for the low-risk/moderate-risk threshold. The DD between readmissions of patients at a risk score of 4 and risk score of 5 was 2.7% (95% CI −1.3% to 6.6%, p=0.18) suggesting no improvement in readmission rate versus what would have been expected in the absence of the postdischarge phone call. Similarly, the DD at the high-risk threshold (between a risk score of 8 and risk score of 9) was 1.0% (95% CI −4.7% to 6.7%), p=0.73. The DD between a risk score of 13 and risk score of 14 was 8.1% (95% CI −4.3% to 18.5%) p=0.13, also suggesting no improvement in readmissions with the Super Utilizer team intervention. Sensitivity analyses altering the range of risk scores evaluated around the risk cut-off showed similar results to the primary analysis (online supplementary table 2).
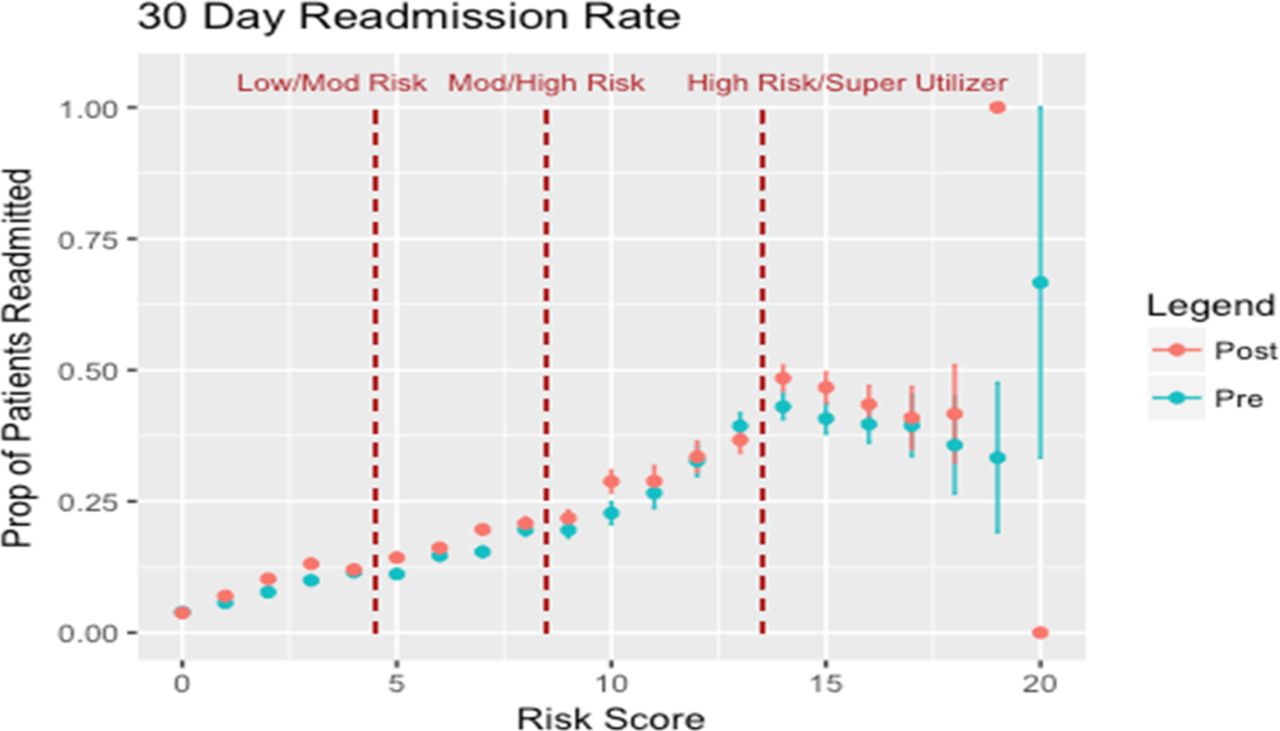
Thirty-day readmission rates in the preimplementation and postimplementation periods with thresholds of risk-based intervention delineated. Proportion of patients readmitted within 30 days of discharge, with visits subset by preimplementation (blue) and postimplementation (red) periods and SE bars. Risk group thresholds delineated. Parallel trends assumptions between the ‘pre’ and ‘post’ groups before each intervention threshold were accepted based on the nearly superimposed ‘pre’ and ‘post’ group readmissions curves.

Differences in 30-day readmission rates for patients at each risk score. Difference in the proportion of patients readmitted in 30 days in the postimplementation period compared with the preimplementation period with SE bars and risk group threshold delineated.
Readmission risk and regression-discontinuity difference-in-difference analysis
Discussion
We explored the effectiveness of multiple, simultaneous hospital readmission reduction interventions using a novel hybrid RD-DD design. The development of the RD-DD design allowed for rigorous measurement of process uptake and intervention effectiveness, while relaxing many assumptions and requirements of each individual analytical approach.
The ability to generate novel evidence in real time to drive improvements in healthcare delivery makes the RD-DD approach an attractive tool for use in a learning health system. There are several aspects of the model used here to evaluate the effectiveness of a specific readmissions initiative that are generally applicable to advancing the learning health system. (1) Using a risk score—or other clinical indicators—to assign a treatment or intervention allows stakeholders to target scarce resources to patients most in need, while at the same time creating a built-in framework to evaluate both processes and outcomes of improvement efforts. This provides health systems an opportunity to develop strong internal knowledge without the pragmatic and ethical issues that often limit use of randomised trials. (2) The use of quasi-experimental designs with complementary assumptions allows health system leaders to draw conclusions with stronger causal inference than the simple prepost comparison of means, run charts of outcomes often used in local quality improvement projects.7 (3) The readmissions analysis required only operational data extracted from electronic medical records, decreasing the cost and complexity in evaluating a large-scale initiative. Such data collection methods also ensure that measuring further iterations of a project do not require additional infrastructure. (4) The model is broadly applicable to evaluation of processes and outcomes either using readily available clinical thresholds (for example, implementation of improvement initiatives on thresholds of HbA1c or systolic blood pressure) or through the development of risk scores for any outcome of interest.
The RD-DD analytical approach allowed for efficient, simultaneous assessment of processes and outcomes that revealed multiple areas for future iterative improvement in the readmissions reduction programme. The lack of effectiveness in all interventions tested shows the difficulties in developing programmes that reduce hospital readmissions. Our results are consistent with generally ineffective interventions observed within the existing literature on readmission reduction efforts.10 In particular, there is limited evidence for specific readmission interventions in a safety-net population.13 However, our study provides a learning healthcare structure with which to iteratively evaluate interventions meant to reduce readmissions, addressing methodological limitations of prior work evaluation readmissions reduction.14 Further evaluations, potentially with mixed qualitative and quantitative approaches that can be fed back into iterative RD-DD analysis, may explore the reasons for incomplete adoption and fidelity of strategies targeting readmissions reduction. For example, further iterations may explore reasons why processes such as the postdischarge phone call or follow-up appointments were incompletely adopted, allowing re-evaluation of readmission rates after improved readmission reduction processes. Other evaluations may explore reasons why the Super Utilizer team was ineffective in reducing readmissions, such as the possibility that they may have uncovered unmet medical needs in recently discharged outpatients, which may have appropriately increased utilisation and readmissions.
There are limitations to the RD-DD analytical approach. Effect sizes are most strongly applicable to patients near the cut-off and do not necessarily rule out heterogeneous treatment effects for patients further from the risk threshold. Given the smaller distribution of patients at the highest risk score, the sample size may have been underpowered to detect a change in readmission rates at higher thresholds. RD typically requires sample sizes fourfold higher than individual patient randomisation. It is also important to note the possible underperformance of the readmission risk score itself in predicting readmission rates for those at this highest risk score. Those with a risk score >16 showed a trend towards lower readmission rates both before and after the intervention. However, the functional form of the preintervention and postintervention 30-day readmission rates remained very similar (figure 3), thus the performance of the risk score would be expected to have little effect on the RD-DD analysis of effectiveness. We used the nearly superimposed relationship between readmissions and readmissions risk scores in the ‘Pre’ and ‘Post’ periods to provide evidence supporting the parallel trend assumptions of DD; other studies may choose to statistically test for differences in slopes in the ‘Pre’ and ‘Post’ periods for scores near the intervention thresholds (eg, compare slopes pre and post for scores 1–4). A strength of our readmission initiative was that risk scores were automatically calculated in the electronic medical record and assigned to interventions independently from the primary treating clinician. For interventions where clinicians have more influence over treatment assigned, attention should be paid to ensure that providers are not biassing assignment or otherwise ‘gaming’ the system. Finally, the choice to evaluate absolute risk reduction, rather than relative risk reduction, may affect interpretation of the findings, such as in scenarios where an increasing absolute risk difference at higher levels of baseline risk may occur even in the setting of constant relative risk.
In conclusion, the RD-DD method is a novel approach to evaluate continuous performance improvement that addresses many of the limitations of each approach alone, produces actionable results, and may be a valuable analytical tool for a learning health system.
Footnotes
Twitter @walkeyallan
Contributors NC participated in the acquisition, analysis and interpretation of data for the work; drafted the manuscript; provided final approval for its content; and agrees to be accountable for the work he has done. JB participated in the analysis and interpretation of data for the work; edited the manuscript for important intellectual content; provided final approval for its content; and agrees to be accountable for the work he has done. AW participated in the acquisition, analysis, and interpretation of data for the work; drafted the manuscript and revised it for important intellectual content; provided final approval for its content; and agrees to be accountable for the work he has done.
Funding The authors have not declared a specific grant for this research from any funding agency in the public, commercial or not-for-profit sectors.
Competing interests None declared.
Patient consent for publication Not required.
Provenance and peer review Not commissioned; externally peer reviewed.
Data availability statement No data are available.