Article Text

Abstract
Introduction The improvement collaborative approach has been widely promoted in developed countries as an effective method to spread clinical practices, but little has been published on its effectiveness in developing country settings. Between 1998 and 2008, the United States Agency for International Development funded 54 collaboratives in 14 low- and middle-income countries, adapting the approach to resource-constrained environments.
Methods The authors analysed data on provider compliance with standards and outcomes from 27 collaboratives in 12 countries that met study inclusion criteria (at least 12 months of data available for analysis and indicators measured as percentages). The dataset, representing 1338 facility-based teams, consisted of 135 time-series charts related to maternal, newborn and child health, HIV/AIDS, family planning, malaria and tuberculosis. An average of 28 months of data was available for each chart.
Results Eighty-seven per cent of these charts achieved performance levels of 80% or higher, and 76% reached at least 90% performance, even though two-thirds had a baseline performance below 50%. Teams achieved average increases of 51.9 percentage points (SE=28.0) per chart, with baseline value being the main determinant of absolute increase. Teams consistently maintained this level of performance for an average of 13 months (69% of months of observation). The average time to reach 80% performance was 9.2 months (SE 8.5), and to reach 90% performance, 14.4 months (SE=12.0).
Conclusion Collaborative improvement can produce significant, sustained gains in compliance with standards and outcomes in less-developed settings and merits wider application as a strategy for health systems strengthening.
- Collaborative
- compliance
- continuous quality improvement
- effectiveness
- healthcare quality
Statistics from Altmetric.com
Introduction
Background
Since the mid-1990s, supporters have proposed that the improvement collaborative approach, such as the Institute for Healthcare Improvement (IHI) Breakthrough Series (BTS),1 is effective for achieving significant gains in healthcare quality.2–6 Others have questioned the validity and rigour of evidence on collaboratives,7 8 found only modest effects9 10 or suggested that its effectiveness cannot be reliably predicted.8 11 12 Most of this literature discusses applications in developed countries, with few published results about the effects of collaboratives in less-developed countries.
Based on promising results from applying the BTS approach in Russia,13 the US Agency for International Development (USAID) supported 54 applications of the improvement collaborative approach in 14 low- and middle-income countries between 1998 and 2008. These 54 collaboratives generally followed the BTS model, with multiple facility-based teams working in parallel, focused on applying ‘change concepts’ in a single area of care, regularly measuring performance using agreed-upon indicators, and sharing results and best practices through periodic learning sessions. These collaboratives addressed topics reflecting health priorities facing less-developed countries and were, in all cases, the only quality improvement (QI) activity being implemented in the participating facilities. Compliance with evidence-based standards, which has been associated with improved health outcomes,14 was the main measure of collaboratives' success. Where feasible, measures of actual patient outcomes were used. In general, these collaboratives were designed as a time-limited improvement strategy, typically lasting 12–24 months, although some continued for 3 years or more.
USAID-supported collaboratives differed from those implemented in more developed settings in important ways. First, almost all collaboratives involved teams composed of Ministry of Health (MOH) employees in government facilities who were selected to participate by national authorities. Second, site-level improvement teams in USAID-supported collaboratives generally received regular coaching visits and training (both QI and clinical) from experts, but with no substantial material or other inputs to support improvement. Finally, as most developing-country health systems are characterised by low levels of quality (as measured by compliance with standards or health-worker competency),15–20 the systems have ample room for improvement and are probably more susceptible to the effects of improvement interventions.
Individual country results have been presented at international quality conferences,21–25 and non-peer-reviewed reports have described how the BTS collaborative approach was adapted to low-resource settings.26 27 This study analysed results across these collaboratives to determine what this large body of experience tells us about the effectiveness of collaborative improvement in developing-country settings in terms of the magnitude of improvement achieved, how long improved levels of care were maintained and how fast improvements were achieved.
Methods
Setting and selection of collaboratives
This analysis assembled data from 27 collaboratives in 12 countries meeting the study's inclusion criteria (at least 12 months of consecutive data available for analysis and indicators measured as percentages), shown in figure 1. The collaboratives addressed various clinical topics: essential obstetric and immediate newborn care, obstetric complications, paediatric hospital care, family planning, prevention of mother-to-child transmission of HIV, HIV/AIDS, HIV/TB, malaria and primary healthcare. Sites participating in these 27 collaboratives included almost exclusively government health centres and hospitals (first, second and third referral levels). In 26% of these collaboratives, multiple waves of teams participated, wherein new groups of teams (expansion/spread sites) joined the collaborative before the initial teams (demonstration sites) had completed their work, resulting in 36 groupings of teams across the 27 collaboratives. Each group, made up of teams who participated in QI activities in the same time period, was analysed separately. The average number of teams participating in each of these 36 groupings was 37.2 (median 22, range 3–442), or 24.2 (median 22, range 3–126) if the outlier collaborative with 442 teams is excluded.

Inclusion and exclusion of collaboratives in the analysis.
Selection of collaboratives and measures used
The analyses of magnitude, maintenance and speed of improvement used the time-series chart as the unit of analysis. Each time-series chart represents results for one indicator reported by one grouping of teams over the entire time period for which data were available for that group. Each data point on the chart represents the pooled average of all teams reporting in that collaborative group. While these teams each measured four to 22 indicators, the analysis focused exclusively on indicators of quality of care provided to patients (process indicators) and relevant client knowledge/behaviour or health status (outcome indicators), for an average of 3.7 indicators per collaborative (median 3, range 1–9). One hundred and thirty-five time-series charts were included in the analysis, weighted equally and representing 81 unique indicators.
The data represented in the 135 time-series charts are compilations of self-reported data compiled by teams participating in each collaborative group through record review, generally on a sample of clinical records. Coaches and collaborative managers reviewed data received from teams for inconsistencies and anomalies, and made follow-up visits to sites with questionable results to spot-check records to validate reported data.
Figure 2 displays how six measures of collaborative performance were calculated. Cut-off points for measuring the degree of improvement were set at 80% and 90% performance levels. Each chart was individually coded for each performance measure, phase of the collaborative, topic, type of facility, region and type of indicator. Analysis was completed in STATA 11.0, using χ2, analysis of variance and logit and multiple linear regression analyses.

Indicators of collaborative success and example of how indicators were calculated for one of the 135 time series charts.
Results
Sample description
Table 1 presents the characteristics of the 135 time-series charts analysed. While region reflects socio-economic and health-system differences, there were also differences in other factors: collaboratives in Eurasia (all in Russia) measured almost exclusively health outcome indicators, whereas those in Latin America and Africa used predominantly process measures. Collaboratives in Latin America and Russia were more likely to involve only hospitals, whereas those in Africa were more likely to include health centres as well. Starting values were generally low: the average baseline performance level was 38.3% (SE=28.4, median 37%, range 0–100%). No significant differences were seen in baseline levels by phase of the collaborative or facility type, but time-series charts focussing on outcome indicators started lower, while time-series charts from HIV/AIDS collaboratives started higher.
Characteristics of time-series charts analysed (n=135)
Outcomes
Magnitude of improvement
A total of 87.4% of time-series charts reached at least 80% performance levels, and 72.6% reached 90% performance levels. No differences in reaching either 80% or 90% performance were observed related to topic area, phase, type of facility or type of indicator. Only baseline level was a significant predictor of whether 80% or 90% performance level would be achieved: charts with baseline values below 50% were 10.6 times less likely to reach 80% than those starting over 50% (p=0.024) and 2.5 times less likely to reach 90% (p=0.041), as shown in table 2.
Performance levels reached and relation to baseline values
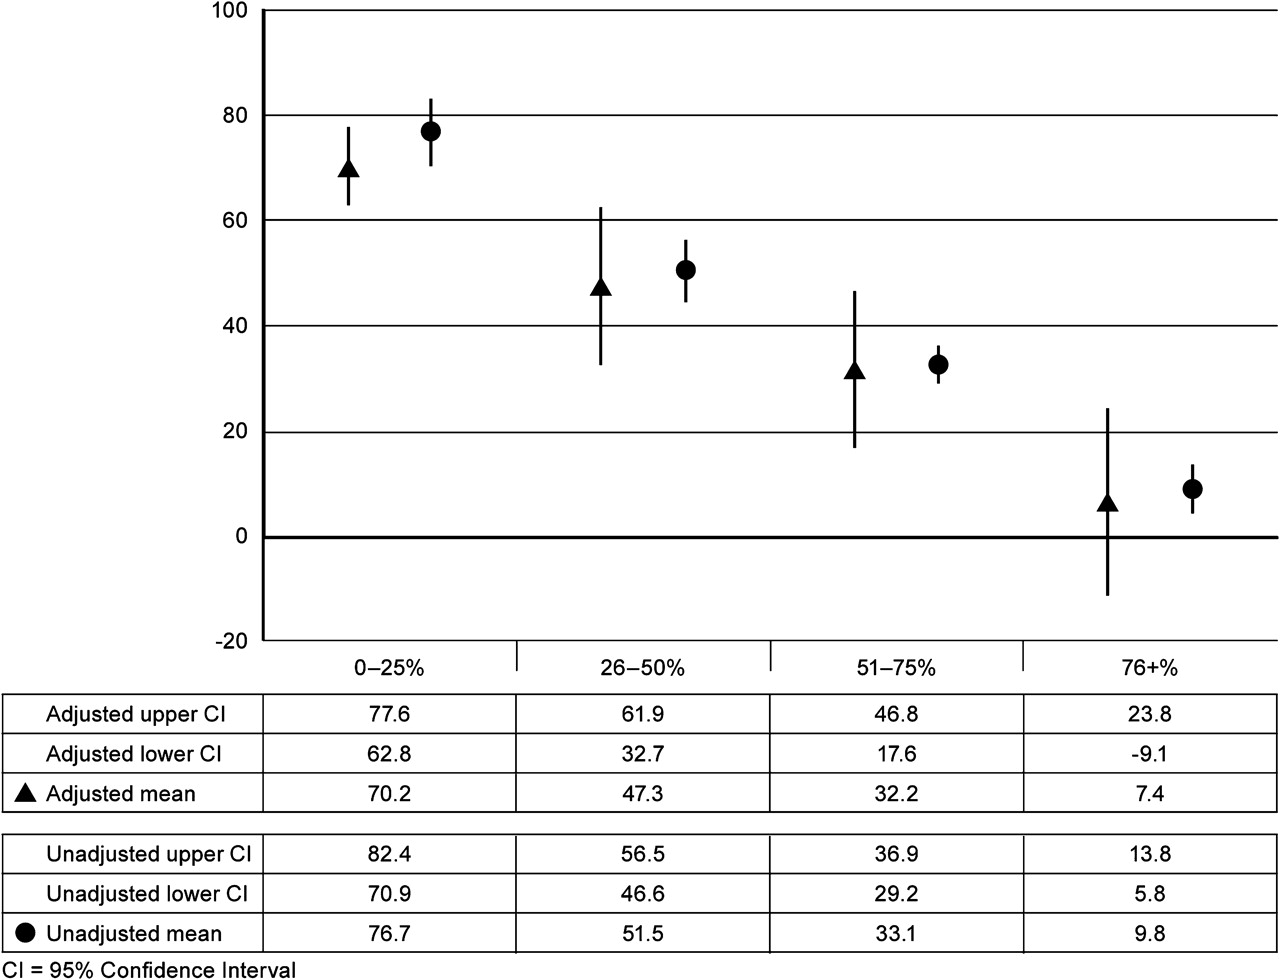
Across the 27 collaboratives, improvements were measured by changes from these baseline levels in absolute terms (difference in percentage points from the baseline value to the highest value achieved). The potential for absolute improvement is dependent on the baseline level, with lower baseline levels offering greater room for improvement. The average increase from baseline was 51.9 percentage points (SE=28.0, median 51%, range 0–100%). Table 3 presents the linear regression outputs for magnitude, maintenance and speed of improvement. The coefficients in the second column of table 3 show that for those time-series charts from collaboratives with baseline values above 50%, the average improvement was 32.43% less than for those whose baseline values were below 50%, controlling for facility type, region, topic, phase and indicator type. Related to the magnitude of improvement, only three factors showed a significant influence: baseline value, topic (HIV/TB) and indicator type (outcome indicators). These three factors explained almost 60% of the variation in absolute improvement. Absolute improvement decreased as baseline values increased in an almost linear manner, as shown in figure 3, which presents unadjusted and adjusted values of absolute improvement across four levels of baseline values. Increases in performance achieved during the collaboratives for indicators starting at lower levels (≤25%) brought them in line with standard measures of success, achieving an average highest value of 90.2% (SE=15.6, median 96%, range 14–100%).
Results from regression analyses for measures of collaborative success (magnitude, maintenance of improvement and speed of improvement)

Absolute improvement in indicator values by baseline value (adjusted values controlled for topic area, region, facility type, phase and indicator type).
Maintenance of improvement
While achieving significant improvements is laudable, sustaining gains over time is the critical test of an improvement effort. We measured how long the collaboratives studied were able to maintain gains in quality of care and outcomes using a very strict criterion of the percentage of months of observation in which values remained above 80%, once levels of 80% were achieved. The average percentage of observed months with performance levels over 80% (once reaching 80%) was 70.3% (SE=30.6, median 85.0%, range 0–100%), representing 13.4 months out of an average of 19 months of observation after having reached 80%. Results in table 3 indicate that only facility type (controlling for other factors) was associated with any difference, in which time-series charts for hospital-only collaboratives were less able to maintain gains over time than those collaboratives including only health centres, with health-centre-only charts showing maintenance for an average of 26.8% more time than hospitals.
Speed of improvement
Collaboratives are supposed to generate rapid improvement, due to the sharing of effective change ideas across teams. This analysis examined the time (in months) to reach 80% and 90% performance levels and factors affecting that speed, as shown in the last set of columns in table 3. The average number of months to reach 80% for the 119 charts reaching at least 80% was 9.2 (SE=8.5, median 8, range 0–63 months), while for the 102 charts that reached at least 90%, the average number of months to reach 90% was 14.4 months (SE=12.0, median 11, range 0–48 months). Several factors, controlling for other variables, were significant in explaining the variation in speed of improvement (adjusted R=0.226 and 0.323 respectively), including:
baseline level: lower baseline levels were associated with longer times to achieve 80% or 90% performance; baseline value alone explains more than half of the explained variation for achieving 80% and a third of the variation for 90%;
facility type: hospitals were associated with longer times to achieve 80% and 90% than health centres;
region: time-series charts from Latin America associated with longer times to reach these levels of performance than in Africa or Russia;
topic area: charts for maternal, reproductive, newborn, and child health topics associated with shorter times.
We examined whether the phase of the collaborative influenced the speed of improvement; the data indicated a trend in reduction in time to reach both 80% and 90%, but the results were not statistically significant. Similarly, the type of indicator did not influence the speed of improvement. We also examined the relationship between the time to reach 80% and the time to reach 90%. For the 102 charts that reached at least 90% performance, there was a significant difference between the time required to reach 80% (mean 8.31 months) and the time to reach 90% (mean 14.4 months: t test 6.698), with the additional months required to make the 10% increase from 80% to 90% averaging 6.11 (SE=8.9, median 3, range 0–38 months). The only factor affecting this additional time was region, with time-series charts from Latin America taking significantly longer to reach 90% (controlling for topic, facility type, baseline level and indicator type).
Discussion
This exploratory study sought to evaluate whether collaborative improvement is associated with significant, sustainable improvements in the quality of care and outcomes, controlling for some key factors, beyond the QI methodologies, that might account for results. Our findings show that collaborative improvement is associated with significant gains in performance levels in diverse low- and middle-income-country health systems, with 87% of indicators analysed reaching performance levels of 80% or higher, and an average gain of 52 percentage points. The magnitude of gains achieved was largely a function of baseline levels of performance: the lower the starting level, the more room for improvement and the more improvement achieved. These results were achieved by an average of 38 sites per collaborative, indicating an ability to achieve improvements at an appreciable scale.
We found that the gains in quality achieved in these improvement collaboratives were sustained: performance at levels of at least 80% was maintained for more than two-thirds of the time for which data points were available, or an average of 13 consecutive months during at least 19 months of subsequent data collection. In some cases, performance above 80% was maintained for as long as 4 years. Contrary to our expectations, this dataset did not reveal any significant differences in speed of improvement (time to reach 80% or higher level) between phases of a collaborative: demonstration (ie, the initial collaborative in a country addressing the topic) and expansion or spread phases (subsequent groups of teams that built to a greater or lesser degree on the experiences of demonstration sites).
Given previously published systematic reviews and individual studies finding only small positive effects attributable to collaboratives, why do we think these collaboratives achieved such results?
First, experiences in improvement around the world have shown that there are many opportunities for improving healthcare quality in developing-country settings.15–20 Second, the 27 collaboratives studied promoted multifaceted interventions that included applying quality-management techniques to modify care organisation, job aids, training, coaching and regular self-monitoring of compliance with standards. Several authors28–32 have found that intervention strategies with multiple components have more potential for larger positive effects, and Rowe et al30 noted the particular importance of monitoring performance. The average effects we found exceeded those found in other studies that did not include QI strategies as part of the intervention.
Third, contrary to popular belief, there are many changes possible within facility-level teams' realm of control. Those that were associated with the results presented in this analysis were primarily changes in care organisation that fell within teams' authority, were achievable and could be sustained without substantial additional resources. Table 4 provides examples of changes frequently implemented in the collaboratives studied.
Examples of effective changes tested in US Agency for International Development-supported collaboratives
Fourth, based on our work with improvement methodologies in developing countries over the past 20 years, we believe that the social dynamics of collaboratives do indeed contribute an important additional impetus for change that, when combined with the basic effectiveness of continuous QI, leads to large improvements in performance. These social dynamics help to accelerate the pace of improvement and enable groups of teams to collectively achieve greater results than would teams working independently.
This study was not designed to explain why hospitals were associated with a slower achievement and more limited maintenance of improvement, but possible explanations include greater complexity of the clinical processes addressed (eg, obstetric complications), more limited engagement of physicians/facility leaders and staff turnover.
Our findings show that this first basic improved level of performance seems to plateau at about 80%. We found that the additional time needed to reach a performance level of 90% was not insignificant, requiring 35–140% more time than that required to raise performance to a level of 80%. This finding is consistent with reliability science33 and highlights the fact that in order to raise performance to a higher level, organisational changes are needed that detect errors and correct them before quality lapses occur so that all patients receive quality services.
Mittman11 has argued that one pitfall of attributing results specifically to the improvement collaborative approach is that any improvement methodology may be capable of achieving such results. While the results we observed could plausibly have been achieved through other improvement strategies, we have not seen any similar evidence of the magnitude, maintenance and speed of improvement with other methods. We believe that improvement collaboratives offer important advantages over other improvement strategies, particularly related to public sector developing-country health systems, in their ability to engage government officials and providers in a time-limited improvement effort, build momentum for change in a specific content area and mobilise improvement activities on a large scale.
Limitations
Several study limitations merit consideration: data sources, sample bias, lack of controls and confounding factors. The data used in this analysis were compiled, analysed and reported by QI teams participating in the studied collaboratives who typically measured indicators based on a monthly audit of clinical records. Such data are potentially subject to bias of over-reporting performance; however, results based on record abstraction can also be subject to under-reporting bias if care provided is not fully recorded. A recent study examined the validity and reliability of self-reported data based on a clinical audit of records in 12 facilities in Ecuador by comparing teams' self-monitoring results with those obtained by an audit of the same clinical records by external experts, and found generally high levels of percentage agreement and Kappa statistic with moderate to substantial agreement.34
Exclusion of data from potentially less effective applications of the collaborative approach could also influence results. It is possible that the 16 collaboratives excluded because insufficient data were available for analysis may have had less positive results that, had they been included in the analysis, would have reduced the magnitude of the effects across all collaboratives, but it is also possible that they had similar or better results.
While the lack of comparison groups is another weakness of the dataset, we note that the initial low levels of performance of subsequent groups of teams joining multigroup collaboratives point to the likelihood that comparable sites not participating in the collaborative did not have any improvements in performance over time. In assessing our results, we were careful to see if there were any other parallel improvement interventions under way that could account for the improvements observed, and there were not.
Finally, the 27 collaboratives were implemented in three regions of vastly different socio-economic conditions over a 10-year period and included many variations in design and implementation that may have masked some effects. Many of these collaboratives represented early efforts to adapt the BTS model to developing country contexts, and over time we have learnt to design, manage and support collaboratives more effectively. Because most of the collaboratives included were already completed, we did not have any valid and reliable measures to control for these variations in approach, such as data on the amount of coaching, leadership engagement, number and specific nature of changes, or factors related to facility type that could explain its important association with differing results, such as workload and percentage of staff participating on the QI team. Given this lack of detailed data on what we would hypothesise to be key factors in collaborative success, we did not conduct any analyses of confounding, moderation or mitigation. We believe that future studies which control for design and implementation variables, such as degree of organisational support, frequency of coaching and intensity of changes made by sites, would reveal even greater effects of collaborative improvement when the approach is optimally implemented.
Conclusions
We conclude that collaborative improvement—coordinated efforts of teams to accelerate improvement in a single area of care through iterative changes and peer-to-peer learning about successful changes—yields large increases in quality of care and outcomes in developing-country settings. By achieving significant, sustained improvements in compliance with standards and outcomes, the improvement collaborative approach is a viable and effective tool for health systems strengthening in resource-constrained health systems.
Our findings argue for more widespread consideration of the improvement collaborative approach in developing countries, where government-dominated health systems may be more favourable for success of the approach than in developed countries and where the approach is now being applied to non-clinical topics, including community-based health and social services, human-resources management and community-based financing. Further research is needed on the conditions for implementing collaboratives more efficiently and enabling more rapid spread of learning.
Acknowledgments
This study summarised the efforts of over 1300 teams of healthcare providers in 12 countries. We would like to acknowledge the dedication of these teams to improving the quality of services they provide to their patients. The work described in this study also reflects the efforts of coaches and supervisors in the Ministries of Health and local project technical advisors who made it possible to achieve such results through their very dedicated and capable technical support.
References
Footnotes
Funding United States Agency for International Development through its Health Care Improvement Project, implemented by University Research Co, LLC under Contract No GHN-I-01-07-00003-00.
Competing interests None.
Provenance and peer review Not commissioned; externally peer reviewed.