Article Text

Abstract
Background During 2006 and 2007 the rate of caesarean section surgical wound infection was 17,4 % in Baerum Hospital.
Objective The objective was to reduce the incidence to below the Norwegian national level of 8 %.
Design The intervention (a quality improvement project) was implemented in September 2008. A bundle of measures were introduced. Staff from all aspects of patient flow was recruited. Cochrane literature was used as gold standard. Data registration was based upon CDC criteria. Results were based on data collected through the Norwegian national surveillance system for infections in health care, NOIS.
Study setting This Maternity clinic has about 2500 births annually and a caesarean section rate pushing 15 %.
Patient group The study was conducted on caesarean section patients registered in NOIS (2008–2010). From September 2009 data were harvested continuously.
Assessment Data were monitored as cumulative incidence rate and by statistical process control as g chart (number of surgeries between infections including a delayed moving average). Infection control staff reported results to Head of Maternity Clinic monthly.
Results The overall rate of caesarean section surgical wound infections was significantly reduced to 3,1 % (2008-2010 about 1 % in 2010). This result was demonstrated elegantly as a marked shift in process in g-chart. We found the g-chart was efficient, sensitive and simple to handle.
- Surgical wound infection
- caesarean section
- infection control
- quality improvement
- management
- nosocomial infections
Statistics from Altmetric.com
- Surgical wound infection
- caesarean section
- infection control
- quality improvement
- management
- nosocomial infections
Introduction
Despite improved operative techniques and the use of prophylactic antibiotics, surgical site infections continue to account for about 25% of all nosocomial infections. Such infections lead to a significant increase in morbidity, mortality and costs. Surgical wound infection after caesarean section is a well known complication occurring in approximately 9% of all procedures.1–3 The majority of these infections are superficial but nevertheless cause a great deal of worry and concern for the mother. The rate of caesarean sections is currently approaching 15% in Norway, thus almost 1000 Norwegian women are affected annually by this complication.3
It is mandatory that all Norwegian hospitals participate in the Norwegian Surveillance System for Hospital-acquired Infections (NOIS).4 The NOIS monitors the incidence of surgical wound infections after given surgical procedures, including caesarean section. The data are collected annually over a 3-month period (1 September to 30 November). NOIS registration is based on criteria given by the Centers for Disease Control.5 Endpoints in the surveillance system are surgical wound infections (superficial infections, deep infections, organ/body cavity infections). These events are recorded at discharge and 30 days after the surgical procedure.
Data from the Norwegian Institute of Health showed a national incidence (NOIS) of approximately 8% for caesarean section surgical wound infections (2005–2007).3 The corresponding rate in Baerum Hospital (2006–2007) was significantly higher at 17.4%.
Efficient infection control requires risk management and leadership. These are essential measures for improving quality. Dansk Standard in Copenhagen has combined all essential aspects of EN-ISO 9001:2010 and risk management within infection control and produced an efficient tool for infection control in hospitals in their tailored standard for hospital infection control.6 7
Concern about two consecutive years of high infection rate in Baerum Hospital triggered this improvement project. The goal was to reduce the surgical wound infection rate to below the corresponding national level of 8%. Management from the Maternity Clinic and Head of Infection Control were responsible for initiating the intervention. Awareness and education in quality improvement were also important factors at this time. The authors wanted to investigate whether implementation of the measures was sufficient to reach the objectives and to test the sustainability of the intervention.
Materials and methods
The intervention was implemented at the Maternity Clinic of Baerum Hospital. This hospital is part of Vestre Viken Hospital Trust (VV), which was established in January 2010 after a merger of four hospitals. VV includes a total of about 900 beds and covers about 10% of the Norwegian population. The annual birth rate of the Maternity Clinic at Baerum Hospital is 2500, and the caesarean section rate is approaching 15%. VV is located close to the Norwegian capital of Oslo.
The Head of the Maternity Clinic established the improvement team. The team comprised staff with a comprehensive understanding of the treatment process and included representatives from all aspects of patient care (a midwife from the maternity ward, an obstetrician, a secretary responsible for NOIS data registration, a surgical nurse, the Head of the Infection Control Department and staff, and one former patient who had recently undergone an uncomplicated caesarean section). During the first meeting the responsibility for running the project was handed over to the Deputy Head of the Maternity Clinic. Prior to initiation and during the first 6 months of the intervention project it was necessary for the improvement team to meet monthly; thereafter meetings became less frequent and were held only when necessary.
Brain storming was used to acquire a detailed description of patient flow, and to identify aspects of patient care that might benefit from intervention. This led to the improvement of existing procedures and the establishment of new ones. The improvement team concluded that several measures were needed. The measures chosen for quality improvement are shown in table 1.
The measures that were introduced as part of the intervention
The Cochrane review of techniques for caesarean section was used to ensure that the procedures were in accordance with the best available evidence for reducing the risk of wound infections.8
The importance of adherence to procedures was emphasised. The surgical and anaesthesiology staff assumed responsibility for recording preoperative and per-operative data. The gynaecologist or midwife was responsible for recording data on discharge. The Maternity Clinic secretary was responsible for retrieving data from the hospital databases and collecting data from patient questionnaires. Each patient received a questionnaire 30 days postoperatively, in which they were asked whether the wound had healed normally and if there had been any signs of infections. All deep surgical wound infections and organ/body cavity infections had to be diagnosed by a physician according to criteria given by the CDC.5 The secretary also had responsibility for contacting non-responding patients and collecting data by telephone. Staff from Infection Control were responsible for quality control of data and data processing. Members of the improvement team were responsible for informing colleagues about the project and the new measures introduced to their unit.
The NOIS was founded in 2005. At first, data were registered annually over a 3-month period. Baerum Hospital joined the NOIS in 2006. Since December 2009 data have been registered on a continual basis (unlike most other Norwegian hospitals) rather than for 3 months each year. Mandatory continual registration was introduced nationally from September 2011.
Since we needed a sensitive system to monitor the results of our intervention, the Head of Infection Control chose to use statistical process control (SPC) in addition to annual cumulative incidence. SPC is a method combining time series analysis with visual presentation of data. The SPC data were analysed as the number of surgeries between infections, that is, as a g-chart. The g-chart is an efficient and sensitive tool for monitoring shifts within a process, thus enabling early recognition of an intervention. In addition, the g-chart is simple to handle once established. Collected data were plotted in the g-chart. Each defect (patient with infection) was plotted as a single data point. In addition to this curve reflecting individual patients, a delayed moving average was introduced into the chart. The moving average included a width of 30 and a delay of 10 observations, which has been described as suitable.9 A third curve showing our goal (12.5 surgeries between infections = infection rate of 8%) was also introduced into the g-chart.
The results of the intervention were closely monitored by the staff from Infection Control. The Head of Infection Control maintained a current analysis of SPC data. The staff reported these results on a monthly basis to the Head of the Maternity Clinic.
Results
The study included 744 women who had a caesarean section. The follow-up rate was above 90 % in the two groups (before and after intervention). Forty-seven cases of surgical wound infection were identified. None of these were diagnosed during hospitalisation. All of the wound infections were characterised as superficial skin infections and not as deep wound infections. Patients themselves or their physicians diagnosed the type of infection.
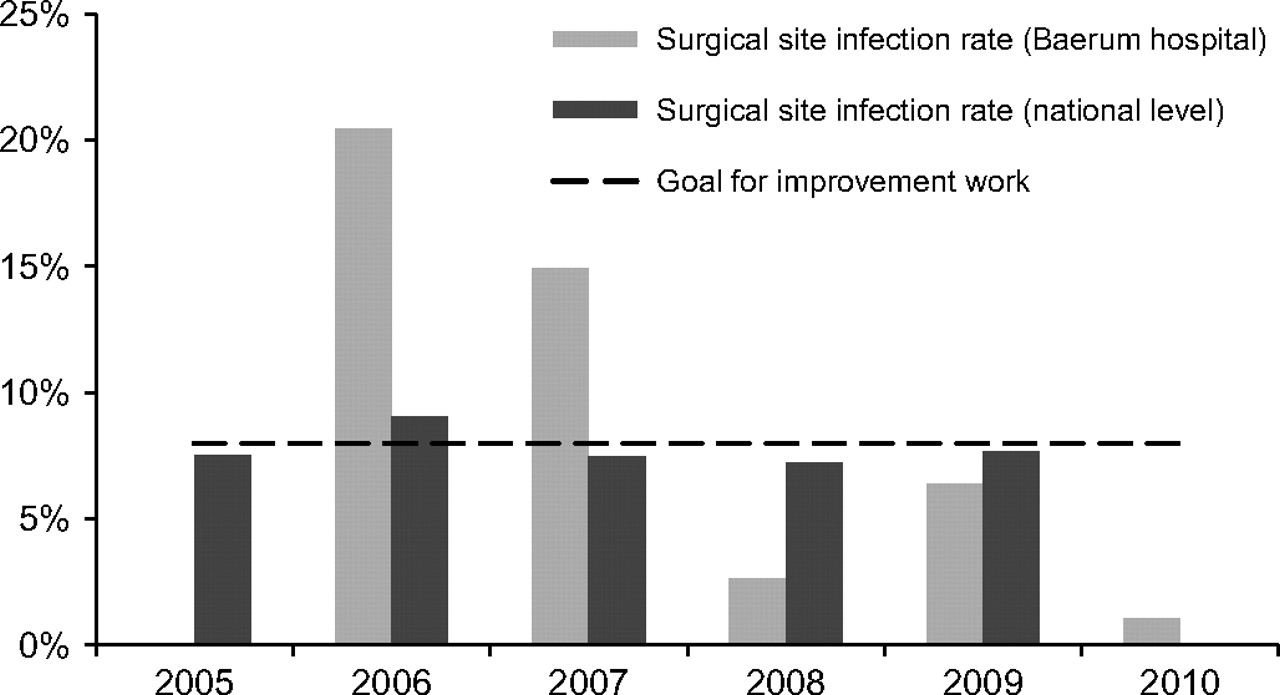
Figure 1 shows a significant reduction in the incidence of surgical wound infections at Baerum Hospital after the intervention was initiated. The intervention was implemented during August 2008, that is, before data for 2008 were collected. All measures were introduced simultaneously. In 2006 the incidence of surgical wound infection was 20.9%, and in 2007 the level was 14.9%. During 2008 the infection rate had fallen to 2.6%, and values for the subsequent years were 6.4% in 2009 and 1.1% in 2010. Figure 1 also illustrates the national incidence of surgical wound infection and the goal of our intervention, which was about 8%. Our project did not include adherence data for the different components of the intervention.

Successful results of the intervention which reduced the incidence of surgical site infection in caesarean sections. Before the intervention the incidence was unacceptably high (2006 and 2007) compared with the national level. As a result of the intervention the incidence was reduced (2008–2010) significantly below the goal of 8%. The results were sustainable.
Table 2 demonstrates highly significant results (p<0.000). The pre-intervention and post-intervention data presented in table 2 show a significant (p<0.004) increase in operation time following the intervention. The median operation time before the intervention was 31 min and after the intervention it increased to 37 min. There was no significant difference between the groups in elective surgery rate, patient age or follow-up rate.
Post-caesarean section surgical wound infection characteristics from figure 1
Discussion
The quality improvement project was a major success. The incidence of surgical wound infections after caesarean section was reduced significantly from 17.4% in 2006–2007 to 3.1% in 2008–2010.
The project was initiated as a multidisciplinary bundle intervention as a result of an unacceptably high infection rate. The intervention, which included several simple measures, also involved education and awareness programmes in quality improvement. Leadership involvement was essential for success.
The result by far exceeded the goal, which was to achieve an incidence of surgical wound infections after caesarean section similar to the national rate of 8%. Thus, data presented in figure 1 demonstrate that after the first year of the intervention the incidence of surgical wound infections after caesarean section at Baerum Hospital had fallen to 2.6%, but had increased somewhat the following year to 6.4%. This increase in the infection rate in 2009 prompted reinforcement of the intervention measures and the incidence of surgical wound infections after caesarean section was further reduced to 1.1% in 2010. The sustainability of the results can probably be attributed to the close collaboration between the Infection Control staff and the Maternity Clinic.
According to the literature, the incidence of surgical wound infection after caesarean section is usually less than 10%,1–3 10 although some centres have reported higher rates as was the case at the Maternity Clinic at Baerum Hospital.11 Others have described successful interventions. Thus, it is plausible to assume that the average rate of surgical wound infection after caesarean section may be reduced to a level far below 8%. According to Rauk, the infection rate was reduced significantly from 7.5% to 1.2% as a result of an educational and training intervention based on instrument sterilisation and skin preparation.12 The results of this intervention concur with those of Rauk, although we added several other measures, including sterile gowns for midwives during delivery, surgical sutures coated with antibiotics, a new type of bandage, double sets of sterile gloves for surgeons. Adherence to hand hygiene was also improved.
The results demonstrate that the g-chart is a powerful tool for monitoring improved process performance. The results are in accordance with others who have demonstrated the efficiency and sensitivity of the g-chart in tracing rare events.9 13 14 The obvious need for benchmarking made it easy to choose the number of surgeries (caesarean sections) instead of the number of days between infections. The g-chart is now used as a daily tool in Baerum Hospital for following this process. By introducing the moving average value, progress could be closely monitored; that is, improved process performance could be visualised in real time. In addition, a moving average demonstrates real-time process performance thus enabling goal adjustment.9 Although SPC is a useful tool in infection control, there are surprisingly few publications about this. However, it has been shown that SPC is an efficient tool to feedback and counteract uncontrolled hospital spread of methicillin-resistant Staphylococcus aureus.15
This project shows that a hospital organisation through conscious and resolute leadership can go far with relatively simple means and measures. ISO 9001 and especially the infection control management system from Dansk Standard, which has been developed especially for risk management and leadership within this field, proved very efficient.7
Because all measures were introduced simultaneously, the relative importance of each of them cannot be specified. However, the results exceeded our goal and so it is reasonable to indicate some success criteria. These criteria were management involvement, good communication and a mutual awareness among staff.
The intervention involved several disciplines that were not formally attached to the project, including anaesthesiology and operating room staff. It is therefore worth noting the success of the intervention despite this error of formality, which might easily have threatened the project. Targeted communication, involvement of staff from relevant units and all-round enthusiasm for the project might explain how problems were avoided.
An intervention like this is also likely to be successful in similar settings, such as maternity clinics, general surgery units, orthopaedics and other surgical units. Good communication and cooperation will remain essential for success.
To obtain sustainable success, relevant levels of hospital management will be included in forthcoming interventions. Similarly, process indicators like adherence to hand hygiene procedures also strengthened the intervention.
The cost of the intervention was limited to the price difference between the new and the old regimes (including surgical gloves, sutures, gowns, bandages) and amounted to NOK 60 per patient. Alcohol hand rub and the time taken to adhere to the alcohol hand rub procedures were not included in cost estimation.
It is worth noting that during spring 2011, and well after the four hospitals were merged into VV, a new goal was established. As a result of the success in Baerum Hospital the new goal was set at an incidence rate of 3% and was made valid for all four hospitals from May 2011. Enthusiastic improvement work has been launched in two of the remaining three hospitals during fall 2011 as a result of this new and improved goal.
The present results describe a straightforward intervention that yielded a significant reduction in the rate of surgical wound infection after caesarean section. The results exceeded the established objectives. A g-chart was used to monitor real-time results of the intervention, and this method was found to be efficient and simple. Frequent reporting of results to the Head of the Maternity Clinic, frequent meetings with the improvement team, and targeted communication with relevant staff were several of the factors contributing to the success. Furthermore, the authors found that surveillance should be continuous. The results demonstrate that it was possible to improve the outcome with simple and cheap measures.

Shift in process with start of intervention (arrow). Data from figure 1 and table 2 were plotted as a g-chart, that is, the number of caesarean sections between defects (patients with surgical site infection). Each data point reflects one defect. The intervention pushed the average level of the process from about 6 towards the goal of 12.5 surgeries between defects. The graph contains continuous data from September 2009; however, before September 2009 only 3 months of annual data were available (September–November).
References
Footnotes
Competing interests None.
Provenance and peer review Not commissioned; externally peer reviewed.
Data sharing statement Data available on request from the corresponding author.