Article Text

Abstract
Background Our goal was to compare hospital scores from the most widely used commercial website in the USA to hospital scores from more systematic measures of patient experience and outcomes, and to assess what drives variation in the commercial website scores.
Methods For a national sample of US hospitals, we compared scores on Yelp.com, which aggregates website visitor ratings (1–5 stars), with traditional measures of hospital quality. We calculated correlations between hospital Yelp scores and the following: hospital percent high ratings (9 or 10, scale 0–10) on the ‘Overall’ item on the Hospital Consumer Assessment of Healthcare Providers and Systems (HCAHPS) survey; hospital individual HCAHPS domain scores (eg, nurse communication, pain control); hospital 30-day mortality; and hospital 30-day readmission rates.
Results Of hospitals reporting HCAHPS (n=3796), 962 (25%) had scores on Yelp. Among hospitals with >5 Yelp ratings, the correlation of percent high ratings between Yelp and HCAHPS was 0.49 (p<0.001). The percent high ratings within each HCAHPS domain increased monotonically with increasing Yelp scores (p≤0.001 for all domains). Percent high ratings in Yelp and HCAHPS were statistically significantly correlated with lower mortality for myocardial infarction (MI; −0.19 for Yelp and −0.13 for HCAHPS) and pneumonia (−0.14 and −0.18), and fewer readmissions for MI (−0.17 and −0.39), heart failure (−0.31 and −0.39), and pneumonia (−0.18 and −0.27).
Conclusions These data suggest that rater experiences for Yelp and HCAHPS may be similar, and that consumers posting ratings on Yelp may observe aspects of care related to important patient outcomes.
- Healthcare quality improvement
- Hospital medicine
- Patient satisfaction
- Performance measures
- Report cards
Statistics from Altmetric.com
Introduction
Commercial websites that post consumer ratings of businesses are increasingly popular. They have begun including ratings of physicians and hospitals, and the number of healthcare ratings grew dramatically from year 2005 to 2010.1 These websites generally have online visitors give a numerical rating and then report the average of the individual visitors’ ratings as the hospital score.2 Concerns about these ratings include selection bias of raters and the raters’ lack of medical expertise to judge the quality of care being delivered.3 ,4
The commercial sites’ scores are salient to clinicians and hospital leaders because these sites have high consumer traffic. For instance, one popular commercial site, Yelp.com, that has a mostly US presence (though it has expanded to cities internationally),5 reports more than 50 million unique visitors each month, and has 20 million user ratings available on its site.6–8 The vast majority of these visitors are seeking information about other types of businesses or services, but consumer awareness of these sites is clearly high, with Yelp ranked in the top 50 most popular websites in the USA.9 By contrast, only 6% of Americans have heard of the US Centers for Medicaid and Medicare Services’ (CMS) national hospital public reporting website, hospitalcompare.hhs.gov.10 The commercial sites’ scores are also salient because consumers are actively using this type of online media to inform their healthcare choices. A recent survey found that 42% of US consumers have used social media to access health-related consumer reviews of treatments or physicians, with 41% saying that information found via social media would affect their hospital choice.11
Given the use of these kinds of data by consumers, it will likely be important to hospitals and clinicians to understand how many hospitals are receiving consumer ratings on commercial websites, how much variation there is in the scores that websites assign to hospitals based on consumer ratings, and whether those scores in any way reflect on clinical care. Since the scores on the commercial websites are generated by consumers, the most relevant comparator in the USA is scoring from the Hospital Consumer Assessment of Healthcare Providers and Systems (HCAHPS). In the USA, HCAHPS is widely considered the industry standard for assessing patient experience, and is a metric in the new value-based purchasing programme of the US Center for Medicare and Medicaid Services.12 Prior research has shown that overall HCAHPS scores are associated with performance in certain domains of patient experience and some processes of care.13 ,14 HCAHPS scores are derived from survey data from randomly selected patients, which is usually gathered through modes that do not require internet access, such as a telephone or mailed surveys. The HCAHPS results are then risk-adjusted using a published model.15 ,16 This process is highly standardised and well validated, while the approaches used by commercial websites are neither. Given the differences in commercial website and HCAHPS methodologies, it is possible that the scores are driven by different domains of care or that the commercial website scores are not associated with HCAHPS or with other previously validated quality indicators.
Another approach to evaluating the commercial site scores is to assess their relationship with clinical outcomes of care. For instance, prior studies of online ratings from the UK suggest that the opinions of consumers who choose to visit a website and leave a rating may be correlated with readmissions, mortality and infections.17 ,18 However, these studies examined the website of the National Health Services (NHS), the national government healthcare agency in the UK, which may attract very different types of raters. The NHS website also solicits ratings using a structured feedback instrument, so these prior findings may not generalise to unprompted raters on commercial sites.
In order to better understand the quality of the information available to consumers using commercial site ratings, we systematically searched for commercial websites scoring hospitals nationally. For the site with the most hospitals scored, we assessed the number of hospitals with ratings and the dates of ratings, and assessed the correlation between these hospitals’ scores and important traditional measures of quality: the HCAHPS survey; 30-day mortality rates; and 30-day readmission rates. To better understand what drives consumer visitor scores, we also analysed the relationship between the commercial site's scores and individual HCAHPS domains (eg, nurse communication or pain control).
Methods
We use ‘rating’ to refer to an individual patient's response to HCAHPS or an individual consumer's post on a commercial website, and ‘score’ to refer to measures that summarise the individual ratings at the hospital level.
Data
We used publicly available hospital quality scores, accessible to consumers trying to learn about hospitals.
Hospital sample
All hospitals which had HCAHPS, mortality and readmissions data on the CMS website were included.
Commercial websites with publicly available ratings
Since there are multiple commercial websites offering provider scores,2 we first determined which sites were likely to be found by consumers searching for hospital information (see online supplementary eMethods 1). We only looked at sites rating US hospitals, since the performance on the standardised patient experience measure and the outcomes measures was uniformly available only for a national set of US hospitals. We excluded ‘members-only’ sites requiring a subscription fee, such as Angie's List, because this membership requirement may exacerbate the selection bias and greatly limits who can post and use ratings. We therefore used Yelp.com data for the study as the only free, publicly available commercial website with scores on multiple hospitals in multiple US states (see online supplementary eMethods 1).
Yelp visitor demographics and scored businesses
Yelp's user demographics from 2011 are reported in an online network analysis of social media sites: 55% female, proportions of users by age are: ∼75%, 25–54 years ∼17%, 55–65+ years and ∼8%, 0–25 years.19 There are no data available regarding Yelp visitors’ use patterns. Yelp reports numbers of businesses scored in individual cities by 22 categories, including restaurants, shopping and automotive, as well as hospitals and doctors (see online supplementary eTable 1).20 For all categories, Yelp reports that as of the second quarter of 2012, 56% of ratings on the site were 4 or 5 stars, 14% 3 stars, and 20% 1 or 2 stars.21
Yelp data
Yelp allows visitors to rate hospitals from 1 to 5 stars, then aggregates the ratings and reports the aggregate score. Yelp uses an automated filter to exclude reviews that are deemed malicious or self-promoting, and ratings are included only from visitors who are frequent reviewers.22 The exclusion and inclusion algorithm for ratings, including the definition of ‘frequent reviewer,’ is proprietary.
We limited our data gathering to 1 week in time, starting 21 March 2011, and included in the analysis all ratings posted prior to that week. This cross-sectional approach mimics the approach a consumer is likely to take: looking for information about hospitals once at a particular point in time, rather than looking at some hospitals at one time point and other hospitals at another time point and synthesising the information over weeks to months.
We gathered the following data elements for each hospital: whether it had any Yelp ratings, the reported summary star scores for the hospital (integer and half integer values, rounded up or down from the exact average), the frequency each star rating was given, and rating dates. Since we could find no prior reports of the inter-rater reliability of collection of Yelp scores, two individuals independently collected the online Yelp data for each hospital, using the procedures described in online supplementary eMethods 2. The kappa statistic for agreement on the Yelp score for individual hospitals was 0.98. Discrepancies on any data point were reconciled by one of the authors (RAP) (see online supplementary eMethods 2).
Hospital characteristics
We obtained hospital characteristics from the American Hospital Association survey, using variables previously shown to be associated with HCAHPS scores (table 1).13 In our comparison of hospital characteristics for groups of hospitals according to number of Yelp ratings (none, 1–5, or >5) we only analysed hospitals with American Hospital Association data (table 1).
Characteristics of hospitals with no, few or more than five Yelp visitor ratings
HCAHPS data and the domains of patient experience
CMS reports HCAHPS23 results that include both overall assessment of the hospital and eight composite quality domains, which summarise a total of 27 HCAHPS survey items. The overall rating of the hospital is on a scale of 0 (worst) to 10 (best). This overall rating has been found to be highly correlated (r=0.87) with the other global item: whether the patient would recommend the hospital to family and friends (possible responses: definitely yes, probably yes, probably no, and definitely no).13 Therefore, we focused on the overall numerical rating, which is more similar to the star rating method. Prior to reporting, CMS adjusts scores for the mode of administration, as well as for eight factors related to the patient (eg, age, education, health status) in order to address non-response and other biases.23 We used data reported on the CMS website in March 2011, reflecting survey responses and response rates for each hospital from October 2009 to September 2010.24
Outcome measures
We assessed the correlation between percent of respondents giving a hospital a high (or low) overall rating in HCAHPS versus on Yelp. For HCAHPS, CMS provides only the percent of respondents giving a low (0–6 out of 10), middle (7–8) or high (9–10) rating. Because of this, we could not calculate mean HCAHPS scores, so we did not use mean Yelp scores as an outcome. We used a development subsample of the hospitals to determine how to group the Yelp 1–5 star ratings into high and low categories that would be most similar to the HCAHPS groupings (see online supplementary eMethods 3). Based on these findings, we defined a low rating on Yelp as a 1-star or 2-star rating, and a high rating as a 4-star or 5-star rating. We then calculated the correlations between percent high ratings on HCAHPS and Yelp and the percent low ratings on HCAHPS and Yelp in the entire dataset.
For our primary analyses, we only included hospitals with a minimum number of Yelp ratings, just as most public reporting sites require a minimum number of eligible patients to report each measure.25 Since there is no precedent for what that minimum number of Yelp ratings should be, we chose a primary requirement of more than 5 Yelp ratings. To determine whether correlations might strengthen as the number of Yelp ratings increased, we compared the correlations between Yelp and HCAHPS hospital scores at different levels of the number of Yelp ratings required (5 or fewer, more than 5, more than 10, more than 15).
Mortality and readmissions rates
We looked for evidence of similarity between Yelp and HCAHPS scores by assessing whether the magnitude and direction of the correlations between percent high ratings on Yelp and hospitals’ risk-standardised 30-day mortality and readmission rates for myocardial infarction (MI), heart failure and pneumonia as reported on the CMS website in March 201126 were similar to the magnitude and direction of correlations between those outcomes and percent high HCAHPS scores.
Statistical analyses
We used t tests assuming unequal variances and χ2 tests to compare hospital characteristics between hospitals with and without Yelp ratings.
All correlations were assessed using Pearson's correlation coefficients. To address the impact of varying numbers of Yelp raters per hospital, we calculated weighted correlation coefficients with weights inversely proportional to the number of Yelp raters.
We evaluated the relationship between summary star score on Yelp and HCAHPS domain items using a test of trend of mean percent of positive answers (‘always’ had a positive experience) for each domain over 4-star score categories: 1–1.5 stars, 2–2.5, 3–3.5 or 4–5 (since there were only two hospitals with star scores of 5, these were grouped with 4–4.5, instead of being evaluated separately).27 We chose to analyse these groupings instead of grouping by quartile of exact average star scores for hospitals, since the summary star scores are the data available to providers and consumers when reviewing the sites, and so the star groupings are more clinically relevant. Analyses were performed using STATA V.12 (Stata Corp). The study was considered exempt by the committee on human research at the University of California San Francisco.
Results
There were 3796 hospitals with HCAHPS, mortality and readmissions data available on the CMS website (HospitalCompare.hhs.gov), of which 25% (n=962) had at least one Yelp rating. The mean response rate to the HCAHPS survey was 33%. For hospitals with any ratings available on Yelp, the mean number of consumer ratings per hospital was 6.5 (95% CI 5.7 to 7.3; median 2; range: 1–159; total ratings=6260). For hospitals with more than five ratings on Yelp (n=270), the mean percent of high ratings on HCAHPS and Yelp were 65% (95% CI 64% to 66%) and 56% (95% CI 53% to 58%), respectively. The mean star score was 3.3 stars, and 74% had scores of 3 stars or better.
The number of ratings was increasing over time: 22% of all study ratings were from 2009 and 34% from 2010. Posted ratings were recent, with 60% of hospitals having their most recent rating dated in 2011 or in the last quarter of 2010.
Characteristics of the hospital sample
Table 1 shows that hospitals that had more than five ratings on Yelp were more frequently large, Western, non-profit, academic and urban compared with those with no Yelp ratings (and hence no Yelp score). Hospitals with more than five Yelp ratings also had lower nurse staffing and a higher percent Medicaid patients compared with unrated hospitals.
Relationships between Yelp scores and HCAHPS overall scores
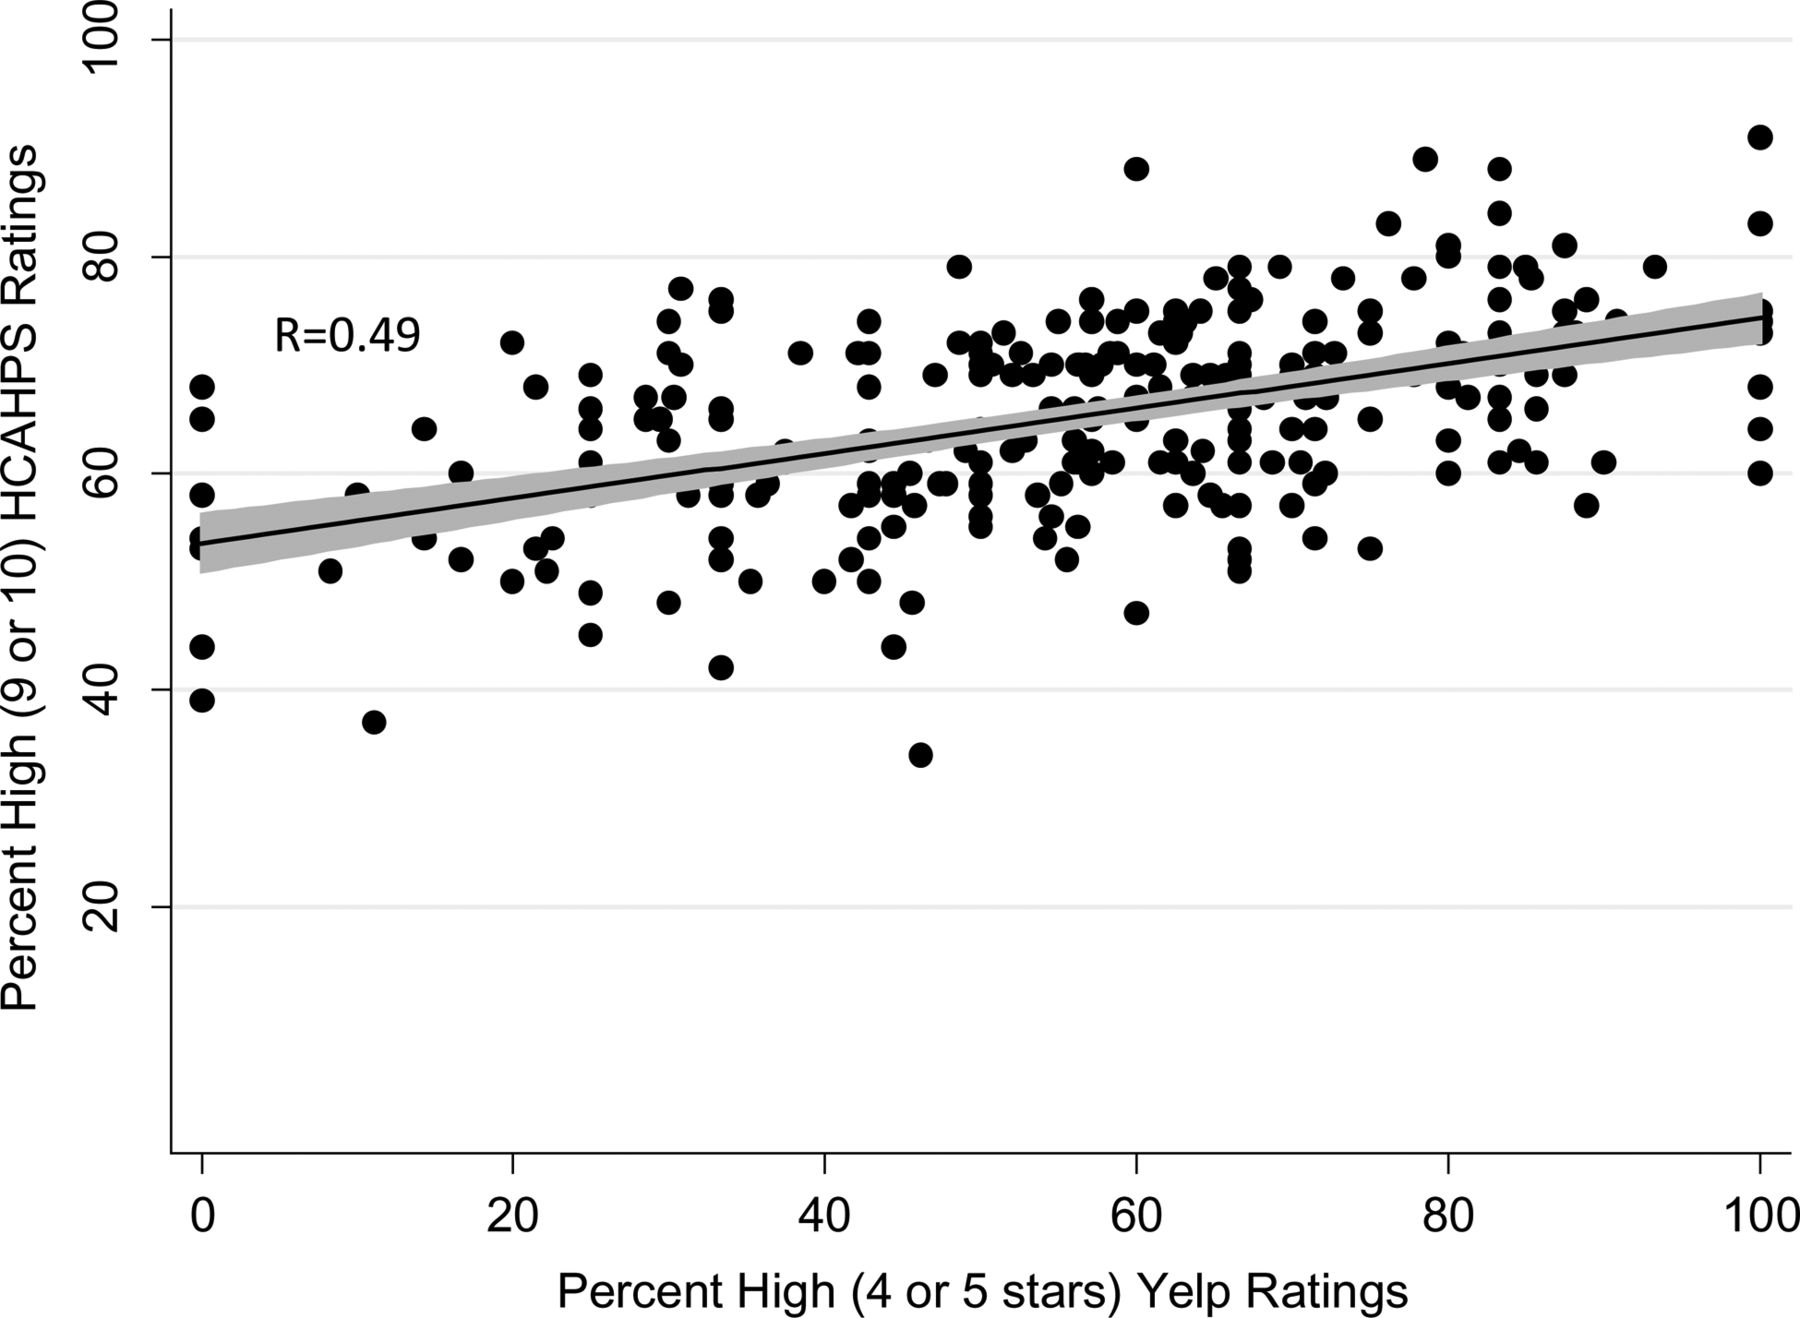
Among hospitals with more than five Yelp ratings, the correlation between the percent high ratings from HCAHPS and from Yelp was 0.49 (figure 1), while the correlation between the percent low ratings for each system was 0.47. The correlations varied with the number of individual ratings on Yelp, increasing when hospitals with five or fewer ratings were excluded, and then changing only slightly when excluding hospitals with fewer than 11 or 16 ratings (table 2).
Correlations between percent of high and low ratings on Yelp and Hospital Consumer Assessment of Healthcare Providers and Systems (HCAHPS)

Relationship between percent of high ratings on Yelp and Hospital Consumer Assessment of Healthcare Providers and Systems. Hospitals with more than 5 Yelp ratings (n=270) were included. The line-of-fit (solid black line) and 95% confidence interval (grey shading) is portrayed. R, Pearson's product moment correlation coefficient, used weights inversely proportional to the number of Yelp raters. p Value for correlation is <0.001.
Relationships with outcomes
The percent high Yelp ratings was correlated with lower readmission rates for all conditions and with lower mortality for MI and pneumonia. The direction and magnitude of these correlations were similar to correlations with the percent high HCAHPS ratings (table 3).
Correlations between clinical outcomes within 30-days and average Yelp score
Potential explanatory factors for Yelp scores
We stratified hospitals by star score (table 4) to assess for differences in performance within individual HCAHPS domains. In all cases, increasing Yelp scores were associated with consistently increasing HCAHPS domain scores, with p≤0.001 in every domain (table 4). In terms of overall HCAHPS ratings, hospitals in the top category of star scores had 18% more of 9 or 10 ratings than hospitals in the bottom category. Domains in which hospitals in the top star score category had more than 10% better performance than hospitals in the bottom category were communication with nurses, availability of help and pain control.
Relationships between Yelp score and Hospital Consumer Assessment of Healthcare Providers and Systems (HCAHPS) ratings and individual HCAHPS domains
Discussion
This study provides a portrait of consumers’ ratings of hospitals on a widely used commercial website. We found that many hospitals have already been rated, and that the number of hospital ratings increased over time, though the average number of ratings per hospital was still low. While most hospitals scored 3 stars or better, some did not. This is likely to be important to the hospitals and to the people who work there, since the potential audience for these ratings is large, potentially larger than the audience at CMS’ website and other non-profit public reports.10 ,28
The correlation we found between Yelp star scores and HCAHPS overall scores (0.49) is unexpectedly high; 0.50 is often cited in interpretation of correlations in the social sciences as the cut-off between ‘moderate’ and ‘strong’ correlation, although there is no universal consensus about interpreting correlations.29 We had hypothesised that there would be only a weak relationship between star scores and HCAHPS scores for several reasons. First, the approaches differ in sampling, with the commercial website using a self-selected sample of visitors who might be expected to have more extreme views than randomly solicited HCAHPS respondents. Second, the consumers providing the ratings may differ in case mix (ie, proportion of medical, surgical or obstetrical hospitalisations), a factor that is adjusted for in the HCAHPS scores but not the star scores.15 ,16 In addition, internet users tend to be younger than the general population,30 ,31 while respondents to phone and mailed surveys, such as HCAHPS, tend to be older,32 and so the Yelp raters may be younger than the HCAHPS respondents. These differences between the two populations may have confounded the relationship between HCAHPS and Yelp scores. For instance, HCAHPS adjusts for age, since it has been shown that younger patients give lower ratings.15 By contrast, commercial websites do not, which may explain the lower percent of high ratings on the commercial website than HCAHPS (56% vs 65%).
Though these differences in methods between the two approaches made the correlation unexpected, our other analyses supported the finding, including the consistent pattern that better performance within each HCAHPS domain was associated with higher Yelp scores. Yelp raters are not prompted to reflect on any of those domains specifically, so this robust pattern suggests that these domains are likely important to Yelp raters in a way that is similar to HCAHPS respondents. The HCAHPS domains that vary most with Yelp scores (nurse communication, availability of help and pain control) have previously been shown to be domains that are strongly associated with high overall HCAHPS ratings.14 Increasing the potential significance of these findings for hospitals is the 18% difference in percent high HCAHPS ratings between the top and bottom categories of hospitals by star scores. This difference in HCAHPS scores is a much larger difference than differences associated with other hospital factors, such as nurse staffing, profit status, census region and percent Medicaid patients (range of associated performance differences: 0–7.3%).13
In addition, better scores in Yelp are correlated with lower mortality rates for MI and pneumonia, and lower readmission rates for multiple conditions, with similar direction and magnitudes as HCAHPS correlations with these outcomes. These findings reinforce the early observations from the UK,17 and imply that consumers posting ratings on commercial websites may be observing meaningful aspects of hospital quality of care. The −0.19 correlation between Yelp scores and mortality for MI approaches the −0.25 correlation previously observed between a composite measure of technical processes of MI care and mortality.33 Though many technical processes of care have a strong evidence base that they can improve outcomes, and patient ratings have not correlated in some settings with technical aspects of care,34 it may be that patients observe additional elements of care delivery that are less technical but still important.
Although correlations do not prove causation, taken together, the data suggest that the ratings posted on the commercial website may be capturing experiences similar to those driving the more systematically collected HCAHPS ratings, and that improvements in either patient experience measure may be associated with improvements in patient outcomes. Assuming that there are differences in rating populations for each measure, the associations with improvements in patient outcomes may constitute a reason for hospitals to attend to star scores, since they may reflect the experience of a population whose input they receive less of through other means.
A recent study of Yelp data from the restaurant sector by Anderson and Magruder suggests that this source of data has the capacity to change consumer behaviour. Using regression discontinuity estimates around star reporting cut-points, they found that an extra half-star rating causes restaurants to sell out 19 percentage points more frequently (30% vs 49%), with larger impacts when alternate information is more scarce.35 Of course, consumers have more choice among restaurants than hospitals and can switch restaurants more easily than hospitals, so it is unclear how much this behavioural finding about restaurants will occur with hospital ratings. However, Anderson and Magruder's findings do suggest that voluntary online ratings may warrant the attention of hospital leadership and individual clinicians on the possibility that they may change consumer choice behaviour.36 ,37
Several limitations deserve mention. Our findings may not be generalisable to hospitals that were not rated, which tend to be smaller, non-teaching hospitals in the middle of the USA. Further research will be needed, in the event that these hospitals become rated, to determine whether the relationships we found persist. Second, there are other commercial websites that provide ratings which we did not analyse, but the website studied has the most site visitors currently, ranking within the top 50 most visited sites in the USA.8 ,9 ,38 Because of the small number of reviews available on other websites at the time of our data collection, it was unlikely that we would have been able to conduct stratified analyses to better understand differential selection biases across websites, and so we chose to focus on one website. Third, though the Yelp audience is large,6 ,7 ,9 we do not know how many people look at hospital ratings. However, we found increasing numbers of hospital reviews in the recent time period, which suggests that there is likely an increasing audience as well. In addition, the ratio of doctors to auto mechanics reviewed is approximately one or higher for five of the six major metropolitan areas we looked at (see online supplementary eTable 1), suggesting that consumer interest in healthcare provider ratings may be similar to interest in ratings of other common services. Therefore, for hospitals that are not yet rated on Yelp, this study suggests that the scores may be worthy of some form of attention as hospitals start to garner reviews either on Yelp or other similar websites. Finally, commercial websites can filter the ratings posted, usually with the primary intent of excluding malicious or self-promoting reviews and ratings, but such filters are not transparent. There have been claims in the popular press that businesses can manipulate their ratings,6 ,39 although Yelp has refuted those claims.6 ,22 ,40 If the filtering system was not functioning well, or was being manipulated, one would expect there to be more extreme and more positive views represented, which we did not find for hospitals with at least five reviews posted. Although the filtering system may be functioning as Yelp describes, this controversy highlights the importance of understanding whether the ratings posted seem to reflect the underlying performance as measured by validated, standardised methods such as HCAHPS.
In summary, this analysis of consumers’ ratings of hospitals on a widely used, publicly available commercial website provides insight into how voluntary raters on this site view hospital performance. As the consumers providing these ratings may be a very different population from HCAHPS respondents, they may represent a distinct source of feedback for hospitals. Our analysis of their ratings suggests that these consumers may have an important perspective on variations in quality of inpatient care. Lastly, there is evidence from this data that performance on star scores varies, and our analysis identified domains of care that may drive these variations. For these reasons, hospital leaders and clinicians may want to learn how their own institutions are scored, and consider these scores as one useful input in their overall plans for quality improvement.
Acknowledgments
The authors are solely responsible for its content and the opinions expressed do not necessarily represent the views of the California HealthCare Foundation.
References
Supplementary materials
Supplementary Data
This web only file has been produced by the BMJ Publishing Group from an electronic file supplied by the author(s) and has not been edited for content.
Files in this Data Supplement:
- Data supplement 1 - Online supplement
Footnotes
-
Contributors NSB contributed to study design, data collection tools and data collection, analytic plan, interpretation of results, and drafting and revision of the paper. She is guarantor. RAP contributed to data collection tools and data collection, cleaning and analysing the data and revision of the draft paper. WJB contributed to analytic plan, interpretation of results and revision of the draft paper. RAD contributed to study design, analytic plan, interpretation of results and revision of the draft paper.
-
Funding This research was supported by the California HealthCare Foundation, the National Institute for Children's Health and Human Development (K23 HD065836), and the NCRR UCSF CTSI (KL2 RR024130-05).
-
Competing interests None.
-
Ethics approval The Committee on Human Research at the University of California San Francisco.
-
Provenance and peer review Not commissioned; externally peer reviewed.
-
Data sharing statement Naomi S. Bardach had full access to all the data in the study and takes responsibility for the integrity of the data and the accuracy of the data analysis.