Article Text

Abstract
Objectives (1) To determine the distribution of formal patient complaints across Australia's medical workforce and (2) to identify characteristics of doctors at high risk of incurring recurrent complaints.
Methods We assembled a national sample of all 18 907 formal patient complaints filed against doctors with health service ombudsmen (‘Commissions’) in Australia over an 11-year period. We analysed the distribution of complaints among practicing doctors. We then used recurrent-event survival analysis to identify characteristics of doctors at high risk of recurrent complaints, and to estimate each individual doctor's risk of incurring future complaints.
Results The distribution of complaints among doctors was highly skewed: 3% of Australia's medical workforce accounted for 49% of complaints and 1% accounted for a quarter of complaints. Short-term risks of recurrence varied significantly among doctors: there was a strong dose-response relationship with number of previous complaints and significant differences by doctor specialty and sex. At the practitioner level, risks varied widely, from doctors with <10% risk of further complaints within 2 years to doctors with >80% risk.
Conclusions A small group of doctors accounts for half of all patient complaints lodged with Australian Commissions. It is feasible to predict which doctors are at high risk of incurring more complaints in the near future. Widespread use of this approach to identify high-risk doctors and target quality improvement efforts coupled with effective interventions, could help reduce adverse events and patient dissatisfaction in health systems.
- Health services research
- Patient satisfaction
- Quality improvement
- Health policy
This is an open-access article distributed under the terms of the Creative Commons Attribution Non-commercial License, which permits use, distribution, and reproduction in any medium, provided the original work is properly cited, the use is non commercial and is otherwise in compliance with the license. See: http://creativecommons.org/licenses/by-nc/3.0/ and http://creativecommons.org/licenses/by-nc/3.0/legalcode
Statistics from Altmetric.com
Introduction
To many doctors who are sued or complained against, the event seems random. At the population level, however, there are patterns. Previous studies have compared doctors who experienced multiple malpractice claims,1–5 complaints,6 ,7 and disciplinary actions8–10 with doctors who experienced few or none, and identified differences in the sex, age and specialty profile of the two groups. Such research helps to explain medico-legal risk retrospectively, but does not provide practical guidance for identifying risks prospectively. Clinical leaders, risk managers, liability insurers and regulators all lack reliable methods for systematically determining which doctors should be targeted for assistance and preventive action before they acquire troubling track records. Consequently, the medico-legal enterprise remains reactive, dealing primarily with the aftermath of adverse events and behaviours that lead to costly disputes.
The conventional wisdom is that future medico-legal events cannot be predicted at the doctor level with acceptable levels of accuracy.11 ,12 Numerous studies have tried,13–23 most with limited success. This body of research has two important shortcomings. First, only a few studies15 ,17 ,21 report a method for predicting medico-legal risk that is potentially replicable, and these methods are statistically complex. The practical consequence is that regulators and liability insurers today have no clear way of estimating risk at the practitioner level, and doing so is not a standard part of risk management practice.
Second, no study to date has found a way to deal well with temporal aspects of risk, such as the evolving nature of doctors’ medico-legal event histories, which can be crucial information in assembling a risk profile. Previous claims and complaints have been identified as an important predictor of future events, but only in analyses that specify this variable crudely—usually by ‘freezing’ a doctor's track record at a specific point to estimate a ‘one-time’ effect.13 ,14 ,16 ,17 ,19 ,21 ,24 ,25 This approach is out of step with how claims and complaints are managed. The frontline challenges are to determine how a practitioner's risk profile changes over time as new information (including new events) comes to hand; when support or intervention measures to prevent further events are warranted; and how strong those measures should be. A risk prediction method that helped to address these questions would have considerable potential for boosting the contribution of medico-legal institutions to quality improvement.
We assembled a national sample of nearly 19 000 formal healthcare complaints lodged against doctors in Australia between 2000 and 2011. We then used a time-to-event method of analysis to determine characteristics of doctors poised to incur recurrent complaints, and to estimate each practitioner's risk of recurrence at specific time points. The study had two main goals: to identify predictors of complaint-prone doctors in Australia, and to develop a robust and useful method for forecasting medico-legal risk.
Methods
Setting
Health service commissions (Commissions) are statutory agencies established in each of Australia's six states and two territories. Commissions have responsibility for receiving and resolving patient complaints about the quality of healthcare services. Patients or their advocates must initiate complaints in writing, but the process is free and legal representation is optional.26
Table 1 compares the jurisdiction and functions of Commissions to those of the two other agencies that handle medico-legal matters in Australia—civil courts and the Medical Board of Australia.
Jurisdiction and functions of key agencies with responsibility for medico-legal matters in Australia
Outside of the clinic or hospital in which care is received, Commissions are the primary avenue of redress for patients dissatisfied with the quality of care they have received. Plaintiffs’ lawyers in Australia will rarely take on cases unless they have first proceeded through Commission processes (although the vast majority of complaints do not become negligence claims). At least 10 other Organisation for Economic Co-operation and Development (OECD) countries—including Austria, Finland, Israel, New Zealand and the UK—have similar bodies.27 ,28 In the UK, the closest analogue is the Parliamentary and Health Service Ombudsman.
Commissions in all Australian states and territories except South Australia participated in the study. These seven jurisdictions have 21 million residents and 90% of the nation's 88 000 registered doctors. The study was approved by the ethics committee at the University of Melbourne.
Data
Between May 2011 and February 2012 we collected data on-site at Commission offices in each participating state and territory. Complaints against doctors were identified by querying the Commissions’ administrative data systems. The filing period of interest spanned 12 years and differed slightly by jurisdiction: 2000–2011 for the Australian Capital Territory, the Northern Territory, Queensland, Tasmania and Victoria; 2000–2010 for Western Australia; and 2006–2011 for New South Wales.
All Commissions record the names of persons and institutions that are the subject of complaints, as well as the filing date, the nature of the complaint, the type of health professional named and their practice location. Although all Commissions recorded doctors’ clinical specialty, the quality of this variable was mixed. Doctors’ age and sex were not routinely collected. We therefore supplemented the Commissions’ administrative data with data from another source.
AMPCo Direct, a subsidiary of the Australian Medical Association, maintains a comprehensive list of doctors in Australia, including information on their sex, date of birth, specialty and subspeciality, and practice location. We purchased the AMPCo Direct database and matched doctors listed in it to doctors named in the complaints databases. The matching method is described in an online supplementary appendix.
Variables
We coded specialty into 13 categories, based on those promulgated by the Medical Board of Australia.29 Doctors’ principal practice address was classified as urban or rural, based on the location of its postcode within a standard geographic classification system.30 The nature of concerns raised in complaints was sorted into 20 broad ‘issue’ categories. Commissions run dispute resolution processes; they generally do not rule on the merit of complaints, nor make findings for or against parties, so it was not possible to include a variable indicating how meritorious complaints were.
Statistical analysis
Distributional analysis
We plotted the cumulative distribution of complaints among two populations of doctors: (1) all unique doctors named in complaints and (2) all practicing doctors in the seven jurisdictions under study (ie, regardless of whether they had been named in complaints). The size of this second population was based on the number of doctors in employment in 2006,31 the median study year. Because certain classes of complaints do not name doctors individually (eg. complaints arising in public hospitals in several of the study jurisdictions), we adjusted the proportions in the distributional calculations to ensure the numerators (number of complaints) matched the denominators (size of the ‘exposed’ segment of the medical workforce). Details are provided in the online supplementary appendix.
Multivariable survival analysis
We used multivariable survival analysis to identify predictors of doctors’ risks of recurrent complaints. Specifically, we used an Anderson–Gill model32 in which the time-scale ran from time from first event (ie, a doctor's earliest complaint) and allowed each doctor in the sample to accrue multiple complaints over the period of observation. The outcome variable was the occurrence of a complaint against a doctor, conditional on the doctor having been named in an earlier complaint. The covariates were the number of prior complaints a doctor had experienced, jurisdiction, and the doctor's specialty, age, sex and principal practice location.
The number of prior complaints was specified as a time-varying covariate. Age was also time-varying in the sense that we allowed doctors to move into higher age categories, commensurate with their age at the time of the complaint. We fit cluster-adjusted robust SEs to account for doctors who experienced repeated complaints over time.
Details of model selection and specification are described in the online supplementary appendix. All statistical analyses were conducted using Stata 12.1.
Risk predictions
To estimate doctors’ risks of experiencing complaints over time, we plotted adjusted failure curves.33 ,34 Details of the statistical techniques used to create these curves are provided in the online supplementary appendix. We also plotted failure curves showing the predicted risk of recurrent complaints for several individual doctors. Values for all failure curves were computed using coefficients from the main multivariable model, and hence, derived from the survivor function, S(t).
Sensitivity analysis
We tested the robustness of estimates from the main multivariable analysis by rerunning the analysis on a subsample of complaints (n=10 010) with issue codes suggestive of relatively serious concerns (namely, poor clinical care, breach of conditions, rough or painful treatment and sexual contact or relationship).
Results
Characteristics of complained-against doctors and complaints
The study sample consisted of 18 907 complaints against 11 148 doctors. Sixty-one percent of the complaints addressed clinical aspects of care, most commonly concerns with treatment (41%), diagnosis (16%) and medications (8%) (table 2). Nearly one quarter of complaints addressed communication issues, including concerns with the attitude or manner of doctors (15%), and the quality or amount of information provided (6%).
Issues in a national sample of 18 907 complaints filed by patients
Seventy-nine percent of the doctors named in complaints were male, 47% were general practitioners and 14% were surgeons (table 3). Examples of several complaints are included in the online supplementary appendix.
Characteristics of 11 148 doctors named in complaints
Incidence and distribution of complaints
Doctors in the sample were complained against an average of 1.98 times (SD 2.31). The distribution was highly skewed, with a small subgroup of doctors accounting for a disproportionate share of complaints.
Figure 1 plots the cumulative distribution of complaints among doctors in six jurisdictions over a decade. (New South Wales data was not included in these plots because the complaints window there spanned only 5 years.) The curve on the left side of the figure shows the distribution of complaints among doctors who experienced one or more complaints in the decade. Fifteen percent of doctors named in complaints accounted for 49% of all complaints, and 4% accounted for a quarter of all complaints. The curve on the right side of the figure shows the distribution of complaints across the full population of practicing doctors, not just those who experienced complaints. Three percent of all doctors accounted for 49% of all complaints, and 1% accounted for a quarter of all complaints.

Cumulative distribution of complaints and doctors named in complaints.
Multivariable predictors of recurrent complaints
In multivariable analyses, the number of prior complaints doctors had experienced was a strong predictor of subsequent complaints, and a dose-response relationship was evident (table 4). Compared with doctors with one prior complaint, doctors with two complaints had nearly double the risk of recurrence (HR 1.93; 95% CI 1.79 to 2.09), and doctors with five prior complaints had six times the risk of recurrence (HR 6.16; 95% CI 5.09 to 7.46). Doctors with 10 or more prior complaints had 30 times the risk of recurrence (HR 29.56; 95% CI 19.24 to 45.41).
Multivariable regression analysis estimating risk of recurrent complaints*
Risk of recurrence also varied significantly by specialty. Compared with general practitioners, plastic surgeons had twice the risk (HR 2.04; 95% CI 1.75 to 2.38), and risks were approximately 50% higher among dermatologists (HR 1.56; 95% CI 1.30 to 1.88) and obstetrician-gynecologists (HR 1.50; 95% CI 1.29 to 1.76). Anaesthetists had significantly lower risks of recurrence (HR 0.65; 95% CI 0.54 to 0.79).
Male doctors had a 40% higher risk of recurrence than their female colleagues (HR 1.36; 95% CI 1.23 to 1.50). Location of practice (urban vs rural) was not significantly associated with recurrence. Compared with doctors 35 years of age or younger, older doctors had 30–40% higher risks of recurrence; this level of heightened risk was similar through the middle-aged and older-aged groups.
Risks of recurrence over time
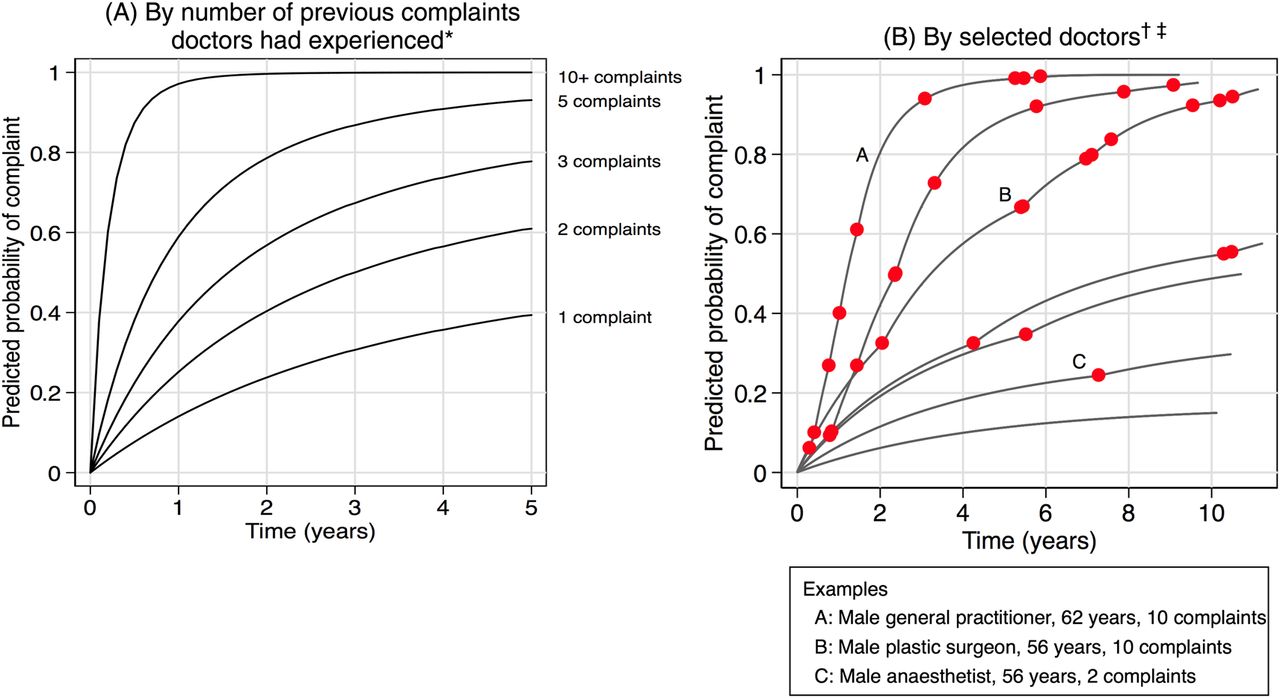
Doctors named in a third complaint had a 38% chance of being the subject of a further complaint within a year, and a 57% probability of being complained against again within 2 years (figure 2A). Doctors named in a fifth complaint had a 59% 1-year complaint probability and a 79% 2-year complaint probability. Recurrence was virtually certain for doctors who had experienced 10 or more complaints, with 97% incurring another complaint within a year. Regardless of the number of previous complaints, doctors’ risks of further complaints increased sharply in the first 6 months following a complaint, and then declined steadily thereafter. This is evident from the steep rise and then plateauing of the curves in figure 2A (these curves plot cumulative risks over time).
Probability of recurrent complaints over time. *Curves adjusted for doctor age and sex, practice location, specialty, state and complaint year. †Dots on the curves indicate points in time when actual complaints occurred (ie, x-axis), but have no meaning in relation to predicted probability of complaints (ie, y-axis). ‡Ages reported refer to mid-points of the period over which the doctor was followed.
The curves shown in figure 2A depict average population-level risks for selected predictors, controlling for other covariates. However, our modelling approach is fundamentally designed to predict risk at the practitioner level. Figure 2B illustrates this; it shows wide variation in risk profiles among a selection of seven doctors in the sample. Doctor A, for instance, is a 62-year-old male general practitioner who accumulated 10 complaints over 9.2 years of observation. He had a 39% risk of recurrence after his fourth complaint, a 61% risk after his fifth complaint and a 94% risk after his sixth complaint.
Sensitivity analysis
Re-estimating the main multivariable model using a subset of ‘severe’ complaints produced very similar results to the main model. The online supplementary appendix shows the full set of results.
Discussion
This study of patient complaints made to the chief health-quality regulators in Australia found that the complaints clustered heavily among a small group of doctors. Approximately 3% of practicing doctors accounted for half of all complaints. The number of prior complaints doctors had experienced was a particularly strong predictor of their short-term risk of further complaints. At the practitioner level, short-term risks of recurrence varied widely, from <10% risk among low-risk doctors to >80% risk among high-risk doctors. Overall, recurrent-event survival analysis showed considerable promise as a statistical approach for flagging complaint-prone doctors early in their complaints trajectory, using only a few simple descriptive characteristics.
Our study used a national sample to examine the distribution and predictors of medico-legal events. Patients treated in healthcare facilities throughout seven states and territories were eligible to file complaints with a Commission about the quality of the care they received. Previous studies of claims and complaints risk have tended to focus on pools of doctors covered by a single liability insurer or a few hospitals.
The extent to which complaints were concentrated in a small group of doctors was striking, consistent with other studies of complaints7 ,19 ,22 and claims.18 This highly skewed distribution of medico-legal events among doctors has several implications. The obvious one is that there is a pressing need for interventions that address the behaviour of doctors who are chronically complained or claimed against. Medical boards in Australia and elsewhere already address conduct, competence and health concerns with certain practitioners, but these efforts may fall short. Our study identifies a target population within which systematic deployment of interventions to improve performance35 ,36 might be manageable: less than 500 doctors accounted for 25% of all complaints that named doctors in the decade under study. Immediate steps to improve, guide or constrain the care being provided by these ‘high-risk’ practitioners could be a very cost-effective way to advance quality and safety, and produce measurable benefits at the system level.
A more sobering implication of the clustering phenomenon is that remediation activities targeted at doctors who have attracted many complaints, while critical, come too late. Complaints are best understood as sentinel events, and complainants as representatives of much larger groups of harmed or dissatisfied patients.37–39 By the time multiple complaints have accrued, substantial damage to quality of care is likely to have occurred already. The clustering of medico-legal events highlights the huge gains that would be put in reach by a capability to identify early doctors who are on course to incur multiple complaints.
Our approach is ripe for replication, not only by hospitals and regulators that hold complaints data, but within liability insurers with malpractice claims data, large hospital systems with risk management data, and medical boards and other professional bodies with data on disciplinary matters. Several distinctive aspects of our approach, descriptions of which follow, pave the way for better prediction of medico-legal risk in these settings than has been achieved to date.
Previous efforts to predict malpractice risk in liability insurance pools have included doctors with and without claims in their analyses.11 ,14 ,15 ,17 ,19 ,21 This approach suits a core goal in many of these studies: to explore the feasibility of ‘experience rating’ doctors’ liability insurance premiums.24 ,40 By contrast, our study sought to predict risk for purposes of targeting quality-improvement interventions. In this context, it is appropriate to focus on doctors who have been the subject of at least one complaint because this is the group with whom regulators have a natural point of contact and opportunities to intervene. An ancillary benefit of this ‘conditional’ approach to modelling medico-legal risk is that it enhances the ability to identify strong predictors of recurrent risk.
A key technical challenge encountered in previous studies has been how to deal with the recurrent nature of medico-legal events. The approach used by Rolph11 ,14 ,21 and others who have emulated his method,15 ,17 ,24 ‘fixes’ the effect of prior events in a single variable at the doctor level. The ‘weighted sum algorithm’ behind the PARS risk score, developed by Hickson and colleagues, comes from analyses regressing a sample of ‘risk management events’ on information obtained from unsolicited patient complaints.19 ,25 A limitation of both approaches is their static consideration of doctors' event histories. In its application, however, the PARS algorithm adopts dynamic features (doctors risk scores can be recalculated as new complaints appear over time).
An advantage of recurrent-event survival analysis is that it permits dynamic consideration of the effect of time-varying factors in the predictive model itself. In other words, it is not necessary to rely on a snapshot taken of a doctor's situation at a particular point in time: as risk profiles evolve—and the coefficients on the previous complaints variable in our study illustrate how dramatically this may occur—survival analysis incorporates these changes into the estimation of future risk. A related advantage of survival analysis is that it permits estimation of doctors’ risk levels at different points in time—a year after an index event, 2 years later and so on. Our analysis showed that for some predictors, particularly the number of previous complaints, doctors’ risks of additional complaints were non-linear: the risk tends to rise quickly over the several months after a complaint and then level off by the time the doctor reaches a year without further incidents. For clinical leaders, regulators and liability insurers trying to determine when in a doctor's trajectory of events to intervene to prevent recurrence, and how aggressively, this kind of temporal information may be very informative.
Our study has several limitations. First, the generalisability of our findings and method—to other types of medico-legal events, to other types of health practitioners, and outside Australia—is unknown, and should be tested. In other medico-legal settings, it may not be possible for practitioners to accrue the large numbers of events that some doctors in our sample did. Lower ceilings on the number of prior events may reduce the predictive value of this variable. Nonetheless, our analyses showed high risks of recurrence within 2 years (>60%) among doctors with as few as four complaints.
Second, the predictors we examined were doctor-focused. Other variables—including, patient characteristics,41–44 case-type and outcomes,39 ,45 doctors’ ethnicity and country of training,46 ,47 the practice setting, and aspects of the patient-doctor relationship48—may also predict complaint risk. However, because these variables are usually more difficult to measure at the population level, their suitability for large-scale predictive modelling is questionable. Moreover, given the high predictive values obtained with the simple doctor-level variables used in our analysis, the scope to boost predictive values with the addition of other variables is limited. Finally, we used head counts of practitioners, not more sophisticated measures of doctors’ exposure to complaint risk, such as volume of patients treated or procedures conducted.
During the rise of the quality and safety movement over the last 15 years, medico-legal institutions have been largely on the sidelines. They remain essentially reactive enterprises, with workloads that focus on dealing with the fallout from care that has gone wrong. Patient safety experts regard the medico-legal system's fixation with posthoc assessments of individual behaviour, rather than prevention and systems, as anachronistic.49 But as Rolph recognised 30 years ago,11 methods for accurately and reliably forecasting the medico-legal risk of clinicians have transformative potential because they could focus and drive prevention. Identifying and intervening early with doctors at high risk of attracting recurrent medico-legal events has considerable potential to reduce adverse events and patient dissatisfaction system-wide; it may also help those doctors avoid the vicissitudes of medico-legal processes.
Acknowledgments
We thank the health services commissioners and their staff in the Australian Capital Territory, New South Wales, the Northern Territory, Queensland, South Australia, Tasmania, Victoria and Western Australia; their support, assistance and advice made this study possible. Troyen Brennan, Atul Gawande, Michelle Mello and John Rolph provided helpful comments on earlier drafts of this manuscript.
References
Supplementary materials
Supplementary Data
This web only file has been produced by the BMJ Publishing Group from an electronic file supplied by the author(s) and has not been edited for content.
Files in this Data Supplement:
- Data supplement 1 - Online appendix
Press release
Press release
Files in this Data Supplement:
- Press release - Press release
Footnotes
-
Contributors MB, MS and DS developed the study idea, collected the data and conducted the analyses; MB and DS wrote the first draft of the manuscript; MW advised on design of the study, contributed expertise in interpretation and analysis of study data, and helped revise the draft manuscript; LG contributed to design and conduct of the statistical analysis and helped revise the draft manuscript; all authors reviewed and agreed on the submitted version of the manuscript. MB, MS and DS are guarantors for the study.
-
Funding This study was funded by an ARC Laureate Fellowship (FL110100102 to Dr Studdert) from the Australian Research Council. The research was conducted independently from the funder. The funder had no role in the study design, collection, analysis, and interpretation of data; writing of the report, or the decision to submit the article for publication.
-
Competing interests All authors have completed the Unified Competing Interest form and declare that: (1) MB, MS and DS have support from the Australian Research Council (Laureate Fellowship to DS); (2) none of the authors have had a financial relationships with any organisation that may have an interest in the submitted work in the previous 3 years; (3) none of the authors’ spouses, partners or children have any financial relationships that may be relevant to the submitted work and (4) none of the authors have any non-financial interests that may be relevant to the submitted work.
-
Ethics approval The study was approved by the Human Research Ethics Committee at the University of Melbourne
-
Provenance and peer review Not commissioned; externally peer reviewed.
Linked Articles
- Editorial
- Editorial
- Editorial
- Correspondence
- Correspondence