Article Text

Abstract
Background Proposed causes for increased mortality following weekend admission (the ‘weekend effect’) include poorer quality of care and sicker patients. The aim of this study was to analyse the 7 days post-admission time patterns of excess mortality following weekend admission to identify whether distinct patterns exist for patients depending upon the relative contribution of poorer quality of care (care effect) or a case selection bias for patients presenting on weekends (patient effect).
Methods Emergency department admissions to all 501 hospitals in New South Wales, Australia, between 2000 and 2007 were linked to the Death Registry and analysed. There were a total of 3 381 962 admissions for 539 122 patients and 64 789 deaths at 1 week after admission. We computed excess mortality risk curves for weekend over weekday admissions, adjusting for age, sex, comorbidity (Charlson index) and diagnostic group.
Results Weekends accounted for 27% of all admissions (917 257/3 381 962) and 28% of deaths (18 282/64 789). Sixteen of 430 diagnosis groups had a significantly increased risk of death following weekend admission. They accounted for 40% of all deaths, and demonstrated different temporal excess mortality risk patterns: early care effect (cardiac arrest); care effect washout (eg, pulmonary embolism); patient effect (eg, cancer admissions) and mixed (eg, stroke).
Conclusions The excess mortality patterns of the weekend effect vary widely for different diagnostic groups. Recognising these different patterns should help identify at-risk diagnoses where quality of care can be improved in order to minimise the excess mortality associated with weekend admission.
- Health Services Research
- Patient Safety
- Quality Measurement
This is an Open Access article distributed in accordance with the Creative Commons Attribution Non Commercial (CC BY-NC 3.0) license, which permits others to distribute, remix, adapt, build upon this work non-commercially, and license their derivative works on different terms, provided the original work is properly cited and the use is non-commercial. See: http://creativecommons.org/licenses/by-nc/3.0/
Statistics from Altmetric.com
Introduction
Many studies have demonstrated the existence of the weekend effect—a higher rate of death following weekend admission to hospital1–4—although not all agree it exists.5–8 Diagnosis-specific studies for stroke,9–12 acute kidney injury,13 pulmonary embolism (PE)14 and myocardial infarction15 all have shown a weekend effect (table 1).
Summary of some relevant studies providing evidence for the weekend effect
The causes of increased mortality associated with weekend admission are likely to be complex. Part of the effect is potentially a selection bias where the cohort of patients admitted on weekends has different characteristics (eg, sicker and older) compared with those admitted on weekdays.2 ,16 Variations in the reported size of the weekend effect may be due to how different analyses correct for any such selection bias. The weekend effect may also reflect lower quality of weekend clinical services—for example, lower staffing levels,17 ,18 the use of locum staff19 or unavailability of some tests or procedures.11 This may explain why services such as the emergency department (ED) or intensive care unit (ICU) in major hospitals appear relatively ‘protected’ from the weekend effect as many run a similar service across all days.7 ,8
The clinical impact of delaying a test or a procedure for a weekend admission until a weekday will vary with clinical service and patient condition, as would any impact of delayed or incorrect diagnosis or treatment. As such, death following weekend care may not occur immediately, and some of the heterogeneity in prior studies may reflect the window over which deaths are counted. While most weekend effect studies do not count deaths post-discharge, three studies that did found a significant increase in the risk of death at 7 days,9 30 days14 and 90 days10 post-discharge (table 1).
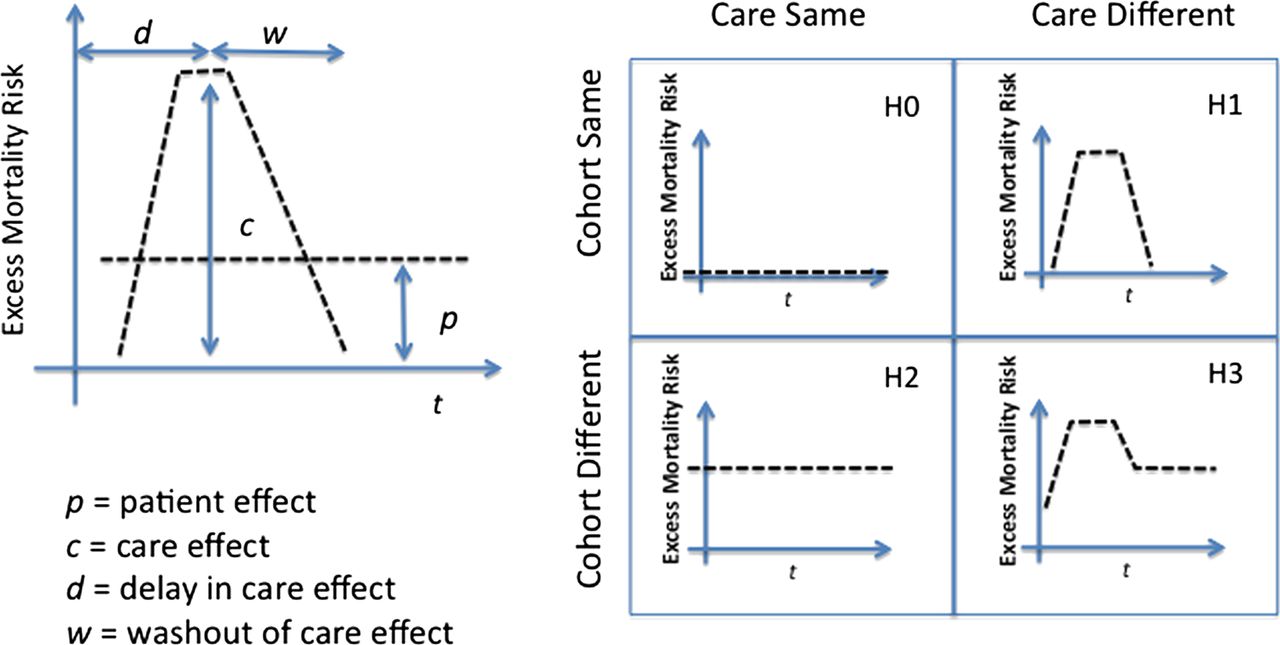
One approach to untangling the relative contribution of patient condition and quality of care is to study the temporal unfolding of the weekend effect on the risk of death per diagnostic group. There are essentially four basic temporal patterns that can be hypothesised from first principles (figure 1). If there is no difference between the cohorts admitted on weekdays and weekends and care is identical for both, then we should see no differences in deaths between the two (H0, figure 1). If the weekend cohort has an intrinsically higher probability of dying independent of the care they receive (patient effect), then its pattern of excess mortality should be steady over the short run and not reduce when re-exposed to weekday care (H2, figure 1). If the quality of weekend care is the cause of excess mortality (care effect), then a bump in death risk should diminish after re-exposure to weekday care (H1, figure 1). The care effect bump might vary in onset, size and duration. If weekend patients are both sicker and receive poorer care, we would expect a mixed picture with evidence of a temporally localised increase in mortality, settling to a level reflecting the differences in patient condition between both cohorts (H3, figure 1).

Excess mortality risk associated with weekend admission per diagnosis related group may exhibit different temporal patterns depending on whether the cause is sicker patients (patient effect: H2) or poorer care (care effect: H1).
In this study the impact of the weekend effect on mortality is examined to see if there are such variations in the 7 days post-admission patterns of risk between weekday and weekend admission patients and, if so, whether they can shed light on the complex association of excess mortality and the weekend admission to hospital.
Methods
All 3 798 599 admissions through the ED to all 501 public and private hospitals in New South Wales (NSW), Australia between 1 July 2000 and 30 June 2007 were extracted from the NSW Admitted Patient Data Collection. To capture post-discharge deaths, records were linked to the death registry by the NSW Centre for Health Record Linkage.20 Clinical information was coded using the International Classification of Diseases 10th revision Australian modification (ICD-10-AM) and Australian refined diagnosis related group (DRG) codes.21
Admission in this study refers to an episode of care that ends in discharge, transfer, death or change in care type. Records with an invalid or missing date of admission, date of death, principal diagnosis, DRG, patient age or sex were excluded. If a patient was hospitalised and readmitted within 1 week of discharge, only the last episode of care is taken into account. The resulting data contain 3 381 962 admissions and 64 789 deaths within 1 week from admission across 539 122 patients (average of 6.3 admissions per patient over 7 years). The Charlson comorbidity index was calculated for each admission using ICD-10-AM codes.22 ,23
Statistical analysis
To minimise selection bias, admissions were stratified by age, sex, Charlson comorbidity index and DRG. Thus variations in illness severity within a diagnostic and comorbidity group remained unadjusted, since they cannot be estimated from hospital administrative datasets.
A weekend was defined as the period between midnight Friday and midnight Sunday.3 ,11 Mortality rates in the week following admission were estimated by direct standardisation for both weekend and weekday admissions.12 ,24 Gamma methods were used for the CIs of the mortality rates.25 For each DRG, odd ratios (ORs) of death following weekend versus weekday admissions were computed using Mantel–Haenszel statistics.26 Survival curves and hazard ratios (HRs) were calculated for each DRG using Cox statistics.27 Excess mortality risk curves, e(t), were the result of subtracting the probabilities of dying, f(t), if admitted on weekend or weekday, e(t)=(fweekend(t) − fweekday(t)), at each day post-admission from admission to day 7 after admission, t=0…7.
Excess deaths for each DRG were calculated as the product of cumulative excess mortality risk and the corresponding number of weekend admissions for that DRG. This represents the number of deaths that could be avoided if there was no weekend effect.
A DRG was categorised as exhibiting a weekend effect if (1) its OR>1, HR>1 and 95% CI intervals were >1 and p values <0.01; (2) overall number of deaths >50; (3) cumulative excess mortality risk in the week post-admission ≥0.005 (5 extra deaths per 1000 weekend admissions). To test for difference in the shape of excess mortality risk curves, root mean square errors between curves were calculated.
In addition, Mantel–Haenszel statistics were calculated separately for in-hospital and post-discharge deaths. The latter only considered patients discharged within 1 week after admission. Statistical analyses were performed with the use of SAS V.9.0 and IBM-SPSS V.20 software.
Results
The mean age of patients was 49 years (median=52.4, percentile 25=26.8, percentile 75=74.6, SD=45.6) and the mean length of stay was 3.8 days (median=1.0, percentile 25=0.0, percentile 75=5.0, SD=8.3). Weekends accounted for 27.1% of all admissions (917 257/3 381 962) and these admissions were associated with 28.2% of all deaths (18 282/64 789). There were statistically significant differences in the characteristics of patients admitted on weekdays and weekends (table 2). After adjusting for these differences, the mortality rate for weekday admissions fell from 1.92% (46 507 deaths) to 1.85% (95% CI 1.85% to 1.85%) and for weekend admissions rose from 2.03% to 2.12%, (95% CI 2.12% to 2.12%) (difference 0.27%, p<0.001). The main drivers for adjustment were the greater age and comorbidity scores of patients admitted on weekdays.
Baseline characteristics of patients admitted on weekdays and weekend
After adjusting by age, sex and comorbidity index, no DRG (of a total of 430) was associated with a reduced risk of death following weekend admissions. Sixteen of the 430 DRGs demonstrated a weekend effect (table 3 and supplementary table S1 in online appendix). These 16 DRGs accounted for 39.7% (25 695/64 789) of all deaths, 40.1% (7325/18 282) of weekend deaths (21 excess deaths per 1000 admissions). Taken as a combined group, these 16 DRGs exhibited a mixed pattern (H3, figure 1 with delay d=0) consistent with both patient effect and weekend care contributing to excess mortality (supplementary figure S1 in online appendix).
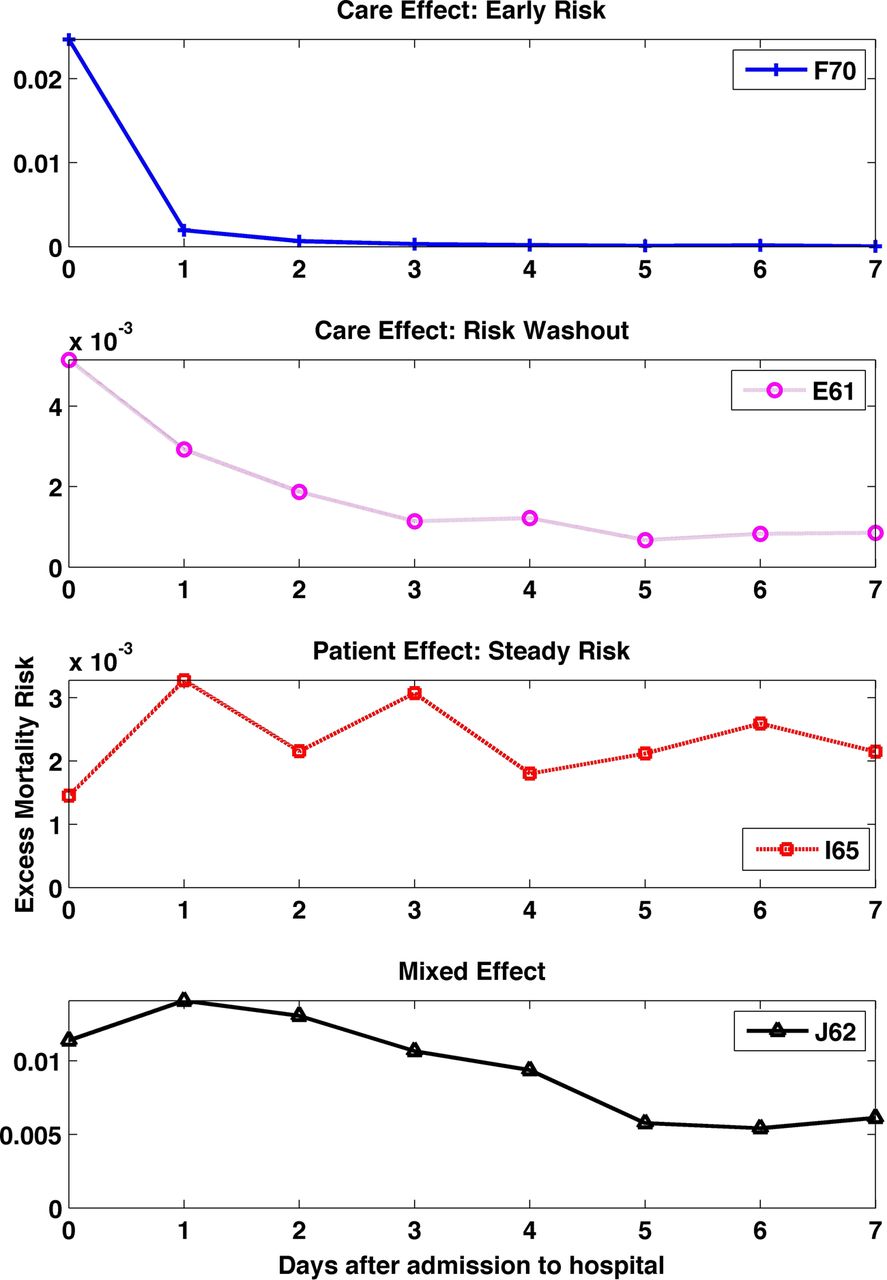
Analysis of individual excess mortality risk curves for these 16 DRGs revealed a variety of temporal patterns (figure 2 and supplementary figure S2 in online appendix):
-
Care effect (H1): Two patterns demonstrated a brief rise in mortality associated with weekend admission:
-
An early risk pattern in which the majority of excess deaths occurred within the first 24 h after admission. The only DRG in this category was F70 (Major Arrhythmia and Cardiac Arrest).
-
A risk washout pattern showed the greatest impact of weekend admission in the first 48 h, gradually reducing throughout the rest of the week. The three diagnoses in this category were E61 (Pulmonary Embolism), E64 (Pulmonary Oedema and Respiratory Failure) and F65 (Peripheral Vascular Disorders).
-
-
Patient effect (H2): With the steady risk pattern, the impact of weekend admission was distributed uniformly across the week after admission and appeared not to alter with re-exposure to weekday care. DRGs with this pattern were I65 (Connective Tissue Malignancy, including Pathological Fracture), R60 (Acute Leukemia) and R61 (Lymphoma and Non-Acute Leukaemia).
-
Mixed effect (H3): In this group a spike in mortality was associated with weekend admission and reduced on exposure to weekday care, but remained elevated after washout. DRGs in this group were B02 (Craniotomy), B67 (Degenerative Nervous System Disorders), B70 (Stroke and Other Cerebrovascular Disorders), E71 (Respiratory Neoplasms), F62 (Heart Failure and Shock), G60 (Malignancy), H61 (Malignancy of Hepatobiliary System, Pancreas), J62 (Malignant Breast Disorders) and L60 (Renal Failure).
Excess mortality risks curves for selected diagnosis related groups (DRGs). Excess mortality risk curves for selected DRGs consistent with care effect (top two panels), patient effect (panel 3) and mixed effect (bottom panel).
For some DRGs there were significantly higher numbers of post-discharge deaths following weekend admissions. For example, B02 (Craniotomy) had a post-discharge mortality rate of 5.0% for weekend admissions versus 2.7% for weekday admissions. However, after adjustment, no DRG had post-discharge only ORs with p values <0.01 (table 3).
DRGs at risk of weekend effect: number of weekday/weekend admissions and deaths, Odds Ratios (OR), Hazard Ratios (HR). OR are broke down into in-hospital and post-discharge ratios
Discussion
In this study, different diagnostic groups showed varying temporal patterns of excess mortality following weekend admission. Variations in patient illness, severity and comorbidity between weekday and weekend admissions are widely acknowledged confounders in studies of the weekend effect, often criticised for ascribing to clinical care what might be due to biology. As in other studies,9 ,10 ,14 the impact of weekend admission clearly extends beyond the hospital walls and lingers over time. Indeed, our data show that the effect of weekend admission on mortality has not saturated at 1 week after admission (figure 2 and supplementary figure S1 in online appendix), so it is very likely that additional deaths occur well beyond that window.
Only 16 of 430 DRGs had a significant increased risk of death following weekend admission. Within each DRG, the probability of the weekend effect being a false positive (independently of any other DRG) is less than 1%. The probability that the weekend effect is a false positive in at least one of the 16 DRGs is p=1−(1 − p)16=15%.
These 16 DRGs displayed all of the variations in the 7-day post-admission temporal pattern hypothesised from first principles. The early risk pattern, where most of the risk of death is within the first 24 h of admission, was associated with cardiac arrest and arrhythmia. Others have also demonstrated weekend admission effects for patients with myocardial infarction.15 Failure to provide immediate care to manage these conditions can have an immediate and fatal outcome, probably explaining the pattern. Although some disagree,2 patients in this category are as likely to be admitted to hospital on any day of the week, so the weekend effect most probably is due to variation in care—for example, unavailability of specialist staff, imaging or stenting services. While our population includes some centres of excellence in cardiac care that offer services across the weekend, it also includes smaller and rural hospitals where access is diminished on weekends.
In the risk washout pattern, the effect of weekend admission clearly dominates the first 48 h, but gradually ‘washes out’ of the system over time, and was associated with DRGs for pulmonary embolism, pulmonary oedema and peripheral vascular disorders. These are also acute events requiring access to high quality immediate care, but with a less abrupt risk of immediate mortality. One reading of this pattern is that those who survive the first 48 h fare better when re-exposed to weekday care.
Cancer patients dominated the steady risk pattern, with a similar mortality risk across the week after admission. In common with other weekend effect studies that rely on population level administrative data, we were unable to distinguish illness severity within a DRG and comorbidity group. It is therefore possible that cancer patients with more severe illness were indeed admitted on the weekend—for example, when community care could no longer manage them. If so, this may explain the pattern seen here, where the risk of death did not change when patients admitted at the weekend were re-exposed to weekday care.
Finally, a group of DRGs exhibited a mixed effect pattern expected when both quality of care and patient effect contribute to excess mortality. This pattern was associated with a mixture of diagnoses such as stroke, nervous system disorders and some cancers. This was also the pattern shown by the group of 16 DRGs taken as a whole.
If a patient was readmitted within one week of discharge, only the last episode of care was taken into account in our analysis. The rationale for this was that the last admission is the one where death might occur or is closest in time to death. To test for distortions introduced by this choice, we repeated our analysis but based it on DRGs associated with the first admission in a sequence. The results of this analysis were nearly identical to the original analysis, with only B67 (Degenerative Nervous System Disorders) no longer exhibiting a weekend effect (p=0.02). The four patterns of excess mortality risk curves remained the same, with no new patterns or new DRGs emerging with a weekend effect. Admission to the ICU during the hospital stay can be used to help identify patients who are critically ill. In this study, treating ICU admission as a confounder gave similar results for all patterns with B67 again dropping out of the weekend effect group (p=0.03).
While we defined a weekend as the period between midnight Friday and midnight Sunday, any time outside 08:00 h and 18:00 h Monday to Friday might be considered not part of ‘normal’ operating hours and also contribute to deviations in observed mortality. Furthermore, the observed increase in mortality was not homogeneous across these non-core operating times. In particular, adjusted mortality for our 16 selected DRGs was highest for admissions between midnight Friday and midnight Saturday and lowest for admissions between midnight Monday and midnight Tuesday.
Limitations of the study
The associations between weekend admissions and increased mortality reported here do not establish causality but do fit the hypothesised patterns expected with different causal pathways. There are well-known challenges in the clinical interpretation of administrative data, and this challenge is shared by most other studies of the weekend effect.28 For example, in common with most previous literature, severity of illness within a diagnostic and comorbidity group, time and date of procedures and staffing information were not available in this study. Our results are also limited by the quality and methods of DRG coding which emphasise the principal diagnosis for admission and may miss critical comorbidities. For example, a cancer patient admitted for an infection may be coded using an ‘infection’ instead of a cancer DRG. Therefore, when analysing admissions for cancer patients, we only compared admissions where the primary reason for hospitalisation was cancer.
Future work
The existence, cause and magnitude of the weekend effect have been discussed in the literature for the last 30 years. Given that different patient groups now appear to have widely varying patterns of risk associated with weekend admission, finer-grained studies using clinical datasets are urgently needed, especially to better model severity and comorbidity and its influence on mortality. However, the very large sample size required for this study would not be currently possible with fine-grained clinical data. As large clinical datasets become available, however, finer analyses should be possible. We should be able, for example, to distinguish between rural and metropolitan hospitals and to test for the impact of reduced specialist services and ICU availability in some rural organisations. Also, differences in patients presenting to EDs and hospitals may partly reflect the services and support available to these patients in the community. Future work should include the effect of these services. Finally, unpacking the relationship between the levels of service provided on weekdays and weekends, controlling for any selection bias in weekend presentations, will help us better understand the risks associated with different staffing and service models.
Conclusion
The weekend effect is not a uniform phenomenon but, rather, a complex cluster of different causal pathways, shaping patients with very different diseases presenting at very different clinical services. Not every diagnostic group demonstrates a weekend effect, and those that do are associated with quite different risk profiles, suggestive of different causal pathways. Recognising how these different patterns shape the impact of weekend admissions should lead to more diagnosis- and service-specific analyses and solutions.
References
Supplementary materials
Supplementary Data
This web only file has been produced by the BMJ Publishing Group from an electronic file supplied by the author(s) and has not been edited for content.
Files in this Data Supplement:
- Data supplement 1 - Online supplement
- Data supplement 2 - Online table
Footnotes
-
Contributors OPC and BG: contributed to conception and design, analysis and interpretation of the data and results, drafting and writing the article, revising it critically for important intellectual content and final approval of the version to be published. KH and GPD: contributed to interpretation of the data and revising the paper critically for important intellectual and content. EC: contributed to supervision of the paper, developed hypotheses, analysis and interpretation of the data and results, as well as drafting and writing the article, revising it critically for important intellectual content and final approval of the version to be published.
-
Funding This work was funded by National Health and Medical Research Council (NHMRC) Program grant 568612.
-
Competing interests None.
-
Ethics approval Ethics approval was obtained from the NSW Population and Health Services Research Ethics Committee and the UNSW Human Research Ethics Committee.
-
Provenance and peer review Not commissioned; externally peer reviewed.