Article Text

Abstract
Background Central line associated pneumothorax (CLAP) could be a good quality of care indicator because they are objectively measured, clearly undesirable and possibly avoidable. We measured the incidence and trends of CLAP using radiograph report text search with manual review and compared them with measures using routinely collected health administrative data.
Methods For each hospitalisation to a tertiary care teaching hospital between 2002 and 2015, we searched all chest radiography reports for a central line with a sensitive computer algorithm. Screen positive reports were manually reviewed to confirm central lines. The index and subsequent chest radiography reports were screened for pneumothorax followed by manual confirmation. Diagnostic and procedural codes were used to identify CLAP in administrative data.
Results In 685 044 hospitalisations, 10 819 underwent central line insertion (1.6%) with CLAP occurring 181 times (1.7%). CLAP risk did not change over time. Codes for CLAP were inaccurate (sensitivity 13.8%, positive predictive value 6.6%). However, overall code-based CLAP risk (1.8%) was almost identical to actual values possibly because patient strata with inflated CLAP risk were balanced by more common strata having underestimated CLAP risk. Code-based methods inflated central line incidence 2.2 times and erroneously concluded that CLAP risk decreased significantly over time.
Conclusions Using valid methods, CLAP incidence was similar to those in the literature but has not changed over time. Although administrative database codes for CLAP were very inaccurate, they generated CLAP risks very similar to actual values because of offsetting errors. In contrast to those from radiograph report text search with manual review, CLAP trends decreased significantly using administrative data. Hospital CLAP risk should not be measured using administrative data.
- adverse events, epidemiology and detection
- hospital medicine
- medical error, measurement/epidemiology
Statistics from Altmetric.com
Background
Actively monitoring quality of care within a healthcare organisation is a laudable activity but it is difficult to do efficiently and accurately. Efficiency can be achieved by using previously collected data such as those stored within administrative data sets or hospital data warehouses (ie, routinely collected clinical data). However, accurately measuring quality of care can be difficult to achieve with such data because they may not capture many clinically relevant outcomes that one would need to measure quality of care. In addition, the frequency of exceptions and subtleties in clinical medicine can make it difficult to accurately evaluate the quality of care in specific conditions using routinely collected data. These observations limit the number of conditions or processes whose quality can be actively monitored using routinely collected data.
We believe that a good candidate for a hospital quality of care indicator is the central line associated pneumothorax (CLAP) rate. Central line insertion is a common procedure for hospitalised patients. CLAP is an outcome that patients and physicians would obviously like to avoid. Interventions exist—such as the use of bedside ultrasound1 2—that could decrease CLAP risk and improve patient outcomes. Many cohort studies have measured CLAP risk (table 1), providing a reliable reference standard to which a particular hospital’s CLAP rates could be compared. Finally, both the intervention (central line insertion) and the outcome (pneumothorax) are very objective. As such, one might expect them to be completely and accurately identifiable using routinely collected health administrative data.
Summary of cohort studies measuring the risk of pneumothorax following central line insertion
This study measured the incidence and trends of CLAP using textual analysis of radiological reports followed by manual review. We then compared these results with those that would have been generated using diagnostic and procedural codes from health administrative data which are available to most hospitals.
Methods
Study setting and cohort
The Ottawa Hospital (TOH) is an approximately 1000 bed tertiary care teaching hospital with three campuses. The study sampling frame included all patients admitted to any of the three TOH campuses between 1 January 2002 and 31 December 2015. This excluded patients coming to the hospital for same-day surgery and patients observed for a protracted period in the emergency department.
Identifying central lines
Central lines were identified by applying a text search algorithm to the reports of plain chest radiographs of inpatients. This algorithm had been previously derived at our hospital in a simple random sample of 4986 chest X-ray reports, of which 822 (16.4%) cited a central line (online supplementary appendix A). The algorithm’s sensitivity and specificity were both 98.8% with a positive and negative predictive value of 94.5% and 99.7%, respectively.
Supplementary file 1
This algorithm was applied to all chest radiography reports for all patients in the study sampling frame. A simple random sample of 25 000 chest X-ray reports which met criteria for this algorithm (ie, were ‘screen-positive for a central line’) was selected. We considered this number to be a manageable amount for manual review while ensuring adequate statistical power to analyse for CLAP trends over time. These randomly selected radiology reports were manually reviewed by MR to confirm the presence of a central line. Central lines were deemed present if the chest radiograph report cited the presence of a central venous catheter, central venous line, central venous pressure line, internal jugular line, subclavian line, haemodialysis catheter, CordisR, HickmanR catheter, ‘port-a-cath’, pulmonary artery catheter or Swan-GanzR catheter. We did not include central lines inserted via the femoral vein, umbilical vein and other peripherally inserted catheters (ie, peripherally inserted central catheter lines) because their insertion would not cause a pneumothorax. This manual review was facilitated by presenting all keywords of the central line text search algorithm (online supplementary appendix A) in upper case font.
From the reviewed reports, we identified the earliest central line within a particular hospitalisation. We excluded central lines that were identified on the first chest X-ray of a particular hospitalisation since we could not, in these cases, be sure that the central line was placed during the admission (ie, it might had been inserted before admission, in which case CLAP detection would be nil).
Identifying CLAPs and chest tubes
We screened for CLAP by applying a text search algorithm to the chest X-ray report citing the index central line as well as all subsequent chest X-rays conducted within the next 72 hours. This 72 hours’ horizon was chosen since we reasoned that pneumothoraxes arising after this period would be very unlikely to have been caused by the central line insertion. The pneumothorax text search algorithm that we used (online supplementary appendix B) had been derived on 4994 randomly selected chest X-ray reports (pneumothorax prevalence 2.9%) and had a sensitivity of 95.3%, a specificity of 99.6%, a positive predictive value of 89.4% and a negative predictive value of 99.9%. All screen-positive reports were manually reviewed by CvW to confirm the presence of a pneumothorax. CLAP was deemed to be present if a pneumothorax was identified within 72 hours of the X-ray report on which the central line had been identified. We did not consider pneumothorax laterality (relative to that of the central line) to determine CLAP because: not all reports identifying central lines indicated its laterality; and pneumothorax on the opposite side of an inserted central line might have occurred because of an unsuccessful central line insertion attempt which occurred prior to the identified central line contralateral to the pneumothorax. We did not count cases in which a pneumothorax had been identified prior to the central line insertion.
A third text search algorithm was used to screen for chest tube insertions following the diagnosis of CLAP. The chest tube text search algorithm (online supplementary appendix C) had been derived on 4992 randomly selected chest X-ray reports (chest tube prevalence 7.1%) and had a sensitivity of 97.2%, a specificity of 99.4%, a positive predictive value of 92.9% and a negative predictive value of 99.8%. All reports following the diagnosis of CLAP that was screen positive for a chest tube were manually reviewed by CvW to confirm their presence. We counted all chest tubes that were inserted after the diagnosis of CLAP.
Identifying CLAP using administrative data
Online supplementary appendix D lists the diagnostic and procedural codes that we used to identify CLAP using administrative data. These codes were identified by searching code dictionaries from the Canadian Institute for Health Information for the appropriate search terms (eg, ‘central line’, ‘pneumothorax’, ‘chest tube’, ‘pigtail’, and so on) and reviewing coding criteria and exclusions to determine the most appropriate codes. Canadian Classification of Intervention codes in online supplementary appendix D.1 were used to identify all hospitalisations having a central line insertion. CLAP was counted if these hospitalisations were also coded with pneumothorax diagnostic code (online supplementary appendix D.2). Finally, hospitalisations coded with CLAP that were also coded with a chest tube (online supplementary appendix D.3) were classified with CLAP requiring chest tube treatment (as long as the date of the chest tube insertion was the same or followed that of the central line insertion).
Analysis
We measured CLAP risk as the proportion of central lines having a pneumothorax within 72 hours. We used fractional polynomials in a logistic regression model to determine the association of CLAP risk with insertion year using a macro from Sauerbrei et al.3 The p value of the year covariable was used to determine whether a significant trend was present or not. To gauge CLAP severity, we also measured the proportion of CLAPs requiring chest tube treatment.
The accuracy of administrative database codes for central line insertion, CLAP, and CLAP requiring chest tube insertion (online supplementary appendix D) was measured. When measuring central line insertion accuracy, ‘true positives’ were defined as above (n=10 819; figure 1, white box). ‘True negatives’ included three patient groups: (1) hospitalisations without a chest X-ray (n=441 205, figure 1) since chest radiography following central line insertion is the standard of care; (2) hospitalisations whose chest X-ray report(s) screen found no central line (n=227 382, figure 1) since our text search algorithm for central lines (online supplementary appendix A) had a false negative risk of only 0.3%; and (3) hospitalisations whose manual radiology report review excluded central line (n=5638, figure 1). ‘True negative’ hospitalisations are indicated in figure 1 in dark grey boxes. All analyses were done with SAS V.9.4.

CL, central line; CXR, chest X-ray.
Results
Of the 721 063 admissions during the study period, 279 858 (38.8%) had at least one chest radiograph (figure 1). There were a total of 873 120 chest radiographs performed in these admissions (average of 3.0 chest radiographs per admission). From these radiograph reports, 163 153 (18.6%) were identified by our text search algorithm (online supplementary appendix A) as potentially citing a central line. Of these chest radiographs, 25 000 were randomly selected for manual review (8.9% of all chest radiographs, 15.3% of screen positives). About 20 784 of these chest X-rays (84.9% of screen-positive reports) truly cited a central line. These chest X-rays had been conducted in 11 257 hospitalisations; in 10 819 of these, the central line was inserted during the hospitalisation. Central line insertion incidence was 1.6% of hospitalisations.
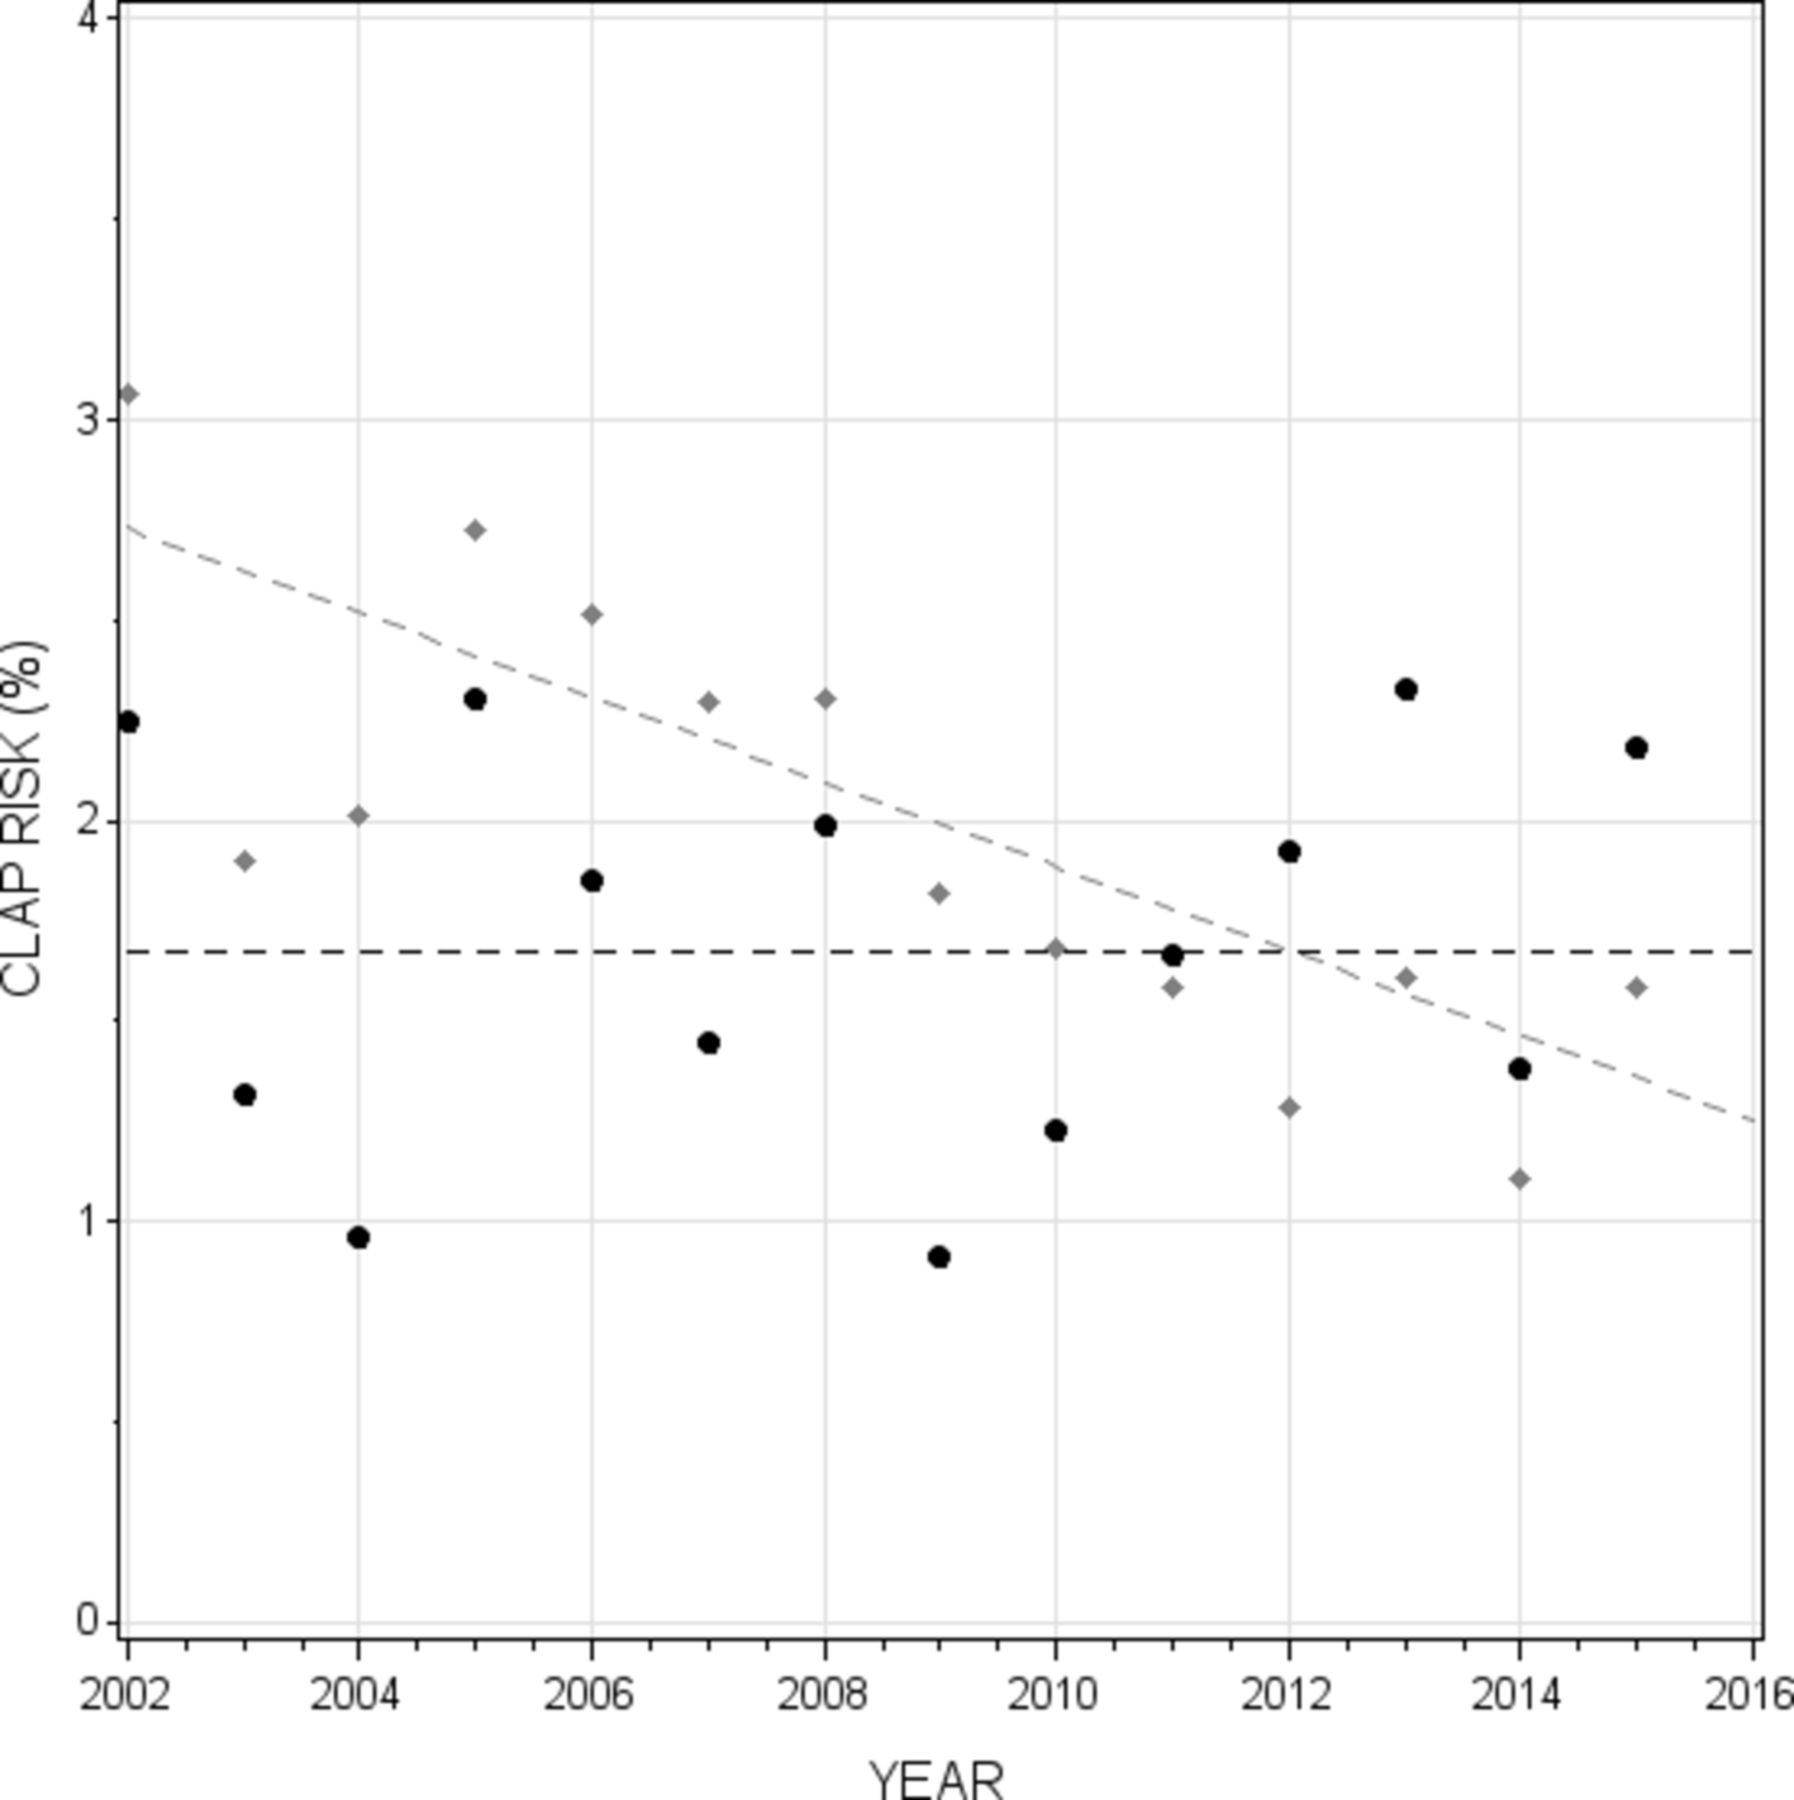
Of 10 819 hospitalisations with a central line insertion, 181 (1.7%; 95% CI 1.4% to 1.9%) were complicated by CLAP. Of the 181 hospitalisations with CLAP, 14 patients underwent subsequent chest tube insertion (7.7% of CLAPs, 0.13% of all central line insertions). Logistic regression analysis found no significant change in CLAP risk over time (figure 2, black line).

CLAP, central line associated pneumothorax.
Administrative database codes inaccurately captured central lines and their complications (table 2). Codes identified only 4591 of 10 819 central lines (sensitivity 42.4%) with a positive predictive value of 16.4% (table 2A). Administrative database codes also inaccurately captured CLAP, identifying only 25 of 181 cases of CLAP (sensitivity 13.8%) with a positive predictive value of 6.6% (table 2B). Finally, database codes missed most chest tube placements for the treatment of CLAP (sensitivity 21.4%) and had a positive predictive value of 0.4% (table 2C).
Accuracy of administrative database codes for central line, CLAP, and CLAP requiring chest tube
Despite these extensively inaccurate codes, however, CLAP risks measured using administrative database codes were surprisingly similar to true values (table 3). In 721 063 hospitalisations, 36 760 were coded with central line placement; this is a central line incidence of 5.1% which is 225% higher than the true incidence of 1.6% of hospitalisations. CLAP was coded in 680 of these hospitalisations, for a code-based CLAP risk of 1.8% (table 3). This is only 5.9% higher than the true CLAP risk of 1.7%.
CLAP risk using diagnostic and procedural codes in health administrative data
Despite administrative database codes being very inaccurate for central line and CLAP (table 2), administrative database CLAP risk was very similar to true CLAP risk because of a fortuitous balance of the prevalence of particular hospitalisation strata and their CLAP risk (table 3). Hospitalisations in which central lines had truly been inserted (accounting for 12.5% of coded central lines) had a code-based CLAP risk of 4.0% (table 3A). Hospitalisations with an unknown central line status (accounting for 24.0% of coded central lines) had a code-based CLAP risk of 3.4% (table 3B). Finally, hospitalisations without central lines (accounting for 63.5% of coded central lines) had a code-based CLAP risk of 0.8% (table 3C). Summing the weighted CLAP risks (table 3, column F) returned the overall code-based CLAP risk of 1.8% (ie, 0.005+0.008+0.005=0.018).
We found notable differences between true and code-based CLAP risks over time. In contrast to the unchanging true CLAP risk over time (figure 2, black line), code-based CLAP risk decreased significantly and linearly (figure 2, grey line). Logistic regression found that code-based CLAP risk decreased significantly by 5.6% per year (OR 0.944, 95% CI 0.926 to 0.964).
Discussion
We used a unique combination of textual analysis and manual report review to create a very large cohort of central line hospitalisations for which pneumothorax status was determined. We measured a CLAP risk of 1.7% with no significant change over time. Administrative database codes inaccurately identified central lines and CLAP. Despite this, code-based CLAP risk (1.8%) was very similar to true values (1.7%) because patient strata with inflated CLAP risk were balanced by more common strata with underestimated CLAP risk. These results show that CLAP risk should not be measured using administrative database codes.
We believe that our study makes several important points. First, we believe that this study highlights the power of combining text analysis and manual report review for quality of care and health research. These methods let us create a cohort of CLAPs (n=181) that, by our review of the literature, exceeds all previous cohorts combined (table 1). Large case numbers increase the accuracy of risk estimates, the reliability of associative analyses, and make risk estimates of rare events possible. For example, our estimated risk of CLAP requiring chest tube treatment of 0.13% is—to our knowledge—the first time this statistic has been accurately measured in a single cohort. We hope that that the use of textual analysis in health research will increase in prevalence with the expansion of hospital data warehouses having extensive collections of text. In particular, we believe that text search processes like those used in this study can be applied to create other innovative quality of care measures. Second, we were very surprised how database codes that were seemingly so inaccurate (table 2) could generate a CLAP risk that was so similar to true values. This result was explained by exaggerated CLAP risks in hospitalisations making up a minority of code-based central lines (ie, table 3A—patients truly having central line insertion) offset by very low CLAP risks in hospitalisations making up the majority of code-based central lines (ie, table 3C—patients without a central line). By chance, the prevalence and CLAP risk in these groups was such that the true CLAP risk was closely estimated. We found this fortuitous balance of bias very surprising. These results highlight the weakness of measuring the accuracy of administrative database codes by comparing summary statistics using database codes with those using accurate methods. We believe that these results highlight the importance of using text analysis to measure hospital quality of care. Third, our text search methods (online supplementary appendices A–C) were very accurate and this study illustrates how these relatively simple rule-based algorithms permit the analysis of text with routinely available statistical software (we used SAS V.9.4). Finally, our hospital’s CLAP risk (1.7%) is approximately a half a per cent higher than that from the literature (table 1). We were somewhat surprised that this risk did not decrease over time since it was our belief that the use of point-of-care ultrasound during central line placement increased during this time and this technology has been associated with decreased procedural risks.1 2 4 A closer examination of primary data will be required to identify methods to decrease CLAP risk at our hospital.
There are several issues that must be kept in mind when interpreting our results. First, we did not include patients who had undergone central line placement as an outpatient since the documentation for these patients (required for the collection of study covariates and patient outcomes) was not as complete as that for inpatients. Therefore, our results apply only to central lines that are inserted while patients were admitted to the hospital. Second, we only counted central lines that were captured by plain chest radiography and actually cited on the radiologist’s report. Our study would miss central line insertions that were not followed by chest radiography. We believe that the prevalence of such missed central lines would be very small and do not know if or how this would have biased our estimates regarding CLAP risk. Our study would also miss pneumothoraxes following failed central line insertion. Our study would also have missed CLAPs because a central line actually cited in a chest radiography report was missed by our algorithm. This bias would likely have negligible influence on our results since we estimate that it would most likely have resulted in three missed CLAPs (online supplementary appendix E). Third, we only tested one code algorithm (online supplementary appendix D). Since, to our knowledge, no previous code algorithm for CLAP (with or without chest tube) has been published for Canadian administrative data, we used standard methods of closely reviewing code dictionaries to identify all codes relevant to the identification of CLAP (online supplementary appendix D). We believe that our code algorithm is valid and complete but it is possible that our results might change if different code algorithms were used but are uncertain if such changes would materially change our study’s conclusions. Fourth, we do not know why disparate results in the analysis of CLAP trends over time occurred when using the text search algorithm versus CLAPs identified with administrative data (figure 2). This will require further analysis of reasons for miscoding of central lines and CLAPs. Finally, CLAPs would be missed in our study if patients did not undergo chest radiography during the 72 hours following radiography noting the incident central line. However, it would be unusual for clinicians to not order chest radiography in patients having chest symptoms who had recently undergone central line placement.
In summary, administrative database codes for central lines and CLAP were very inaccurate. Despite this, hospital-wide CLAP risk based on these codes was very similar to true values due to fortuitous offsetting errors. Hospitals should not use administrative database codes to measure CLAP risk. This study highlights the worthlessness of using ecological methods to measure administrative database codes accuracy.
References
Footnotes
Contributors MR, AF and CvW each contributed to the study’s conception, data collection, analysis and drafting of the final report.
Funding The authors have not declared a specific grant for this research from any funding agency in the public, commercial or not-for-profit sectors.
Competing interests None declared.
Patient consent Not required.
Ethics approval The study was approved by our local research ethics board.
Provenance and peer review Not commissioned; externally peer reviewed.