Article Text

Abstract
Background Adverse drug events (ADEs) pose a heavy burden on health systems worldwide. The assessment of risk tool (ART) was developed to help prioritise hospitalised patients for interventions such as medication reconciliation (MR) and review, and to reduce potential ADEs from unintentional medication discrepancies and prescribing errors.
Aim To validate ART, and to determine which of the selected 25 flags were significantly associated with risk of unintentional medication discrepancies and prescribing errors.
Method This was a prospective observational study of 247 admissions to two medical teams in a New Zealand hospital. Study pharmacists undertook MR and review for all eligible admissions over 5 months. A Kruskal–Wallis test was used to determine differences in numbers of unintentional medication discrepancies and prescribing errors, followed by generalised linear modelling, to find the estimated ratio of the mean number of unintentional medication discrepancies between the three ART groups. In part 2 of the study, using multivariable logistic regression, combinations of flags significantly associated with risk were identified.
Results Significant differences in the number of unintentional medication discrepancieswere found between the ART risk groups (p<0.0001, Kruskal–Wallis test). Patients in the high-risk group had a significantly greater number of unintentional medication discrepancies than those in the medium- and low-risk groups. There were no significant differences in prescribing errors between the ART risk groups (p=0.08, Kruskal–Wallis test). Flags significantly associated with risk, included ‘more than eight admission medications’, OR=3.7 (95% CI 2.2 to 6.4) and ‘readmission within 30 days’, OR=6.8 (95% CI 3.0 to 15.2), p<0.0001.
Conclusion ART was effective for prioritising patients for interventions such as MR.
- patient prioritisation
- risk assessment
- medication reconciliation
- adverse drug events
- prescribing errors
- unintentional medication discrepancies
- clinical pharmacy
- medication safety
- risk prediction
- predictive risk score
- drug related problems
Statistics from Altmetric.com
- patient prioritisation
- risk assessment
- medication reconciliation
- adverse drug events
- prescribing errors
- unintentional medication discrepancies
- clinical pharmacy
- medication safety
- risk prediction
- predictive risk score
- drug related problems
Introduction
Harm from medicine use is a substantial, costly and at times a devastating problem facing health systems.1 Adverse drug events (ADEs), including adverse drug reactions (ADRs) and harm from medication errors, are among the largest category of adverse events affecting hospitalised patients worldwide.2 In the United Kingdom and Europe approximately 7% of hospital admissions are affected by ADRs.3 A 2002 systematic review of ADRs in hospitalised patients estimated that four out of 100 patient bed-days were as a result of ADRs, costing the NHS £380 million a year.3 More recently in the UK, preventable adverse events, including ADEs, were estimated to cost the NHS in excess of £1 billion each year.4 The burden of ADEs is not unique to the UK but a global problem. In the USA, an estimated 6.5% of hospitalised patients experience an ADE, with an almost twofold increased risk of death.1 2 5 In New Zealand hospitals, medication errors were among the top three categories of preventable adverse events, and studies have reported ADE rates ranging from 13% to 30% for hospital inpatients.6–9
A number of ADE-related risk factors, including polypharmacy, high-risk medicines, older age, impaired renal function and polymorbidity, have been identified, and may be used to prioritise patients at high risk of medication harm for targeted interventions.10–14 Interventions such as medication reconciliation (MR) reduce unintentional medication discrepancies that can lead to ADEs, and are advocated by organisations such as the Joint Commission and National Institute for Health and Care Excellence (NICE).15–19 Other interventions that reduce ADEs include pharmacist review of patient’s medications and discharge coordination.20 Although such interventions should be undertaken for all patients, this is not always feasible, mainly owing to resource limitations. Patient prioritisation has been advocated as a way to provide early targeted pharmacist interventions for high-risk patients. However, the methodology to achieve this is generally left to organisational policy and/or clinical expertise.21 22
In 2011, the Middlemore Hospital pharmacy department (Auckland, NZ), developed the assessment of risk tool (ART)—software to prioritise inpatients for ADE prevention strategies such as MR and pharmacist review.23 ART flags were derived by literature review to identify important risk factors for ADEs, followed by meetings between Middlemore Hospital’s senior clinical pharmacists and the Quality Improvement Unit (which comprised pharmacists, nurses and doctors) until consensus was reached on the final 38 flags and scores (see online supplementary appendix 1). After this initial development phase a 1-day meeting was also held, attended by an expert panel of senior and specialist pharmacists from across NZ, where a modified Delphi technique was used to discuss flag definitions and rank the flags in order of importance, through anonymised voting.
Each flag was assigned a score between 1 and 10, which when summed provided the patient with a total ART score. Patients were prioritised as low (≤10), medium (11–21) or high (≥22) risk. The ART extracted information for flags from the hospital’s electronic systems, updating three times daily (at 0600, 1000 and 1400 hours), for a close as possible ‘real-time’ picture of risk. ART could be accessed from any hospital computer and pharmacists checked patient ART scores after each update. Further details on the development of the ART can be found in an earlier publication.24
In 2012, after implementation in clinical practice, validation of selected ART flags was undertaken. At the time of the study, 25 of the proposed 38 ART flags (see online supplementary appendix 1) were active and included in this study. The 13 laboratory flags were excluded from this study as there were technical problems with extracting laboratory test results.
Aim
To validate the ART and to determine which of the selected 25 flags were significantly associated with risk of unintentional medication discrepancies and prescribing errors.
Method
This study was a prospective observational study where two pharmacists, who were blinded to ART (study pharmacists were newly employed by the hospital for the purpose of the study and had never used the ART and were not provided with any information about the tool or user log-in codes to access the tool, at any point during the study), provided clinical pharmacy services to all patients admitted by the team to which they were assigned. Interventions were recorded electronically by the study pharmacists and retrospectively analysed (by a senior clinical pharmacist independent of the MR process) to determine the association between a patient’s ART score and number of unintentional medication discrepancies (identified through MR at admission) and other prescribing errors (identified by daily chart review). Unintentional medication discrepancies and prescribing errors were used as proxy measures for ADEs as our tool was primarily used for prioritising patients for MR and medication review. We also felt this would be appropriate given that medication errors are preventable and often the target of harm reduction strategies.
Unintentional medication discrepancies were defined as any discrepancy between the patient’s original preadmission medication list and the medicines prescribed on the admission chart, where the prescriber was unaware a discrepancy had occurred. Other prescribing errors were defined as any prescribing of medicines, after the patient’s usual admission medications had been charted, which were inappropriate for the patient (according to hospital policies and guidelines including STOPP/START criteria),24 or where a transcription or duplication error(s) had occurred. The severity (grade) of unintentional medication discrepancies and prescribing errors were assessed by the study pharmacist and reviewed by a senior clinical pharmacist. Severity was graded with respect to an error or discrepancy’s potential to cause harm if left unresolved, using the NZ Electronic Pharmacist Interventions for Adverse Events NationallY (EPIFANY) definitions. EPIFANY is a national database for recording and grading pharmacist interventions (see online supplementary appendix 3). The clinical pharmacy services provided by the study pharmacists included MR (for all study patients within 24 hours of admission), medication chart review (for all study patients each day until discharge) and patient education and discharge coordination (owing to resource constraints this was done only as needed without a formalised MR process). Clinical pharmacy services were delivered between the hours of 0800 to 1630 Monday to Friday. All study participants were reviewed daily and followed up to discharge.
The study pharmacists had a similar level of experience (1–2 years post-registration). They were trained and validated to undertake MR using a systematic process, according to the Middlemore Hospital pharmacy department procedures. This included electronic documentation of MR using the electronic medication reconciliation templates (Orion Health) within the hospital’s patient management system (Concerto). At least two sources of information were used to obtain the best possible medication history as part of MR. One primary source, such as the patient or care-giver (in a face to face interview), and at least one secondary source, such as the community pharmacy or the patient’s general practitioner, were contacted to ensure a comprehensive history of all prescribed and non-prescr ibed medications, allergies and adverse drug events. The NZ National Medical Warnings database was also reviewed as part of the MR process to ensure any prior ADRs were accurately documented. A copy of the Middlemore Hospital electronic MR template, used to document medication history, is included in online supplementary appendix 2.
Inclusion criteria
The study population included all adult inpatients, consecutively admitted to the cardiology team and one general medical team (during weekdays), between September to November 2012 and January to February 2013. The data collection for the study wae split into two parts owing to the availability of study pharmacists and each pharmacist was responsible for a separate study period. Teams were chosen based on the pharmacy department’s service requirements.
Ethical approval
This study was approved by the Middlemore Hospital Research Office. Through online assessment of NZ Health and Disabilities Commission ethics committee, it was decided that as the study was observational and did not have direct intervention on patients, ethical approval was not required.
Outcome measures
The primary outcome measures were (1) the number of unintentional medication discrepancies found in the admission MR and (2) other prescribing errors identified by the study pharmacists during daily medication chart reviews.
Statistical analysis
Patient characteristics such as age, gender and ethnicity were recorded (table 1). Patient ART scores were obtained from the ART database and recorded retrospectively by the project coordinator. The ART score used was that which best aligned with the day and time at which the study pharmacist carried out interventions, which was recorded in the intervention database. In seven cases, where the ART score differed between the day of MR and day of detecting prescribing errors, the higher score was used for analysis.
Patient characteristics (n=235)
Pilot data from 56 patients were used to calculate that 240 patients were required for the study to provide a statistical power of 90%, to detect a one-point difference in unintentional medication discrepancies between high- and low/medium-risk groups, at a significance level of 0.05.
The data analysis was undertaken in two parts.
Part 1: Distribution of unintentional medication discrepancies and medication errors between ART risk groups
We analysed how the unintentional medication discrepancies and other prescribing errors were distributed across the three ART risk groups. A Kruskal–Wallis (KW) test was applied to assess if there were statistical differences in the number of unintentional medication discrepancies and other prescribing errors, between ART groups. Using generalised linear modelling, counts of discrepancies were fitted by zero-inflated Poisson distribution, and the estimated ratio of the mean number of unintentional medication discrepancies between groups, and their 95% CIs were expressed.
Part 2: ART flags associated with risk of unintentional medication discrepancies
Simple logistic regression was used to determine the predictive power of each flag for unintentional medication discrepancies, with odds ratio (OR) and 95% CIs derived. Combinations of flags significantly associated with risk of unintentional medication discrepancies were selected using binary logistic regression, a method commonly used in the development and validation of predictive risk models, that can be applied to non-Gaussian distributions.25 The area under the receiver operating characteristic curve (AUROC) and Akaike Information Criterion were chosen as selection criteria for subsets of flags in multiple logistic regression. The best subsets and backwards elimination methods were used for model selection. The subset of flags with the Akaike Information Criterion reaching the minimum and a high AUROC were selected. When predicting more than one unintentional medication discrepancy, the direction of the regression coefficient for the significant flag was also considered in model selection. A final subset of flags positively contributing to risk (ie, OR>1) was used. The leave one out cross-validation method, was used to validate the final combination of flags and scores, where a new dataset was generated by deleting each observation and the derived scores were assessed for each new dataset.26 The model fitness parameters, OR and AUROC were summarised for the new datasets and used for model validation. Statistical software, R and SAS version 9.4 were used for analysis of the results.
Results
Distribution of unintentional medication discrepancies and prescribing errors between ART risk groups
In total, 247 admissions (from 235 patients) were included in this study. The mean age of patients was 66 years and 51% were female as shown in table 1. The distribution of admissions based on ART groups is shown in table 2, with patient distribution being approximately one-third in each group.
Number and percentage of admissions by risk group
Table 3 shows the number of patient admissions with numbers of unintentional medication discrepancies and prescribing errors. Patients were, on average, taking eight medications at admission. Over half (51%) of the admissions were found to have at least one unintentional medication discrepancy following MR. The majority of admissions did not have other prescribing errors identified by daily medication chart review.
Numbers of admissions by unintentional medication discrepancies and other prescribing errors
There were significant differences in the number of unintentional medication discrepancies across the three risk groups (p<0.0001, Kruskal–Wallis test). Patients in the high-risk group had a significantly greater number of unintentional medication discrepancies compared with patients in the low group (figure 1). For all other prescribing errors, there were no significant differences between the ART risk groups (p=0.08, Kruskal–Wallis test).

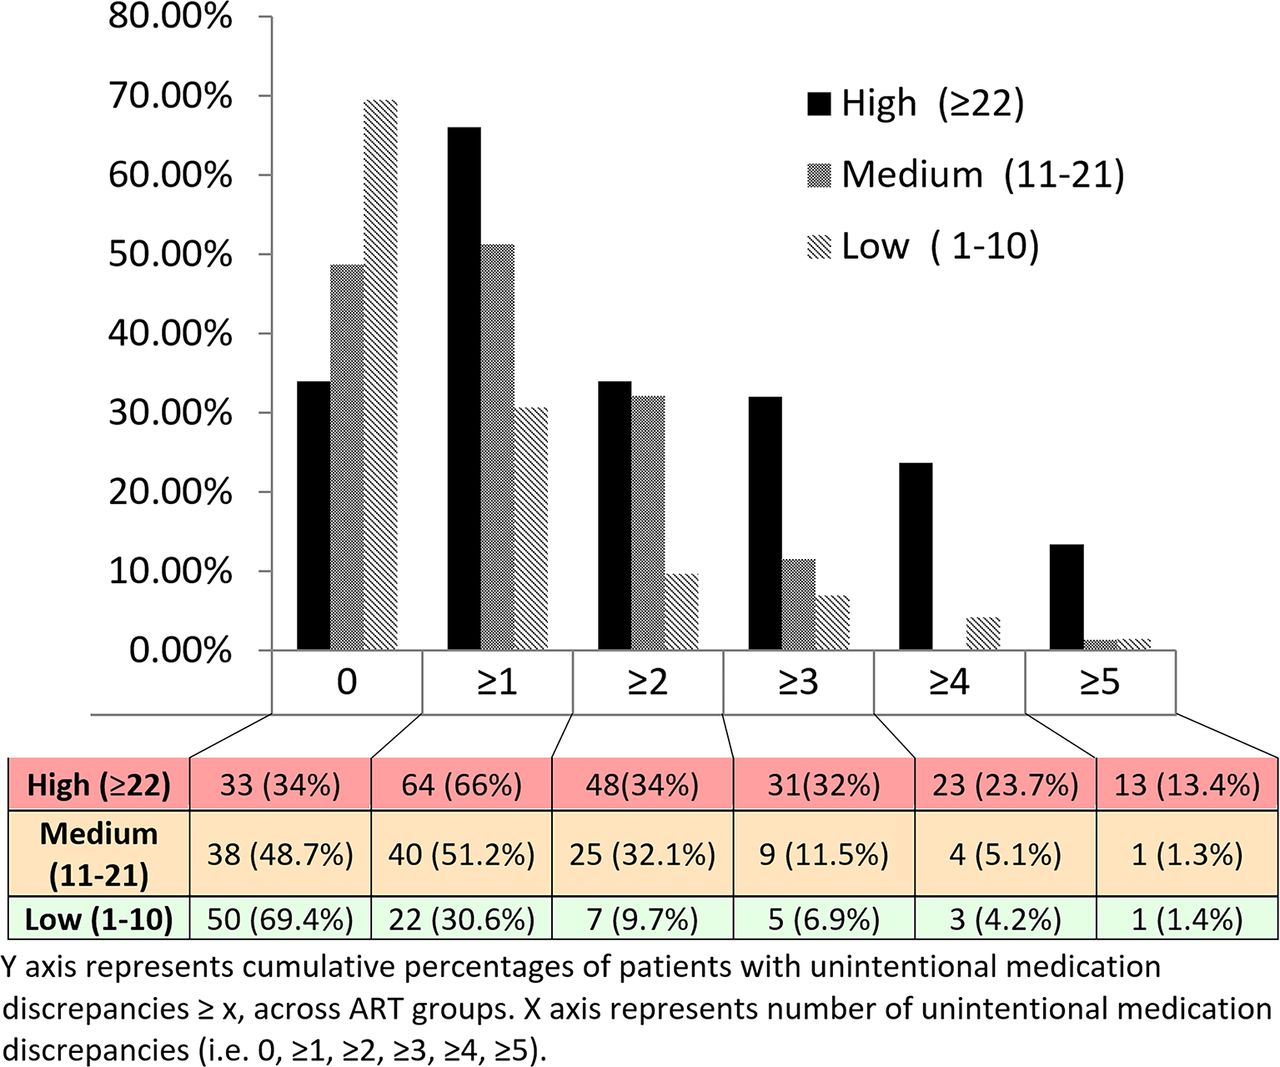
The distribution of number of unintentional medication discrepancies across the ART risk groups. ART, assessment of risk tool.
Using generalised linear modelling, the estimated ratios of the mean number of unintentional medication discrepancies between the risk groups were:
high- and medium/low-risk group: 2.1 (95% CI 1.6 to 2.7)
high/medium- and low-risk group: 2.6 (95% CI 1.7 to 3.8)
medium- and low-risk group: 1.8 (95% CI 1.2 to 2.9)
high- and medium-risk group: 1.7 (95% CI 1.3 to 2.3)
high- and low-risk group: 3.1 (95% CI 2.1 to 4.7).
There was a significant difference between the three risk groups, with the greatest difference seen between the high and low risk groups, with a ratio of 3.1 (95% CI 2.1 to 4.7).
Grading of unintentional medication discrepancies and prescribing errors
Twenty-one per cent of all unintentional medication discrepancies and prescribing errors were judged to have the potential to cause minor harm (for example, a patient taking oral morphine but not charted, any patients taking laxatives or a patient who normally takes non-steroidal anti-inflammatory medication for arthritis, but this was unintentionally not charted). Sixteen per cent of medications had the potential to cause moderate harm (for example a patient taking, as required, short-acting insulin unintentionally not charted, or a patient with a raised international normalised ratio but whose warfarin dose was not adjusted appropriately). Most commonly detected discrepancies and prescribing errors were omissions of a regular medication (78%, found via MR), followed by prescription of the wrong dose (12%, found via MR and chart reviews).
Validation of flags
Most frequently observed flags in the study population (top five)
Admitted patients with pyxis (automated dispensing system for inpatient medicines) medication profiles that had not been updated (no pharmacist check of prescription profile) during the past 72 hours (79.3%);
Taking >8 regular admission medications (56.9%);
Age >75 (for people of non-Maori/non-Pacific Island descent) (33.3%);
Taking anticoagulant medications on admission (30.5%);
Patients readmitted within 7 days of discharge (28.1%).
Flags associated with at least one unintentional medication discrepancy
Four ART flags were significantly associated with at least one unintentional medication discrepancy (table 4).
Taking >8 regular admission medications;
Taking at least one diabetic medication on admission;
Patients readmitted within 7 days of discharge;
Patients readmitted within 30 days of discharge (this flag excludes patients readmitted within 7 days of discharge, who are captured by a previous flag).
Prevalence and OR for each flag with its corresponding predictability for the risk of unintentional medication discrepancies (UMDs)
The prevalence and OR for each flag with corresponding AUROC for risk of unintentional medication discrepancies are listed in table 4. The combined flags considered most predictive of a patient having one or more unintentional medication discrepancies were taking >8 regular admission medications and readmission within 30 days. Of 247 admissions, 109 patients (44%) had at least one of these flags and 40 patients (16%) had both flags. The regression coefficients for these two flags are included in (see online supplementary appendix 4).
The score from these two flags (>8 regular admission medications and readmission within 30 days of discharge) had an AUROC of 0.72 (95% CI 0.66 to 0.78), to predict at least one unintentional medication discrepancy (see online supplementary appendix 5). The AUROC ranges from 0 to 1, with an area closer to 1 indicating greater accuracy in predicting an outcome.27 The result of 0.72 indicated modest discrimination.
Flags associated with at least four unintentional medication discrepancies
ART flags found to be significantly associated with a risk of four or more unintentional medication discrepancies, were (table 4).
Taking >8 regular admission medications;
Being enrolled in a chronic care management (CCM) programme (diabetes);
Taking at least one diabetic medication on admission;
English difficulty;
Poor medication adherence;
Patients readmitted within 7 days of discharge;
Patients readmitted within 30 days of discharge (excludes patients readmitted within 7 days of discharge who were captured by the previous flag).
The combination of flags considered most predictive of a patient having four or more unintentional medication discrepancies was >8 regular medications, antiepileptic medicines, diabetic medicines, English difficulty and readmission in 30 days. Flags and their respective regression coefficients are included in the online supplementary appendix 6). The score from these five flags had an AUROC of 0.81 (95% C.I:0.72 to 0.89) to predict at least four unintentional medication discrepancies (see online supplementary appendix 6). The AUROC of 0.81 indicates that this combination of flags had good discrimination.
Discussion
We examined the relationship between a patient’s ART score and numbers of unintentional medication discrepancies and prescribing errors. More than half of admissions had unintentional medication discrepancies at admission. Patients in the high-risk group had significantly greater numbers of unintentional medication discrepancies than those in the low-risk group (p<0.0001, Kruskal–Wallis test). The majority of patients did not have prescribing errors (84%) and we found no association between risk groups and other errors. The lack of a significant association might have been due to the small number of errors identified. Only 39 of the 247 patient admissions had prescribing errors during their admission. Had we detected a greater number of errors we might also have found a significant association between ART risk groups. The relatively lower error rate of prescribing errors, in comparison with other studies,28 might have been influenced by two factors. At the time of this study medical teams had senior clinicians (familiar with the hospital’s prescribing guidelines) responsible for charting medicines. Also, the study pharmacists were relatively junior and new to our hospital, so some errors might have been missed. Overall, however, the 16% error rate still indicates that more than one in 10 patients experienced prescribing errors, highlighting a significant safety concern.
The second part of the study was undertaken to establish which flags (individually and in combination) were significantly associated with a risk of discrepancies. Four flags were associated with risk of at least one unintentional medication discrepancy, with the most predictive being ‘>8 admission medications’ and ‘readmission within 30 days’. These flags also featured in the prediction of patients at risk of four or more unintentional medication discrepancies, together with three other flags: ‘antiepileptic medications’, ‘diabetic medications’, and ‘difficulty with English’. In total seven flags were significantly associated with discrepancies and an additional two flags showed a trend towards an association (age >75 and multiple outpatient clinic attendance). The remaining flags may not have reached statistical significance as several were not adequately represented in the study population (<10%) and larger studies would be needed to determine their true strength of association. The present findings can be used by other hospitals to create a simplified version of ART where odds ratios of the most predictive flag combinations can be used to calculate risk scores. Our findings also show that there are similarities between the best predictors for unintentional medication discrepancies and best predictors of preventable ADEs, including older age, comorbidities and number of prescribed medicines.29 Early recognition of such significant risk factors during prescribing could help to reduce ADEs.
Risk prediction in healthcare is a rapidly evolving field. In many areas of medicine—for example, hospital readmission, oncology and cardiology, predictive risk tools are in routine clinical use to aid with more accurate and efficient prognosis and resource allocation. While ADE risk tools are not yet routinely implemented, a number of risk scores and prioritisation tools have been developed.30–33 Formal evaluation of user uptake is, however, limited. One such tool, the pharmaceutical assessment screening tool (PAST), developed in a UK tertiary hospital,32 formally evaluated pharmacist attitudes to the risk tool and found that while pharmacists were confident about using the PAST, their clinical judgement would supersede the assigned acuity level.34 This was thought to be due to the need to validate the tool and reinforce its role in patient prioritisation. Also, the tool could be better adhered to if a patient’s acuity level was available electronically and automatically updated. For research in this area to progress, studies comparing risk tools against clinical judgement and studies of the generalisability of available tools in different populations and their impact on patient outcomes are needed.
Our study had some limitations. First, we used unintentional medication discrepancies and other prescribing errors as proxy measures for ADEs. Ideally, a study should be undertaken to also measure harm as the primary outcome. A further limitation was the retrospective allocation of ART scores. Although most patients had no change in risk groups, in the seven cases in which there was variation between the ART score at the time of MR and the score at the time of chart checking, the highest score was used. Also, owing to technical challenges with extraction of laboratory test results, the laboratory flags were not included in this study. However, it seems clinically intuitive that the addition of these flags should help to improve the tool’s ability to identify high-risk patients as they provide clinically actionable data in a timely manner. For example, a patient who triggers the therapeutic monitoring flag because of elevated drug levels can be immediately reviewed by the clinical pharmacist and have their medication dose appropriately adjusted, or for a patient who triggers the coagulation flag, the medical team can be alerted early to adjust the anticoagulation dose and monitor the patient. Another limitation was patient recruitment, which was restricted to weekday admissions. Including weekend admissions, when the hospital operates with reduced clinical staff, might have resulted in identification of a greater number of discrepancies and errors. Finally, given that ART was validated in a cohort of medical patients, external validation studies, including the laboratory flags, would be informative to ensure generalisability to different clinical settings and patient populations.
Conclusion
ART is an effective method of identifying hospital patients at high risk of unintentional medication discrepancies. Patient prioritisation technology such as ART is likely to be useful for many healthcare organisations with constrained clinical pharmacist resources.
Key messages?
What is already known on this subject?
Adverse drug events (ADEs) are a significant burden on hospitals globally.
Pharmacist–led medication reconciliation and review can reduce ADEs but are resource intensive.
Patient prioritisation tools such as the assessment of risk tool (ART) may be effective in identifying high-risk patients for early and targeted pharmacist interventions.
What this study adds?
ART can be an effective tool for identifying which patients are at high risk of unintentional medication discrepancies at admission.
ART flags most predictive of risk of unintentional medication discrepancies were ‘more than eight admission medications’ and ‘readmission within 30 days’.
Acknowledgments
The authors thank Aaron Jackson, Arthur Liu, Helen Lo and the clinical pharmacists at Middlemore Hospital for their significant contribution to the development, implementation and validation of the assessment of risk tool.
References
Footnotes
EAHP Statement 4: Clinical Pharmacy Services.
EAHP Statement 5: Patient Safety and Quality Assurance
Funding This study was approved by the Middlemore Hospital Research Office. Through online assessment of NZ Health and Disabilities Commission Ethics Committee, it was decided that given the study was observational and did not have direct intervention on patients and patient consent would not be required.
Competing interests None declared.
Ethics approval Institutional review board.
Provenance and peer review Not commissioned; externally peer reviewed.
Linked Articles
- Editorial
- Original article
- Original article