Article Text

Abstract
Aims—To identify a model to assess general practitioner use of pathology services that could be applied to assess specific interventions designed to promote best practice.
Methods—A database containing standardised requesting data for 22 general practices was constructed. The database contained 28 tests covering 95% of general practitioner activity, distributed across pathology, and it was evaluated during two sequential six month periods. A comparison of ranks of requesting activity between different time periods was undertaken by calculating Pearson rank correlation coefficients. Requesting numbers were also adjusted for patients' age and sex distributions within the 22 practices for a sample of three high volume tests. The effects of distributing requesting guidelines and details of requesting activity were assessed during two sequential three month periods.
Results—Requesting activity was extremely stable during the two baseline periods for most tests (r > 0.80 for 20 of the 28 tests). Several less discriminatory tests were identified. Age and sex adjustment had minimal impact on the ranks of requesting activity. Requesting activity during the two three month periods after distributing guidelines and comparative details of individual requesting activity showed little change (overall correlation coefficient, 0.844 between baseline and intervention periods).
Conclusion—Ranking general practitioners requesting activity adjusted for practice list size provides a reproducible means of measuring requesting activity for most pathology tests performed in general practice. Activity was not influenced by age or sex of patients on the practice list. Distributing requesting guidelines and individual requesting activity on their own do not have any measurable impact on requesting activity. More innovative (possibly multiple) interventions might be required to influence general practitioner requesting practice.
- benchmarking
- appropriateness
- clinical governance
Statistics from Altmetric.com
Advising on the appropriate use of laboratory tests has long formed part of the job of consultant pathologists, and several studies have reported various amounts of inappropriate testing in a range of specific situations.1 The move towards clinical governance and use of best practice (where possible, evidence based) has increased the focus on appropriateness of laboratory testing and the evidence base behind many of the tests performed.2–4 This area raises a number of specific questions for pathology.
First, is there sufficient evidence throughout pathology to support the application of evidence based principles across the wide range of tests used in pathology? Second, is it possible to influence requesting practices among users by disseminating evidence based or best practice guidelines where these are available? Third, is it possible to define a sensitive and specific model by which any intervention designed to influence the use of pathology services can be measured?
It is difficult to envisage the gold standard of randomised controlled trials being applied to all of the possible situations involving pathology tests. Even in areas where the highest degree of evidence is available in a disease setting,5 information is limited about the application of laboratory investigations in those situations—for example, the optimum frequencies of repeat cholesterol testing in secondary coronary prevention, or of repeat glycated haemaglobin (HbA1c) measurement intervals in patients with diabetes. Therefore, it is likely that many areas in pathology will be limited to lower categories of evidence, based on non-randomised trials, or on consensus opinion. The evidence base for laboratory investigations appears to be limited.
Although several studies have reported successful interventions that have reduced laboratory test request rates for specific tests in specific circumstances,6–8 these studies have examined overall user requesting activity in test specific areas of global inappropriate testing, and most have been hospital based. We are aware of one study9 that has compared non-hospital pathology requests in specific areas of test appropriateness, although variation in clinical practice between requests was not examined in this study. Once these areas of global inappropriate testing across all practitioners have been remedied by changes in the laboratory request form and changes to laboratory test protocols, there remain very pronounced differences in requesting activity between individual practitioners and general practitioner practices.
Guidelines can be implemented at two levels: (1) in the laboratory, by the use of diagnostic protocols in which a request is directed for specific tests according to a predetermined protocol within the laboratory, or (2) by means of guidelines and protocols adopted by individual requesters. Here, we consider the latter of these two situations and present a model for measuring general practice laboratory test activity in a format that is designed to stimulate user interest, and which provides reproducible data that can be used to measure the impact of specific interventions designed to change test requesting practice in primary care.
Methods
Figure 1 summarises the methodology used in our study.
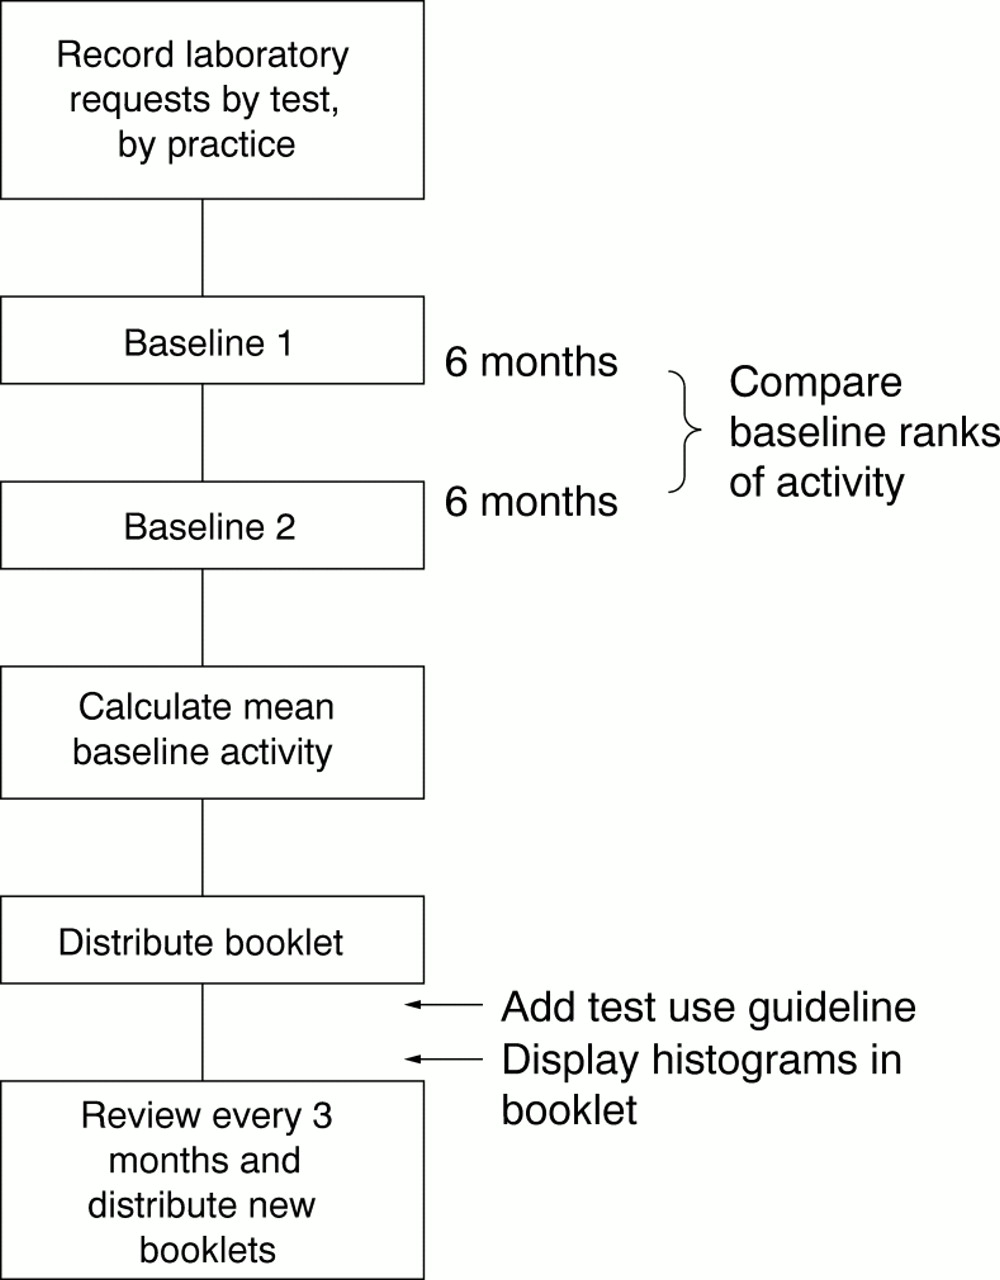
Study design.
DATABASE
A spreadsheet was constructed, showing numbers of tests requested by all of the general practices we serve, over a six month period, for a selection of pathology tests (13 biochemistry, six haematology, eight microbiology, and one histology). These were chosen across the pathology disciplines to include approximately 95% of all tests performed by the general practitioners.
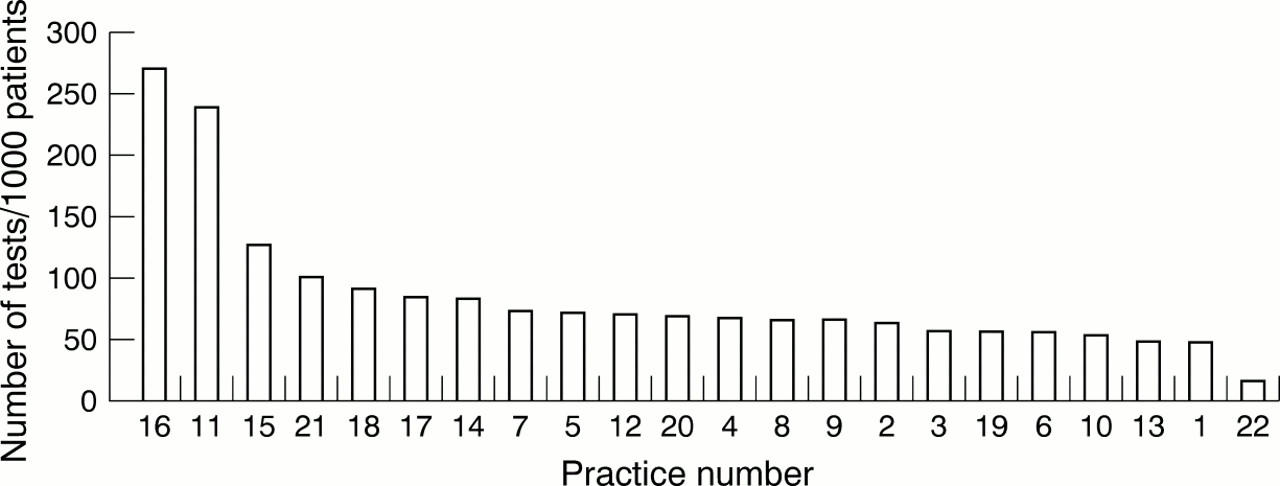
Practice list sizes were obtained from the regional health authority and applied to the database to obtain standardised requesting figures for each 1000 patients on the practice list. These results were then displayed in graphical form (fig 2). Results were anonymised by practice and collated to form a booklet, which was customised for each practice.

Sample graphical display of requesting figures (April to October 1997) for cholesterol for each 1000 patients on the general practitioner practice list for 22 general practices (numbered 1–22). Cholesterol screening is indicated in patients with established coronary heart disease, in primary prevention patients over 35 years of age, and in all patients with a family history of hypercholesterolaemia. Borderline results should be repeated annually, but acceptable results need not be repeated more frequently than every five years in primary prevention. On treatment follow up should be three monthly until targets are met, and six monthly thereafter. High users should consider whether they are screening patients that they are unlikely to treat. Category of evidence: consultant opinion from national guidelines and randomised controlled trials.
The practices concerned had list sizes ranging from 1000 to 16 000 patients and contained between one (four practices) and nine partners (one practice).
A brief guideline was included on each graph based on the highest amount of evidence available for the test, taken from a literature search (example shown in fig 2). Where no published evidence based guidelines were available, published consensus guidelines were used. In the absence of these, guidelines were constructed from regional audit guidelines, local multidisciplinary group guidelines, or consultant opinion, in that order of priority. These guidelines were incorporated into the booklet and linked to each graph. Specific comments on the patterns of activity for each test were also incorporated into each graph (fig 2). The first booklets were distributed at the end of March 1998. Each booklet contained a report on its front page, which was identical for each practice and listed the major findings. A baseline period was studied during the six months from April to September 1997, and compared with a second baseline period from November 1997 to April 1998.
FOLLOW UP
Numbers for each test were analysed prospectively on a quarterly basis from April, and a first follow up booklet was distributed in July 1998 for the period covering April to June 1998. A short questionnaire (fig 3) was distributed to all of the general practitioner practices six weeks after the first booklet had been circulated to gauge users' views on the benefits of the information and changes it had stimulated (fig 1), and any additional, spontaneous comments or developments generated from the booklets were recorded. A second booklet was then distributed covering June to September 1998.

The questionnaire. This questionnaire was sent to each practice one month after the distribution of activity booklets to assess users' reactions to the data, and to record any changes described in response to the data.
STATISTICAL ANALYSES
Each time period produces a database of 616 data points (28 tests × 22 practices). Requesting numbers for each test were skewed across the general practices and are shown for one test (serum cholesterol estimation) in fig 2. Therefore, comparisons between different time periods for the same test were made by calculating the Pearson rank correlation coefficient for each test.
Interpractice variability in requesting for each test was expressed as the ratio of the numbers of tests recorded for the highest two users (top decile) to the numbers requested by the lowest two users (bottom decile). No attempt was made to compare total numbers, either for each test or by combined totals of all tests, because of the expected seasonal variation and other confounding variables on overall test requesting.
AGE AND SEX ADJUSTMENT
Age and sex adjustment was made using direct standardisation to the combined population of the 22 practices.10
Age and sex breakdowns for the 22 practices were obtained from the regional health authority. Similar distributions were obtained for three sample tests (cholesterol, glucose, creatinine + electrolytes) over the previous year from the pathology database. These data were combined to produce standardised requesting ratios, adjusted in each practice for age and sex. The ratios were then compared with the unadjusted baseline data using the same statistical methods as described above.
Results
BASELINE DATA
Data were obtained for two baseline periods, from April to September 1997 and from October 1997 to April 1998. Considerable inter-individual variation in test requesting was seen. Most pathology tests produced a skewed, S shaped activity curve (fig 2).
The median difference between the top and bottom decile of requests was 700%. There were no identifiable trends in total requesting activity.
The least variation was seen for the “core” biochemistry and haematology tests (electrolytes, liver function tests, full blood count (median 90th to 10th centile request ratio, 260%)). In contrast, intra-individual variability of test requesting for individual pathology tests was low (coefficient of variation between two baseline periods, 11%). Rankings during the first two six month baseline periods were very similar, and those differences in ranking that were observed lay in the modal band of requesters, where test numbers were numerically close together. Pearson rank correlation coefficients for the first two six month baseline periods ranged from 0.59 to 0.96 (median, 0.90) (table 1; fig 4). Within this range, however, very high correlations were found for most tests (r > 0.80 for 20 of the 28 tests), with lower correlations for the eight tests that showed the least separation between the modal practices. The differences in rank that were observed occurred in the central part of the graph where request rates were numerically close together.
Pearson rank correlation coefficients between two six month baseline periods for requesting activity for each 1000 patients in 22 practices for 28 pathology tests
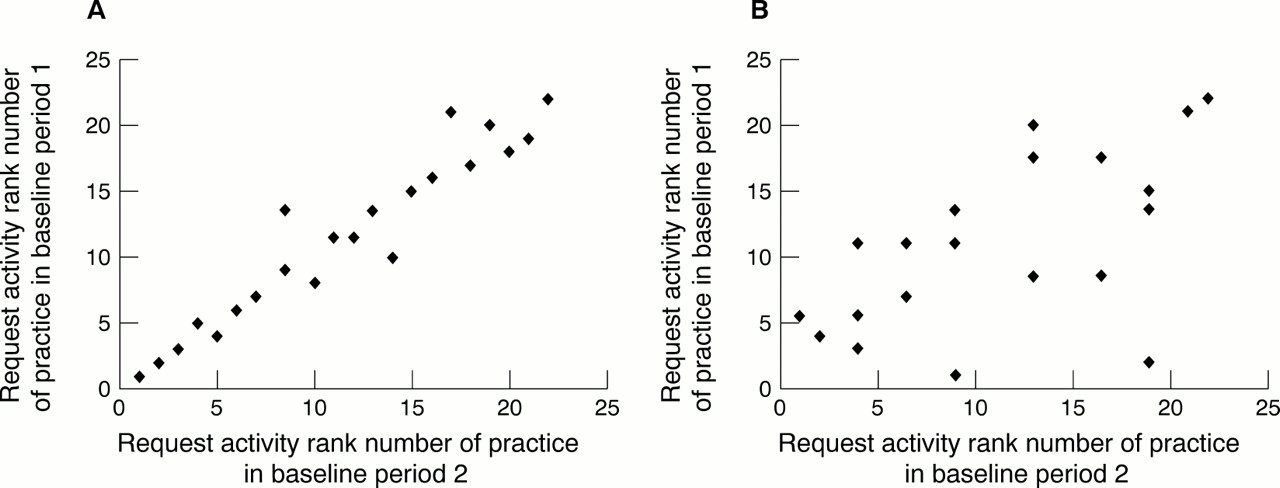
Scatter plot for rankings of requesting activity for each 1000 patients for 22 practices during two six month baseline periods. (A) Highly discriminatory test (glucose); (B) poorly discriminatory test (rheumatoid factor).
INTERVENTION
The first level of intervention was the booklets themselves, which contained evidence or consensus based guidelines combined with specific comments on activity for each test. These were distributed to the general practitioners at the end of the baseline period and three months later.
Correlation coefficients between the first three month intervention period and the mean rank for the baseline periods were quantitatively similar, although slightly lower than those obtained between the two six month baseline periods. The median correlation coefficient was 0.82 (range, 0.37–0.95) compared with 0.89 (range, 0.61–0.97) for the baseline periods. Weaker correlations were found in particular for four tests (high density lipoprotein cholesterol, rheumatoid factor, ulcer swabs, and urine microscopy). Qualitatively, these four frequency distributions all contained a wide modal band that included approximately 80% of practices, in which values were numerically close together, and which also contained many tied ranks. Therefore, small differences in test requests had a disproportionately high influence on rank for these four tests. Correlation values for the second three month intervention period (not shown) were numerically similar to the first.
QUESTIONNAIRE
The questionnaire (fig 3) distributed after the baseline booklets had been released was returned by 16 of the practices (73%). Satisfaction with the information provided was high (median plus modal score, 8 out of 10) and a number of specific interventions were described by several practices. Two practices requested a visit by a consultant to discuss individual policies and two further practices requested information on additional tests not included in the initial database.
One of the two general practitioner primary care group chairs requested that a non-anonymised data listing be released for that locality, for internal use.
AGE AND SEX ADJUSTMENT
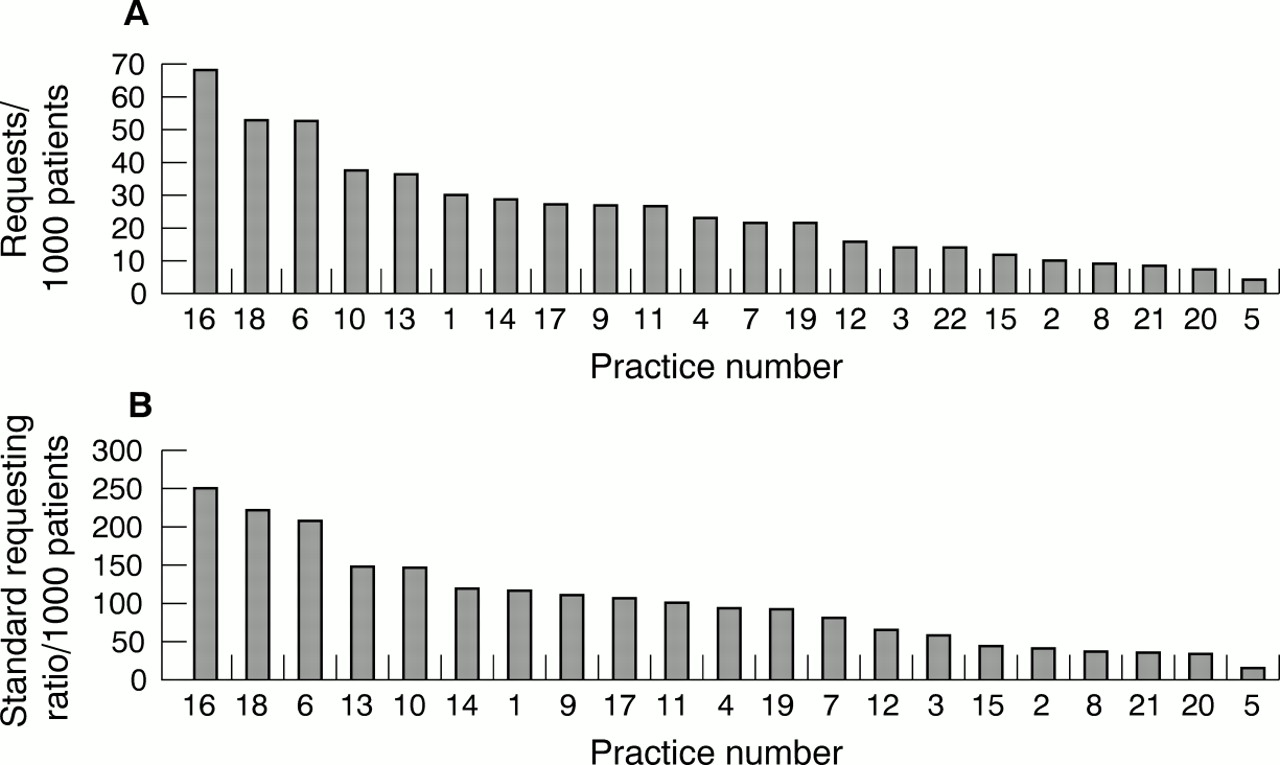
Age and sex adjustment had minimal effect on the rank positions of the different general practitioner practices for any of the three sample tests. Rank correlation coefficients between adjusted and unadjusted data for the four data sets (cholesterol, glucose, creatinine + electrolytes, and all tests combined) ranged from 0.96 to 0.99.
In addition, as for the baseline data, the only minor rank changes that did occur were seen in the central part of the graph, where request rates were numerically close together. Rankings in the upper and lower quartiles were superimposable. Sample comparative rankings for glucose are shown in fig 5.

The influence of age/sex adjustment on the distribution of requests for glucose tests in 22 practices (numbered 1–22). (A) Crude rates; (B) standard requesting ratio (adjusted for age and sex).
Discussion
Most laboratories are aware that requesting patterns vary considerably between general practices, and most consultants will have witnessed the unsustained response to issuing intermittent guidance on test use, unless this is supported by structural changes—for example, changes to the laboratory request form. We have designed a benchmarking scheme for general practitioners that allows practices to compare their test requesting against other practices. This scheme incorporates local best practice guidelines in an attempt to influence requesting practice, and we describe the impact of an initial intervention based on the benchmarking document itself.
In the absence of good quality evidence across a wide range of pathology areas, benchmarking offers a potential means of assessing individual user activity, provided that the data are reproducible, that they reflect differences in clinical practice and not simply in patient demographics within the cohort studied, and that confounding variables can be excluded. Once a model has been defined, it is then possible to examine different interventions to see whether these influence practice.
The model described is straightforward to apply and repeatable, and was not significantly affected by patient demographics within the cohort studied. This model makes no attempt to correct for confounding variables relating—for example, to secondary referral patterns, which could significantly affect test requesting numbers. It might be possible for this to be done at a later date, particularly when use of the single NHS number becomes more widespread and valid patient linkage data are more accessible.
However, in keeping with other benchmarking exercises, it does highlight anomalies that the users themselves can then interpret with a view to their own practice or specialist clinics or interests, and acts as a carrier for best practice advice. The extent of the interpractice variation seen strongly suggests that differences in clinical practice play an important part in this variation, and it is difficult to explain such large differences without concluding that some users are requesting tests more appropriately than others.
The extremely close correlations between practice rankings in the two six month periods for most of the tests demonstrate that ranking practice activity provides a stable indicator that could be used to detect the impact of specific interventions aimed at influencing requesting practice. Changes in rank correlation, measured by difference plotting, should enable any important changes in practice to be identified. The poorer correlation for tests with numerically similar requesting frequencies between practices is not surprising, and suggests that the model might not be appropriate for these tests.
The initial intervention, which consisted of an information booklet containing activity and requesting guidelines, appears to have had no impact on requesting patterns. Although this finding might not be surprising to some pathologists, it does provide objective evidence that pathologists require more innovative solutions to influence requesting practice, and that the distribution of guidelines to general practitioners on an intermittent basis does not produce any medium term change in requesting habits. In a systematic review, Solomon et al confirmed that, to change physicians' test requesting patterns, interventions based on multiple behavioural factors were more successful.6 We are currently pursuing other proactive means of “getting the message over”, and intend to test the impact of these interventions using the same method. Interestingly, the lack of real impact on requesting activity contrasted with the positive questionnaire feedback, suggesting that the questionnaire did little to increase awareness about the data.
The fact that adjustment of requesting patterns for age and sex demographic data within the general practices has no impact on the ranks of requesters should enable us to conduct future comparisons using the raw, unadjusted data, which will simplify future analyses. Nevertheless, it cannot be assumed that age and sex will not affect data in other catchment areas. A detailed analysis of the influence of other sociodemographic factors on test activity is in preparation.
The advent of primary care groups and clinical governance leads within these groups offers the prospect that issues such as the use of pathology services might become a focus for debate within these groups. It is interesting that one of the two main primary care groups served has chosen to de-anonymise the data and share the information between its members. The success of any programme to modify use of a service will ultimately be governed by the extent to which the project is taken on internally by the users themselves, because changes to laboratory protocols and request forms cannot influence all areas of test appropriateness. Therefore, we plan to implement a range of interventions in conjunction with the primary care group clinical governance leads in an attempt to modify general practitioner requesting patterns. A second primary care group that has also received the booklet will act as a control group for these interventions. This will include discussion visits with primary care groups and a planned “cascading down” of specific questions raised at primary care group meetings to the individual practices, so that practices are encouraged by peer review to examine areas in which requesting activity is far removed from that of their colleagues. This process does not assume that a statistical outlier in terms of requesting activity is necessarily not practising correctly, but simply serves as a flag to identify possible areas to examine, specific to that practice.
These approaches are being combined with a change in the laboratory form towards requests for tests based on a diagnosis, rather than the test itself, and we wait with interest to find out whether this type of combined intervention will influence requesting of laboratory tests.
Acknowledgments
We thank our colleagues Dr F Ahmad, Dr CA Bloxham, and Dr DCA Senadhira for their contributions to this benchmarking exercise; Miss L Mulligan for her help in setting up the databases; Mr P Gedling for his help and advice on statistical methodology; and Mrs S Richardson for her help and patience in preparing this manuscript. This work was carried out with the assistance of a grant from the Bishop Auckland General Hospital audit committee.