Article Text

Abstract
Background Although medical ethicists and educators emphasise patient-centred decision-making, previous studies suggest that patients often prefer their doctors to make the clinical decisions.
Objective To examine the associations between a preference for physician-directed decision-making and patient health status and sociodemographic characteristics.
Methods Sociodemographic and clinical information from all consenting general internal medicine patients at the University of Chicago Medical Center were examined. The primary objectives were to (1) assess the extent to which patients prefer an active role in clinical decision-making, and (2) determine whether religious service attendance, the importance of religion, self-rated spirituality, Charlson Comorbidity Index, self-reported health, Vulnerable Elder Score and several demographic characteristics were associated with these preferences.
Results Data were collected from 8308 of 11 620 possible participants. Ninety-seven per cent of respondents wanted doctors to offer them choices and to consider their opinions. However, two out of three (67%) preferred to leave medical decisions to the doctor. In multiple regression analyses, preferring to leave decisions to the doctor was associated with older age (per year, OR=1.019, 95% CI 1.003 to 1.036) and frequently attending religious services (OR=1.5, 95% CI 1.1 to 2.1, compared with never), and it was inversely associated with female sex (OR=0.6, 95% CI 0.5 to 0.8), university education (OR=0.6, 95% CI 0.4 to 0.9, compared with no high school diploma) and poor health (OR=0.6, 95% CI 0.3 to 0.9).
Conclusions Almost all patients want doctors to offer them choices and to consider their opinions, but most prefer to leave medical decisions to the doctor. Patients who are male, less educated, more religious and healthier are more likely to want to leave decisions to their doctors, but effects are small.
- Scientific research
- philosophical ethics
- religious ethics
Statistics from Altmetric.com
Introduction
Among the many factors that inform decisions in medical ethics, patient autonomy is often the most prominent. In a memorable 1977 essay, Cassell argued that the very function of medicine is to preserve autonomy.1 However, concern for autonomy raises additional issues, such as how to balance patient and physician autonomy, how much a patient must understand to make an choice and whether individual patients desire to make their own decisions about their medical care.
Several recent empirical studies have raised questions about the role patient autonomy plays in clinical practice. For instance, in a 2002 survey of US adults, Levinson and colleagues reported that not all patients want to participate in decisions; half of respondents preferred to leave final decisions to their doctors.2 A 2003 article by Joffe and colleagues reported that patients did value being included in the decision-making process, but confidence and trust in providers, and respectful and dignified treatment were stronger predictors of patient satisfaction.3 In 2007, Curlin and colleagues reported that 14% of doctors did not believe it necessary to present all options—including morally controversial options—to patients4; a practice many considered inconsistent with respect for patient autonomy.5 These surveys demonstrated that a variety of covariates, such as gender, education level and religiosity, were important predictors of prioritising patient autonomy.
This study builds from earlier surveys considering many of the same questions, such as whether patients want doctors to offer choices and whether they want doctors to make medical decisions on their behalf, but in a patient population not previously studied. While Levinson et al surveyed adults in the general population, and Joffe et al surveyed recently discharged patients, this study surveyed medicine inpatients admitted to a large urban medical centre. This is an important patient population because healthy people cannot always predict what their preferences will be when they fall ill. We considered demographic characteristics, religious characteristics and patient health status as possible predictors, since all have been found to be relevant to debates over the role of patient autonomy in the medical decision-making process.2 4 6 7
Methods
Study population
Data for this study were drawn from the University of Chicago Hospitalist Study (BSD IRB Protocol #9967). This project studies all consenting patients admitted to the general internal medicine service at the University of Chicago.8 Hospitalised patients are invited to participate in a 15 min bedside interview that is conducted within 48 h of admission. Proxy respondents are used when patients cannot participate directly. Interviewers gather detailed health and socioeconomic information, and since 2006 questionnaires have included three questions about religion. Participants in this analysis were enrolled between January 2006 and June 2009.
Primary measures
The primary criterion measures were patients' preferences about having choices and making their own medical decisions. We asked patients how strongly they agreed or disagreed with two items: first, “I prefer that my doctor offers me choices and asks my opinion”; second, “I prefer to leave decisions about my medical care up to my doctor”. Both questions are identical to those used by Levinson et al,2 but we condensed their six-point response scale to a four-point scale (definitely agree, agree somewhat, disagree somewhat, definitely disagree).
Predictor variables included demographic and religious characteristics. Demographic information included age, sex, race/ethnicity, marital status and level of education. Response categories are listed in table 1. Religious/spiritual characteristics were assessed using three validated measures. Religious attendance was measured by asking, “How often do/did you/the patient attend church, synagogue, or other religious meetings?” This question has been validated as a part of the Duke Religion Index.9 Responses were categorised as ‘never,’ ‘less than once a week,’ and ‘once a week or more.’ Intrinsic religiosity, the extent to which religion guides or gives purpose to one's life,10 was assessed by asking whether patients disagreed, agreed or strongly agreed with the statement, “I try hard to carry my religious beliefs over into all my other dealings in life.” Responses ranged from disagree to strongly agree. Spirituality was measured by asking, “To what extent do you consider yourself a spiritual person?” Response categories were slightly/not at all spiritual, moderately spiritual and very spiritual. Both the measures of intrinsic religiosity and spirituality have been used in the General Social Survey11 and in a large national survey of doctors.9 10
Other predictor variables incorporated patients' health status. Administrative data were used to calculate a Charlson Comorbidity Index score; an objective measure of health status where numbers range from 0 to 10 and higher numbers indicate more severe comorbidities.12 A self-rated health score, which is a subjective measure of patient health, was generated by asking patients, “On a scale of 0 to 100, with 0 being death and 100 being perfect health, how do you rate your current health?”13 14 We also used the Vulnerable Elder Score, a composite derived from how much help a patient needs to complete several activities of daily living. Scores range from 0 to 11, with higher scores predicting increased risk of death or functional decline.15
Statistical analysis
First, we calculated percentages for each criterion measure and predictor variable. We used the Pearson χ2 test to examine differences in responses to each of the primary criterion measures according to patients' demographic, religious and health characteristics. We then used multivariable logistic regression to test whether bivariate associations remained significant after adjustment for relevant covariates. All statistical analyses were performed using Stata/SE10.0 (Stata Corp).
Results
Study participants
Of the 11 620 patients invited to enrol in the Hospitalist Study from January 2006 to June 2009, 1671 (14%) declined to participate. Of the 9949 patients enrolled during that period, religious measures were collected from 8308.
Table 1 shows the characteristics of the 8308 participants. Notably, 73% of participants were African-American, 60% were female and 14% were in poor health as indicated by a Charlson Comorbidity Score of ≥4. Participants were fairly religious, with 35% attending services once a week or more often, half (50%) trying hard to carry their religious beliefs into all other dealings in life and 40% describing themselves as very spiritual. Education levels varied with race/ethnicity: 36% of white respondents had not attended university, while 59% of African-American and 63% of Hispanic respondents had not attended university (p<0.001).
patient characteristics (N=8308)*
Criterion measures
Nearly all participants (97%) strongly agreed or agreed with the statement “I prefer that my doctor offers me choices and asks my opinion.” Two-thirds (67%) of respondents strongly agreed or agreed with the statement, “I prefer to leave decisions about my medical care up to my doctor.” (Table 2) The two criterion measures were found to be significantly associated using the Pearson χ2 test, but they had a correlation coefficient of −0.04, indicating that they are nearly independent. Because the first statement had near universal agreement, subsequent analyses focused on the second statement.
Inpatient preferences regarding medical decisions
Demographic characteristics as predictors of patients' decision-making preferences
Older patients were slightly more likely to prefer leaving medical decisions to the doctor, as determined by multivariable logistic regression using age as a linear variable (OR=1.019; 95% CI 1.003 to 1.036). This means, for example, that if we took a 25-year-old patient and a 75-year-old patient (or a 50-year increase in age), we would expect to see about a 95% increase in the odds of preferring to leave decision to the doctor. Women were less likely to prefer leaving decisions to the doctor (66% vs 69% of men, OR=0.6, 95% CI 0.5 to 0.8). Educated patients were less likely to leave their medical decisions to the doctor. For instance, compared with patients with no high school diploma, those with a university or postgraduate degree were less likely to defer decisions (57% vs 75%, OR=0.6, 95% CI 0.4 to 0.9). In bivariate analysis, married patients and white patients were less likely to defer to the doctor, but these findings did not remain significant in multivariable analysis. (Table 3)
Prevalence and likelihood of preferring to leave decision to the doctor, stratified by patient demographic and religious characteristics, and patient health
Religious characteristics as predictors of patients' decision-making preferences
In multivariable analysis, there was a small but statistically significant association between being religious and preferring to leave medical decisions to the doctor. Compared with patients who never attend services, those who attend once a week or more were more likely to allow the doctor to make the medical decisions (66% vs 65%, OR=1.5, 95% CI 1.1 to 2.1). Similarly, patients who strongly agree that they try hard to carry their religious beliefs into all other dealings in life were more likely (than those who disagree with the statement) to defer medical decisions to the doctor (67% vs 63%, OR=1.4, 95% CI 1.01 to 2.1). (Table 3)
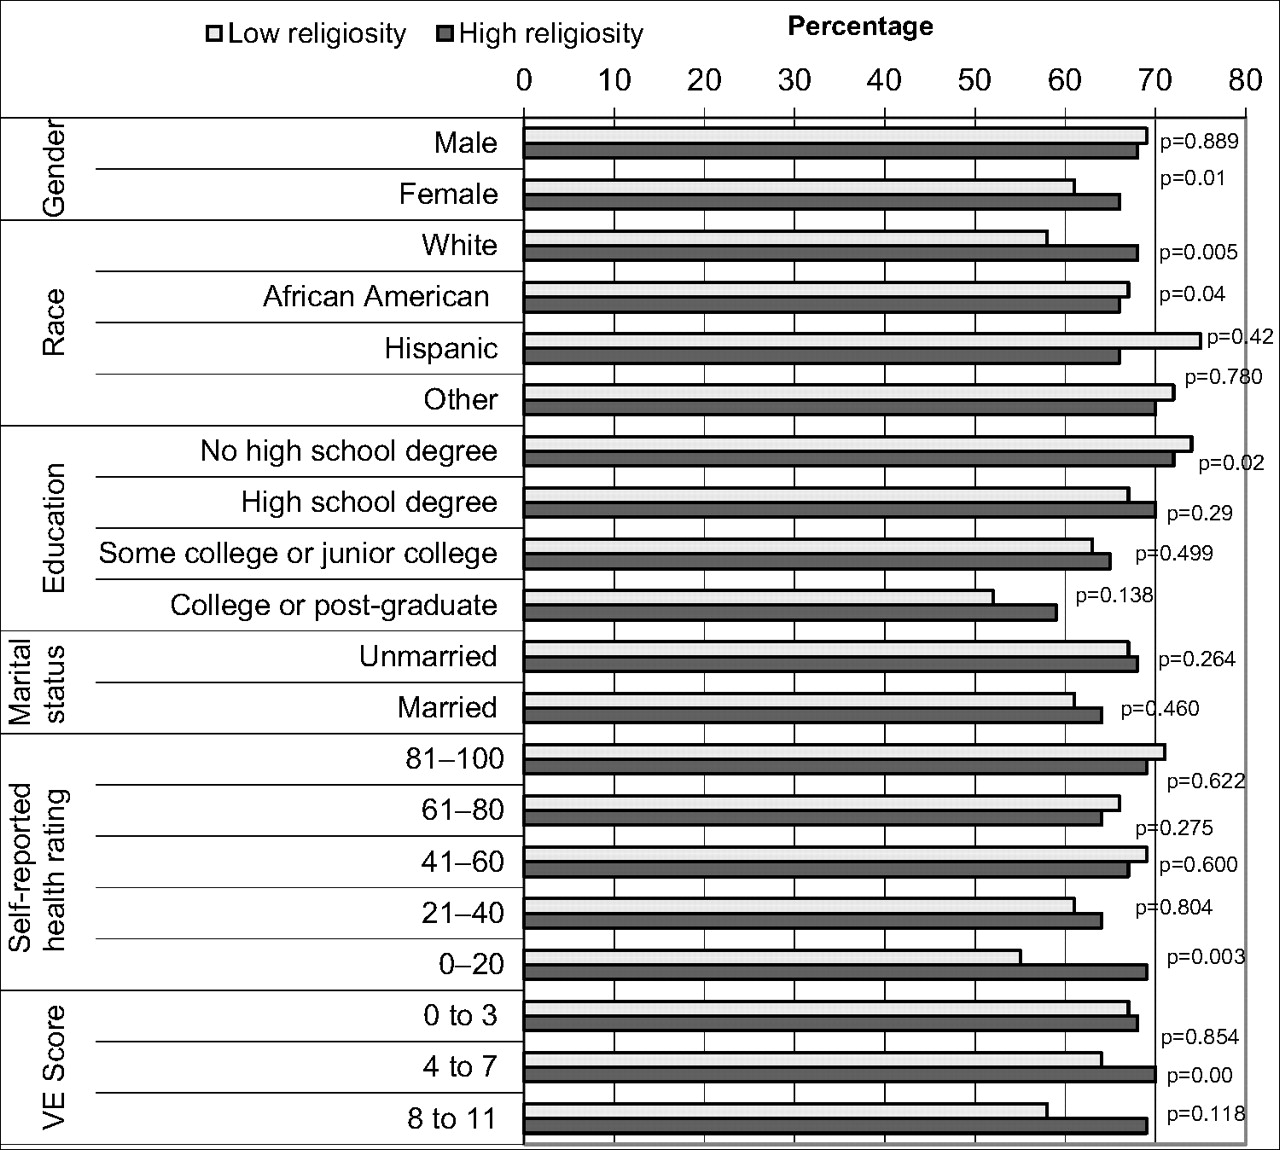
In further subgroup analyses (bivariate), we found that the direction of association between intrinsic religiosity and preferring a physician-directed style of decision-making was consistent across gender, race, education, marital status, self-reported health and Vulnerable Elder Score (figure 1), although the findings rarely reached statistical significance. In contrast, the direction of association for attending religious services varied across other characteristics (figure 2), yet here also the findings were rarely statistically significant. Those with high attendance were more likely to prefer physician-directed decision-making if they were female (but not if they were male), white (but not if they were minorities) or had poor health (but not if they had good health).

Subgroup analyses for intrinsic religiosity and preferring to leave decision to the doctor. p Values reflect bivariate analysis (χ2) and are therefore not adjusted for other patient characteristics.

Subgroup analyses for religious attendance and preferring to leave decision to the doctor. p Values reflect bivariate analysis (χ2) and are therefore not adjusted for other patient characteristics.
Patient health characteristics as predictors of patients' decision-making preferences
In general, healthier patients were slightly more likely to prefer leaving medical decisions to the doctor. For instance, patients who rated their health in the 0–20 range were less likely to defer medical decisions to the doctor (63% vs 71%, OR=0.6, 95% CI 0.3 to 0.9) than those who rated their health from 81 to 100. Likewise, compared with patients with a low Vulnerable Elder Score (0–3), those with high vulnerability8–11 were less likely to prefer leaving medical decisions to the doctor (66% vs 68%, OR=0.6, 95% CI 0.4 to 0.8). (Table 3)
Discussion
In this large single-centre patient survey, we found that the vast majority of patients (97%) want doctors to offer them choices and to consider their opinions. However, most patients (67%) also prefer to leave medical decisions to the doctor. Patients are more likely to prefer leaving medical decisions to the doctor if they are older, male, less educated, more religious or healthier. Each of these predictors has a small but statistically significant effect.
Our overall finding that patients want their opinions heard but ultimately prefer leaving medical decisions to the doctor, is consistent with previous publications. In a 2002 nationally representative survey of US adults (N=2765), Levinson and colleagues found that though 96% of participants preferred their doctors to offer them choices and ask their opinions, 52% preferred to leave final decisions to the doctor.2 This pattern is challenging to interpret in an ethical climate where patient autonomy is given a central role. A partial explanation can be found in a 1998 survey of Massachusetts patients (N=12 680), showing that ‘treatment with respect and dignity’ and confidence and trust in providers were more closely associated with patient satisfaction than adequate involvement in decisions, leading the authors to conclude that a narrow emphasis on autonomy and shared decision-making can be misplaced.3 Patients are well aware of the importance of a doctor–patient dialogue, where both can weigh the various choices in light of the patient's wishes and personal circumstances16 17; however, many patients are reluctant to assume final decision-making authority. It appears that patients highly value doctors' clinical expertise and want neither to be ignored, nor to be set adrift amidst a sea of treatment options.
Religious patients—those who attend services frequently or report carrying their religious beliefs into all areas of life—were more likely to prefer doctors to make medical decisions on their behalf. Of note, a previous survey revealed that religious doctors are also more likely to prefer doctors to make medical decisions on the patient's behalf. In that survey, 47% of highly religious doctors gave the patient's expressed wishes and values the highest possible weight, compared with 67% of non-religious doctors.18 One possible explanation is that religious people, whether patients or doctors, might be more comfortable with the idea of submitting (or asking a person to submit) to authority.
We found that women showed a stronger preference for active involvement in clinical decision-making. This is consistent with the finding of Levinson et al that women were more likely than men to prefer doctors to offer choices and seek opinions, and were less likely to leave medical decisions to doctors. Levinson et al may be correct in concluding that “women are more likely to prefer a collaborative style of communication with their doctors by assuming an active role in the process of their healthcare”.2
Patients with more education were more likely to want control over their medical decisions, a finding also observed by Levinson et al.2 This is reminiscent of a 2006 qualitative study of older patients. Many said they could not meaningfully participate in decisions because they lacked medical knowledge. Alternatively, participants who believed patients can and should participate in decisions often mentioned the patient's responsibility to know about their medication and conditions.19 Possibly, educated patients have greater understanding of their medical conditions and treatment options, and so can make more decisions themselves rather than deferring to doctors.
In our study, older patients tended to prefer a physician-directed style of care. This parallels an earlier survey where older doctors were also inclined towards a physician-directed style of care.18 This pattern led Kapp to suggest that many older patients perceive decision-making to be a burden, not a right.20 Thus, older patients may welcome opportunities to share this burden with their doctors, and older doctors may perceive it as their duty to share the decision-making burden with patients.
Poorer health was associated with a stronger preference for a patient-directed style of decision making. This contrasts with Levinson et al.'s finding, where poorer health was associated with greater preference for physician-directed decisions.2 The discrepancy serves as a reminder that what is true for some populations is not necessarily true for others. One speculation about why our results differ from Levinson's is that inpatients are likely to be acutely ill, whereas outpatient samples (surveyed by Levinson) may be more likely to have chronic illness. It is possible that chronic illness may encourage patients to learn to put trust in the decision making of their physicians. Alternatively, or in addition, if patients with acute illness feel a greater immediate threat to their health, they may feel a stronger urge to make consequential health care decisions for themselves. Our results have theoretical plausibility, for other writers have suggested that it is most important for patients to be actively involved in decisions when they are ill.20 21
Our study has limitations. We have no information on patients' religious denominations and consequently, cannot speculate about what particular religious values might account for our findings. The cross-sectional design of this study does not permit causal inferences. In addition, our sample was drawn only from patients at the University of Chicago Medical Center, an urban hospital with a predominantly African-American patient population. As a single-centre survey, the results cannot be readily generalised to other patient populations.
Conclusion
This large single-centre survey affirms that nearly all patients want doctors to offer choices and to solicit the patient's opinion, yet two-thirds of patients ultimately prefer to leave medical decisions to the doctor. Patients have a slight, but statistically significant, increased preference for physician decision-making if they are older, male, less educated, more religious or healthier. These results highlight the importance of talking to each patient about the role he or she would like to play, and re-examining that discussion periodically. Preserving autonomy is important, but patients have many concerns that require consideration.
Acknowledgments
We gratefully acknowledge Andrea Flores, Benjamin Vekhter, and Ainoa Mayo for their help with data cleaning and analysis.
References
Footnotes
The study's contents are solely the responsibility of the authors and do not represent the official views of the funding agencies. GSC and FAC had full access to all the data in the study and take responsibility for the integrity of the data and the accuracy of the data analysis.
Funding Financial support for this work was provided by the Agency for Healthcare Quality and Research through the Hospital Medicine and Economics Center for Education and Research in Therapeutics (CERT) (U18 HS016967-01, Meltzer, PI), a Midcareer Career Development Award from the National Institute of Aging (1K24 AG031326-01, Meltzer, PI) and the Robert Wood Johnson Investigator Program, (RWJF Grant ID 63910 Meltzer, PI). FAC was supported by a career development award from the national Center for Complementary and Alternative Medicine (1K23 AT002749-01A1).
Competing interests None declared.
Ethics approval This study was conducted with the approval of the University of Chicago, Biological Sciences Division Institutional Review Board under Protocol 9967.
Provenance and peer review Not commissioned; externally peer reviewed.
Linked Articles
- The concise argument
- Commentaries
Other content recommended for you
- Autonomy, religion and clinical decisions: findings from a national physician survey
- The impact of healthcare professionals’ personality and religious beliefs on the decisions to forego life sustaining treatments: an observational, multicentre, cross-sectional study in Greek intensive care units
- 2008 Combined Annual Meeting Abstracts
- Bi-directional associations between religious attendance and mental health: findings from a British birth cohort study
- Conscientious refusals to refer: findings from a national physician survey
- Awareness and attitudes towards advance care planning in primary care: role of demographic, socioeconomic and religiosity factors in a cross-sectional Lebanese study
- Conflict and emotional exhaustion in obstetrician-gynaecologists: a national survey
- Autonomy-based criticisms of the patient preference predictor
- The role of religious beliefs in ethics committee consultations for conflict over life-sustaining treatment
- Utilisation of a thoracic oncology database to capture radiological and pathological images for evaluation of response to chemotherapy in patients with malignant pleural mesothelioma