Hip replacements: do public or private providers do better?
BMJ 2020; 368 doi: https://doi.org/10.1136/bmj.m362 (Published 19 February 2020) Cite this as: BMJ 2020;368:m362
- John Appleby, director of research and chief economist
- john.appleby{at}nuffieldtrust.org.uk
Hip replacements are a pretty successful operation, patients think. Nearly 90% who had one and who completed usable patient reported outcome measure (PROM) questionnaires in 2018-19 (around 25 000 questionnaires from around 175 000 eligible procedures) reported an improvement in their general health, for example.1 These operations are, on average, cost effective too.2
But this headline finding conceals variation among hospitals and patients in England.
One measure of health outcomes is the generic EQ-5D, used across a wide range of conditions and settings. (Other measures for outcomes from hip operations include the Oxford hip score.) The EQ-5D questionnaire, completed by patients before and after an operation, records their level of mobility, pain, anxiety or depression, self care, and usual activities. Scores on these individual dimensions can be compressed into a single number by applying weighting (using values for different health states derived from public surveys). This single measure ranges from −0.59 (a state worse than dead), through 0 (dead), and up to 1 (perfect health). (While interpretation of health states equivalent to “dead” or “worse than dead” is somewhat tricky,3 no hip replacement patients in the PROMs data fall into this range.)
While the average health gain (the difference in health status before and after the operation), adjusted for case mix, was 0.46 across all providers of hip replacement or revision for NHS patients in 2018-19, this varied from 0.33 to 0.57 (fig 1).

Gains in health outcomes among NHS patients undergoing a hip replacement or revision, across all providers (2018-19)
Source: NHS Digital1
Even after adjusting for differences in hospitals’ types of patients and their conditions,4 some providers seem to produce better health outcomes on average for patients after hip replacement than others. One group of providers that seem to do better is non-NHS hospitals. Around 30% of the NHS patients included in the PROMs dataset have their hip operations carried out by non-NHS providers but paid for by the NHS. The (hospital level) average health gain among these patients is 0.470, whereas among patients treated by NHS hospitals the gain is 0.456 (fig 2), a small but statistically significant difference. Whether it translates into a meaningful difference in health status is moot.

Non-NHS providers of hip replacements or revisions to NHS-funded patients on average achieve a higher health gain than NHS providers
Source: NHS Digital1
But again, these averages conceal variation within and between public and private providers. Although the spread of performance on health outcomes isn’t exactly even between public and private providers (6% of NHS hospitals but 16% of private providers are in the top 10%, for example), some of the best performing hospitals are public and some of the worst are private, and vice versa (fig 3).
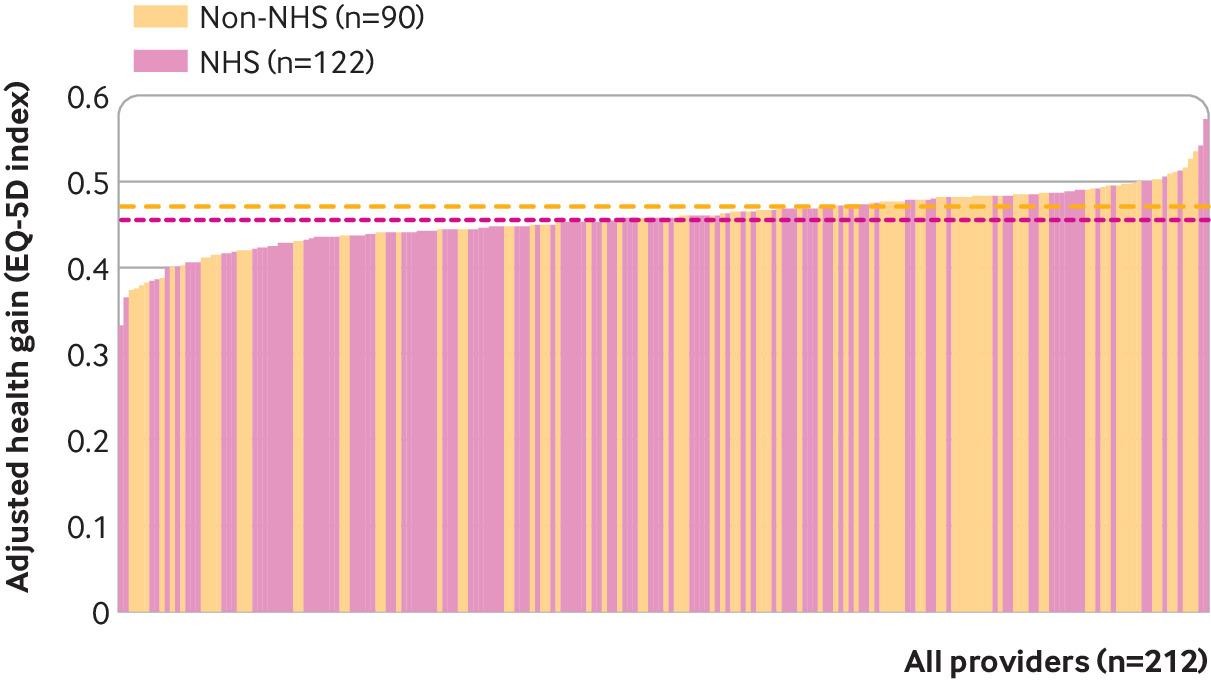
Some NHS providers achieve some of the highest health gains, while some non-NHS providers some of the lowest
Source: NHS Digital1
Despite adjusting for case mix differences between hospitals, differences in average scores between hospitals persist. Using 95% confidence limits around a funnel plot (to take account of the volume of patients that different hospitals treat), NHS Digital estimates that only 26 hospitals (12%) report health outcomes among their hip operation patients that are statistically “better” (n=13) or “worse” (also 13) than the national average health gain (fig 4). Health gains in the remaining 186 hospitals are statistically no different from average, and there is a high chance that the variation among them is a random result.

Among the significantly better providers, NHS hospitals marginally outperformed non-NHS hospitals
Source: NHS Digital1
If we take into account that some differences may be random noise, the picture of public and private performance looks quite different. Now, around 4.1% of NHS hospitals (5/122) and 3.3% of private providers (3/90) are in the top 10% best performers. And it’s 3.3% (4/122) and 5.6% (5/90), respectively, for the bottom 10%. Tightening the confidence limit to 99.8%, five NHS hospitals (and no private providers) are statistically worse than the national average, and just one private provider is better (and no NHS providers).
A broad conclusion would be that there really isn’t much difference between NHS and non-NHS hospitals in health outcomes after hip replacement or revision surgery.
Footnotes
Provenance and peer review: Commissioned; not externally peer reviewed.
Competing interests: I have read and understood the BMJ policy on declaration of interests and have no relevant interests to declare.