Article Text

Statistics from Altmetric.com
The use of statistical process control (SPC) based methods is increasing in health care.1,2 One issue that raises concern is that of overdispersion.3 Overdispersion, which often occurs when sample sizes are very large, is said to occur when the control limits are very close to each other leading to the identification of an “inappropriately” large number of data points signalling special cause variation. Overdispersion is not new to the general SPC literature,4–6 but it has been highlighted recently in healthcare applications of SPC by Spiegelhalter.3
Spiegelhalter explored a number of possible statistical and non-statistical strategies for dealing with overdispersion, favouring on balance a random effects modelling approach. We wish to highlight another approach to handling overdispersion which was developed by Laney.6 We illustrate this approach by using the proportion of emergency readmissions following live discharge data for 2002 from the NHS Performance Ratings dataset.7
In SPC the conventional control chart for handling a time sequence of proportions is the p-chart. Laney showed how to measure and correct for overdispersion in cases where the parameter p (event probability) is not constant but changes over time, thereby resulting in overdispersion. Laney’s solution was the development of a p′-chart6 which supplements the usual computation of binomial sampling variance with an additional component of variance due to the fluctuation in the parameter p over time.
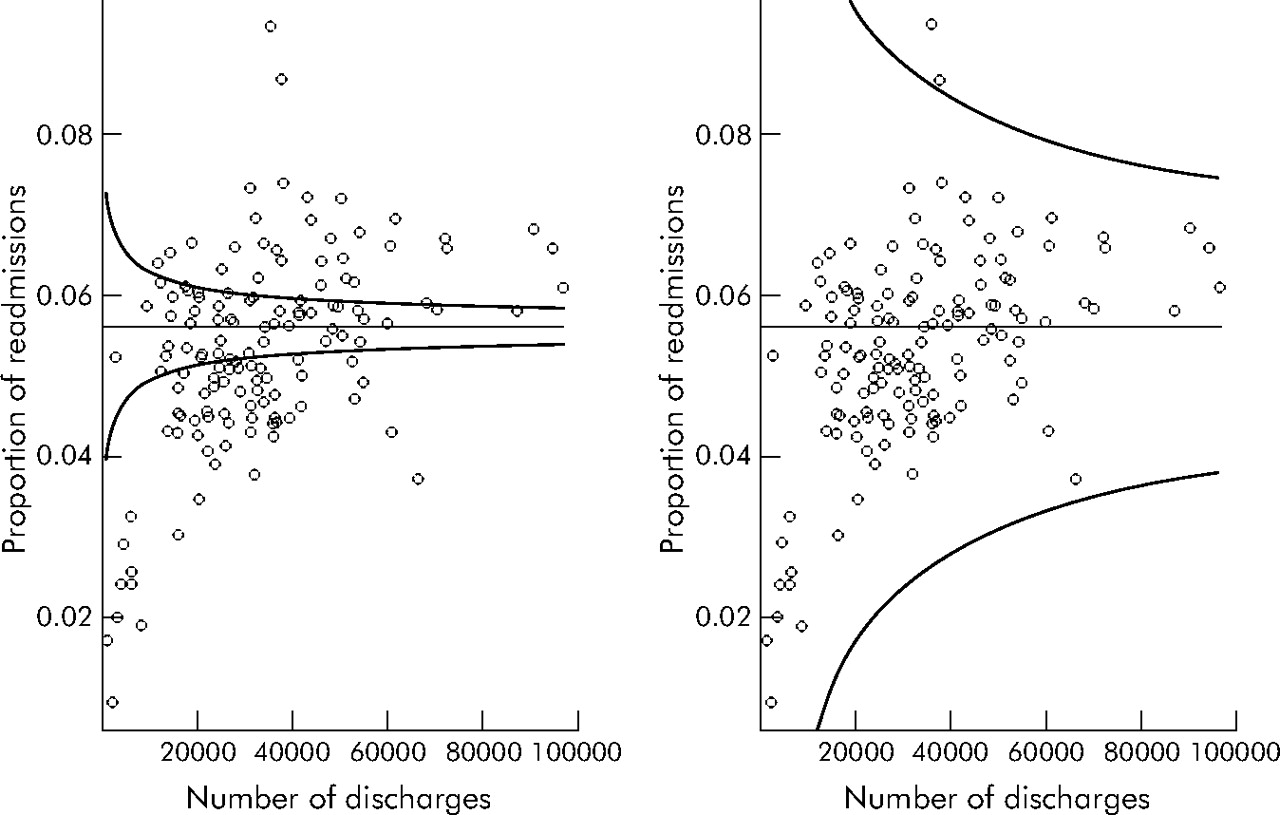
However, Spiegelhalter focused primarily on healthcare performance data which were cross-sectional (that is, not a time sequence).3 Fortunately, there is a variant of the p-chart known as the funnel plot8 which can be used in such cases. Using such a chart, the proportion of readmissions produces the plot shown in the left graph in fig 1 with 3-sigma control limits. There is clear evidence of overdispersion.
Charts showing proportion of readmissions following live discharges from hospitals in the NHS.7 Left panel is a conventional p-chart which shows overdispersion. Right panel is Laney’s p′-chart which corrects for overdispersion.
The difficulty with the conventional (binomial) funnel chart is that it concerns itself only with the variation within hospitals and ignores the variation between hospitals. Application of a similar approach to that used in Laney’s p′-chart provides a simple solution. As in the p′-chart, we can use both sources of variation (within and between hospitals) in deriving the 3-sigma control limits. While Laney’s solution for time sequence data uses the average moving range for the between unit variance, it can be easily modified to the case where there is no time order in the data merely by substituting the classical root mean square variance formula.
We illustrate the derivation of control limits for Laney’s p′-chart using the following notation: pi is the proportion of re-admissions in hospital i, ni is the number of discharges in hospital i, σpi denotes the standard deviation of pi which, assuming a binomial distribution, is given by:

where p̄ is the overall proportion of readmissions and zi is the z score in standard deviations of pi and is given by zi = (pi −p̄)/ σp, and σz is the standard deviation of z which, for time ordered data, is derived by using the moving range approach (as described in standard SPC texts).9 However, in this case where there is no time order to the data, σz may be determined using the classical standard deviation formula based on the root mean square of the deviances:

where N is the sum of ni and p̄± is the mean of zi.
The 3-sigma control limits for Laney’s p′-chart are thus given by z̄3 σpi σz, thereby accounting for within and between hospital variations. The resulting 3-sigma control limits are shown in the right panel of fig 1 and appear to “correct” for the overdispersion.
There are number of issues relating to Laney’s p′-charts.6 In the absence of overdispersion, σz will be close to 1, so the limits produced by a conventional p-chart and Laney’s p′-charts will be similar. Their routine use therefore appears to be without obvious adverse consequences. [Note: In time sequence applications, σz can take on values less than 1 if there is positive serial correlation in the data. Since no such condition exists for cross-sectional data, σz should have a minimum value of 1 in such applications.] Although we have illustrated Laney’s p′-chart using binomial data, Laney’s method easily extends to the Poisson case6 (known as the u-chart in SPC terminology). Furthermore, Laney’s p′-chart dovetails elegantly with traditional SPC approaches, perhaps making it more straightforward to implement by those familiar with traditional SPC methods.
As Spiegelhalter3 has described, there may be several statistical approaches to dealing with overdispersion. While it may be reasonable to undertake desktop comparisons of these different statistical approaches by using existing or simulated data sets, we need to recognise that the ultimate evidence as to the effectiveness (including costs) or otherwise of different methods can only be determined empirically. Finally, we caution against the desktop adjustment of data without scientific investigations into the “causes” of overdispersion, recalling that the basic aim of SPC is to support continual improvement and not the construction of optimum statistical models.
Linked Articles
- Correction