Article Text

Statistics from Altmetric.com
Low-value healthcare has been defined as care that is inappropriate for a specific clinical indication, inappropriate for a clinical indication in a specific population or an excessive frequency of services relative to expected benefit.1 Quantifying the prevalence of low-value healthcare informs clinicians and health policy makers on the use and associations of unwarranted care.2 In this Viewpoint, we clarify the approaches used in the literature for measuring and reporting the level of low-value care in a given population. Categorising low-value service measures depends on the denominator used. Future analyses should consider using all types of measures when possible, or explain why it is not practical or desirable to do so, and at the very least describe for the reader which measure has been used, as this can dramatically impact interpretation of the results.
Low-value care: listed and (variably) measured
Defining, quantifying and reducing low-value healthcare are important co-dependent issues with an increasing focus in the literature.3 4 Lists or guidelines defining low-value services for given patient populations are now mushrooming.5 Choosing Wisely, for example, is a prominent international movement promoting lists of recommendations on low-value services that offer no or very limited benefit to patients under specific circumstances.6 Interventions targeting the reduction of low-value or no-value care offer the dual benefit of improving safety and quality and making inroads into escalating healthcare expenditure.7
Playing catch-up to list generation (particularly outside of the USA) is the measurement movement; work that quantifies the proportion, characteristics and trends in low-value care.3 8 9 It is curious that low-value lists abound, yet the world over we have but a cursory understanding of the scale and scope of low-value care due to the general lack of measurement.3 Not surprisingly then, a growing number of population-based measurement studies are surfacing through the rubric of low-value care.
Historically, measures of geographical variation in service utilisation have given insight into possible underuse or overuse of healthcare.10 These give indirect results, however, as the indications of a service are not generally included in the measure and unwarranted variation is not distinguishable from warranted variation between regions.8 The focus of this paper relates to the increasing number of studies using direct measurement: a targeted approach using patient-level data with service and diagnoses information to ascertain the low-value application of a service.3 5 That is, ‘low-value’ is viewed through a binary lens: if the patient characteristics do not match the indication for a service, then it is counted as a low-value service. This intersection of service and patient indication is illustrated in figure 1.

In direct measurement studies, an indicator of low-value care is based on the service definition and patient indication (1). Proportions of low-value care can be reported as either out of all cases where the patient had the low-value indication (2), out of all cases where the service was used (3), or out of a broader population (patients with the low-value indication) (4).
The concept in figure 1 can be applied to patient-level data sets where it is possible to distinguish those patients with the low-value service indication, and those that received the service of interest. For a direct measure to be valid, this inappropriate patient indication must be apparent and unambiguous in the data. Meeting this condition depends on the details available within the data set as well as the low-value service description. Given this condition has been met the numerator of the measure (segment (1) in figure 1) will be clear, and thus three possible denominators could apply.
Patient and service type measures of low-value care
In a recent review of low-value care measurement around the world, we set a task to synthesise the published literature on direct measurement of low-value services in routinely collected health data.3 During this process we uncovered an unreported distinction; when directly measuring the extent of low-value care, multiple denominators can be used. Whichever is chosen alters the lens through which to interpret the findings: (A) the patients receiving low-value services, and (B) how many services used are low-value. We also found few of the same low-value services have been measured across multiple studies and different populations or settings. Even fewer have been measured using the same denominator, thus making many of the results incomparable. This has very real implications for the extensive audiences of this work, including clinicians, researchers and policy/payer stakeholders, in that they cannot always make comparisons for the same low-value services and thus one cannot, in fact, compare apples and oranges.
One common type of result reported gives the proportion of a patient population receiving the low-value service. Two possible measures exist: one with a denominator including patients with a specific indication only (patient-indication), and the other with the entire cohort (patient-population). Patient-indication measures have a denominator including only patients that had the potential to receive the service. For example, a cohort of patients with osteoarthritis with a knee arthroscopy rate of 4% is a patient-indication measure since only patients with osteoarthritis are included in the denominator.11 A patient-population measure denominator includes the entire cohort, such as the result reported by Schwartz, et al, 12 where the percentage of all Medicare beneficiaries with both a knee arthroscopy and osteoarthritis diagnosis was 0.2%.
Where the patient measures focus on the patient populations receiving the low-value service, a service measure focuses on the proportion of services that were low-value. The percentage of all arthroscopies performed on patients with an osteoarthritis diagnosis is a service measure (57.2%, as reported in Bohensky, et al).13
Table 1 details the descriptions and comparisons of the types of results we found within the low-value care measurement literature, along with an example service quantified across all three measures.14
Measuring low-value care according to two lenses ((A) patient and (B) service) and three measures using a case example from Scott et al 14
Considerations for different measures and reporting
This classification of measures has not been discussed overtly in the literature to date. The quintessential, pragmatic research approach has likely been to investigate a specific research question without considering the lens through which low-value care can be measured. It may be appropriate and sufficient for an investigator to report rates of services per a patient group if they were only interested in the treatment patterns for one group or another (eg, patients newly diagnosed who received a procedure vs an entire Medicare population). It is possible however, depending on the defined low-value service and available data, to report the inverse as well: what proportion of a specific service was used on non-indicated patients. Both are valid, but have different implications for the message and actions that might follow. We propose that future low-value measurement studies consider reporting all measures, and state explicitly their decision to use or exclude any.
This consideration is necessary because each type of measure has its own interpretation, and the full picture of low-value practice might require more than one measure. A service measure gives insight into how many services are futilely used on patients, but gives no information on the proportion of patients receiving the service inappropriately out of the patients in a given cohort. For example, the reported level of inappropriate services used might be very low if they are beneficial for a wide range of patients, but patients that won’t benefit from the service might be receiving it at unfavourably high rates. Sheffield et al 15 reported 23% of colonoscopies were potentially low-value, (a service measure), while Goodwin et al 16 reported 46.2% of patients that were unlikely to benefit from a repeated colonoscopy received one (a patient-indication measure). Figure 2 provides further examples of how the measurement lens chosen can impact reporting and interpretation of low-value care prevalence.

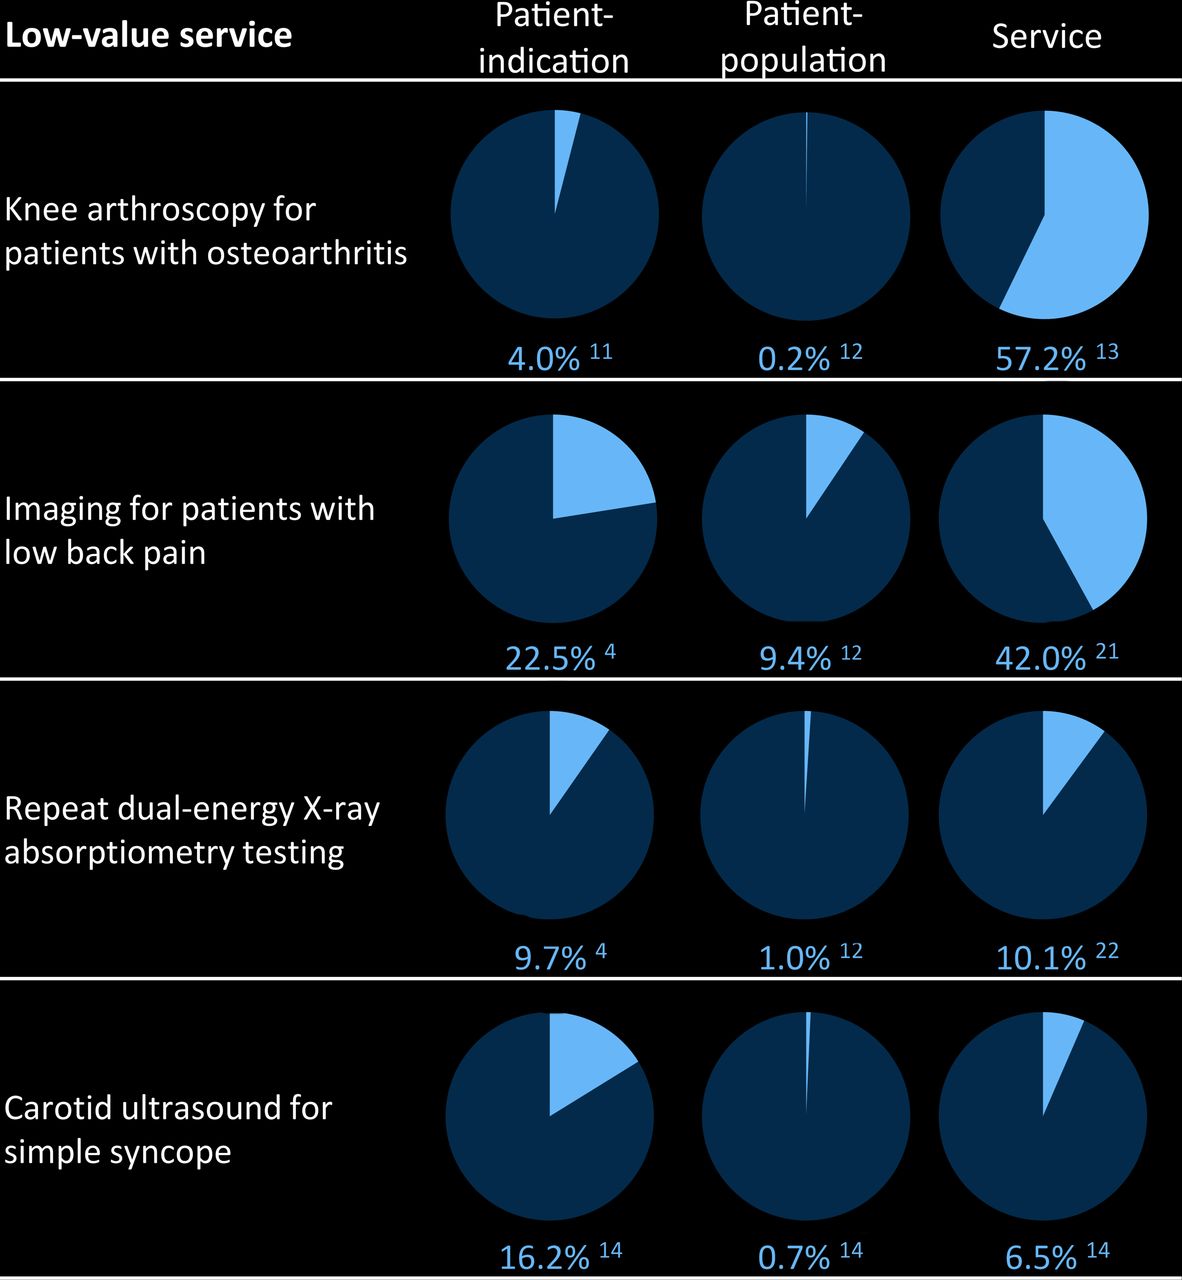
Results from various direct measurement studies of low-value service use from all denominator types. Shaded area indicates the proportion of low-value service use.
The next reason is that the usefulness of different measures can increase when considering predictors of low-value care. For example, Ganduglia et al 17 compared imaging for low back pain across different payers in Texas, and found ‘the percentage of patients with low back pain who underwent lumbar MR imaging [a patient-indication measure] was similar across payers … [yet] the proportion of MR imaging examinations performed without prior evidence of conservative therapy [a service measure] was consistently about 20% higher for the [commercially insured] population relative to the Medicare population.’ While the burden of low-value care is the same across both payers using the patient-indication measure, the proportion of services funded by commercial insurance that was low-value was higher than the proportion funded through Medicare (from the service measure).
Another reason, which builds on this MRI example, is that various audiences may appreciate a specific type of measure more or at least have a different use for them. The proportion of patients receiving inappropriate care (that is, the patient-indication measure) is perhaps more pertinent to a clinical audience as it describes the decisions made regarding patient treatment, given the patient indication(s). Levers to reduce this measure can be aimed at patient treatment guidelines and clinical pathways. The patient-population measure is necessary for cross-service comparisons of low-value services based on volume of patients affected. Meanwhile, the service-centric measure considers the proportion of services used ineffectually; it will appeal to a ‘service-provisioning’ or ‘resource-allocating’ minded audience given it highlights resource allocations lost to low-value care utilisation.
Measured viewpoints within the literature
Our review of a selection of 40 published papers suggests that few direct measurement studies present results from all perspectives.3 We have included our synthesis of the results from this review in the online supplementary table to detail the type of denominator selected. There were 74 unique healthcare services measured, with 61 results using the patient-indication measure, 30 using the patient-population measure and 14 using the service measure. Most of the published results use a patient measure, presumably because the aim of these studies was to evaluate the proportion of patients receiving low-value care.
Supplementary file 1
Low-value care measurement is still a growing field, so our ‘retrospectoscope’ has identified this issue early. Reporting results from both viewpoints might be restricted by the type of data available. Hospitalisation data, for example, will only give details for the services provisioned, and not the complete population that could have received a low-value service (since the patients without a service wouldn’t have been admitted). When possible, however, we recommend researchers report using both lenses and all three measures, to describe the full picture of low-value care practice, and to allow pre-evaluation and post-evaluation of interventions as well as cross-jurisdictional and time comparisons across studies for the same measured low-value services.
References
Footnotes
Contributors KC prepared the original draft and review (details of the review are in the supplementary appendix), and S-AP and AE contributed to concept design, articulation and final submission. KC is the guarantor of the article.
Competing interests KC receives personal fees from the Capital Markets Cooperative Research Centre and the Australian Federal Government via an Australian Postgraduate Award, and The University of Sydney; AGE receives salary support as the HCF Research Foundation Professorial Research Fellow, receives consulting sitting fees from Cancer Australia, the Capital Markets Cooperative Research Centre-Health Quality Program, NPS MedicineWise (facilitator of Choosing Wisely Australia), The Royal Australasian College of Physicians (facilitator of the EVOLVE programme) and the Australian Commission on Safety and Quality in Health Care; SAP is a member of the Drug Utilization Sub-Committee of the Pharmaceutical Benefits Advisory Committee (PBAC) and receives consulting fees from NPS MedicineWise.
Provenance and peer review Not commissioned; externally peer reviewed.