Article Text

Abstract
Background Patient-reported outcome measures (PROM) might be better for comparing consultant surgeons' outcomes than mortality.
Objectives To describe variation in outcomes between consultants, compare the number of outlying consultants according to different measures, explore the effect that the hospital in which a consultant works has on their outcomes and determine the scope for improving outcomes by reducing variation between consultants.
Method Consultants performing hip replacement (n=948), knee replacement (1130) and hernia repair (974) in National Health Service hospitals in England in 2009–2012; disease-specific and generic PROMs and complications; fixed-effects and multilevel models to assess consultant outcomes, were all compared. Influence of patient factors and hospital factors was assessed.
Results Fixed-effects models showed that most consultants are ‘as or better than expected’. However, unlike with mortality, some consultants are more than three SDs ‘worse than expected’ according to disease-specific PROMs (2.4% for hip and 1.2% for knee replacement), generic PROMs (1.2% and 1.0%) and incidence of complications (1.8% and 0.8%). The proportion of consultants worse than expected is less with random-effects models. Controlling for hospital factors reduced the proportion further. After controlling for known patient characteristics, consultants and hospitals contribute little towards variation in patient outcomes.
Conclusions PROMs offer a more appropriate and sensitive method for comparing consultants’ outcomes. The influence of hospitals must be considered to ensure comparisons are meaningful. Improvements will be achieved by shifting the distribution of consultants rather than by reducing variation between them.
- Surgery
- Quality measurement
- Comparative effectiveness research
- Health services research
Statistics from Altmetric.com
Introduction
In 2013, public reporting of the outcomes of individual consultant surgeons in England was introduced.1 Information on outcomes was mostly limited to postoperative mortality, the measure already in use in cardiac surgery in the UK2 and the USA.3 The aims were to stimulate improvement in the quality of care among those found to be ‘worse than expected’ by encouraging them and their managers to redesign their services and by allowing patients to make informed choices when selecting a consultant. However, despite such worthy intentions, the approach was limited for three reasons. First, as the outcome is rare, it is unlikely that a poorly performing consultant would be detected.4 For example, the 90-day mortality following hip replacement in 2011 was 0.3%,5 and for knee replacement averaged 0.4% between 2003 and 2013.6 These low proportions meant that a consultant’s work over the preceding 10 years had to be considered, undermining the relevance of the assessment for a patient wanting information on the current outcomes a consultant was achieving. As could have been predicted, the approach did not identify any consultants as worse than expected (defined as more than three SDs below the mean)6 with the risk that the whole exercise might have engendered a false sense of complacency.
The second limitation was that the analysis treated the outcomes of consultants as fixed effects, so it was not possible to investigate the hierarchical nature of the data and consider that variation in consultants’ outcomes might have been due to variation in hospitals’ performance. And third, postoperative mortality is a measure of safety and provides no indication of how effective surgery is in improving patients’ health status and health-related quality of life (HRQL). Given that most elective surgery is carried out to reduce patients' symptoms, improve functioning and enhance quality of life, these are the appropriate outcome measures to use.
Whereas in the past, routine data on these aspects were not available, accurate data are starting to be collected in England through the routine use of patient-reported outcome measures (PROM). These have the advantages of providing a continuous variable (rather than the dichotomy of dead or alive) and of ensuring the outcomes of all patients contribute to the determination of a consultant’s outcome. Additionally, in England, patients also report on the occurrence of common complications, providing a measure of safety that overcomes some of the statistical problems encountered with the rarity of postoperative death.
Thus, the availability of the National PROMs Programme in England since 2009 provides a means of investigating the potential of PROMs for comparing consultants’ outcomes.7 To date, use of such data has been restricted to comparing hospitals.8 This is despite evidence that patients wish to be able to choose their surgeon rather than just their hospital,9 plus the wish of politicians for public information on the outcomes of individual surgeons.
Our aim was to explore the use of PROMs as an indicator of consultants’ outcomes. Our objectives were to: describe the extent of variation in outcomes between consultants; compare the number of outlying consultants according to different outcomes; explore the effect that the hospital in which a consultant works has on their outcomes and determine the scope for improving outcomes by reducing variation between consultants.
Methods
Data
We conducted a secondary analysis of existing routine data. All patients undergoing one of three procedures (hip replacement, knee replacement, groin hernia repair) between April 2009 and March 2012 were invited to complete a preoperative questionnaire which included PROMs. (The data for varicose vein surgery was not considered to be of sufficient quality to use in this analysis). Follow-up questionnaires mailed to patients 3 months (hernia repair) or 6 months (hip and knee replacement) after surgery included the same PROMs and a question about the occurrence of four common complications (wound problems; urinary problems; allergy or reaction to drug; bleeding).
Completed questionnaires were linked by the Health and Social Care Information Centre, to the patient's episode in the hospital administrative database—Hospital Episode Statistics (HES). This provided information on the patient's ethnicity and enabled us to assign their socioeconomic status (derived from their postcode and based on the Index of Multiple Deprivation (IMD) using 2007 rankings).10 Additionally, HES identified the patient's consultant and the hospital where the operation was performed.
The effectiveness of hip and knee replacement was assessed using a disease-specific PROM—the Oxford Hip Score (OHS)11 and the Oxford Knee Score (OKS).12 Both include 12 items, each scored from 0 to 4 and summated to provide an overall score of between 0 (severe symptoms and disability) and 48 (no problem). There was no disease-specific PROM available for hernia repair. All three procedures were also assessed using a generic PROM, the EQ-5D-3L which assesses five dimensions of health (mobility, self-care, daily activities, pain and anxiety/depression).13 Each question has three levels of response, and answers are transformed into an HRQL score using material from the UK-Time Trade-Off value set.14 Scores range from −0.59 (worse than death), through 0.00 (dead) to 1.00 (perfect health). Finally, the safety of all three procedures was assessed as the proportion of patients reporting at least one of four common complications. Analysing each complication separately would have been less likely to detect an outlier.
Inclusion criteria for hospitals and consultants
Analyses were based on National Health Service (NHS)-funded patients treated by NHS providers (hospitals and treatment centres). Independent (private) hospitals and independent sector treatment centres were excluded. NHS providers were included if over the 3 years there were PROMs data for 40 or more patients. The consultants working in the included providers were included if data were available for at least 10 patients who they were clinically responsible for (though they may not have been the operating surgeon). The adoption of these thresholds represented a pragmatic balance between needing to exclude those for whom the amount of data was too small to be representative while excluding as few as possible. The numbers of hospitals and consultants who met the inclusion criteria are shown in table 1.
Number of hospitals and consultants meeting inclusion criteria for each procedure; and number of patients completing preoperative (Pre-op) and postoperative (Post-op) patient-reported outcome measures (PROM) (2009–2012)
Extent of variation in outcomes between consultants: fixed-effects model
We adjusted for patients’ age, sex, socioeconomic status (as quintiles of the IMD), self-reported comorbidities (heart disease; hypertension; stroke; claudication; lung disease; diabetes; kidney disease; neurological diseases; liver disease; cancer; depression), having had previous surgery on the same hip or knee (for those operations), and preoperative PROM scores. The last of these is known to be the most predictive factor.15 We used multivariable linear regression for the continuous measures and logistic regression for the binary outcome measure of complications. Preoperative PROM scores were modelled as linear plus quadratic terms to allow for non-linearity in their relationship with the outcome.
A measure of each consultant's case-mix adjusted outcome was then estimated: for the continuous measure, this was the overall mean score plus the consultant's mean residual score (actual minus predicted mean score); for the binary outcome measures, this was the overall proportion multiplied by the provider's ratio of their actual to their predicted proportion.16 Outliers were defined as more than three SDs from the mean score. Consultants were compared for three outcomes: case-mix adjusted postoperative PROM score (disease-specific and generic) and the proportion of patients reporting a complication.
Effect of the hospital on consultants’ outcomes: random-effects model
Multilevel modelling, adjusting for hospital and patient differences, is akin to comparing consultants as if they were working in the same hospital and operating on the same type of patient. Hence, any difference in the outcome can be fairly attributed to the consultant.
To consider the impact of a hospital on patients’ outcomes independent of that of a consultant, we used a random-effects model which has better reliability than a fixed-effects model to detect true quality differences.17 Hospital factors that might have an impact include staffing levels, nursing skills, pharmaceutical use and length of stay. However, no such covariates were fitted at the hospital or consultant levels in the present study as no data were available.
To enhance the ability of the analysis to detect any impact hospitals might have on consultants’ outcomes (given that wider CIs are to be expected with random-effects models), consultants were deemed to be outliers if they were more than two SDs (rather than three SDs) from the mean. First, the proportions of outliers, controlling only for patient variation, were derived and compared with the proportions derived from the fixed-effects model. Then, hospital variation was introduced and controlled for. The CI for consultant performance was calculated by adding the consultant level residual to ±2 SEs of the residual.
To consider the relationship between consultant and hospital outcome, estimates for consultant outcome were derived from a two-level model with patients and consultants. Estimates for hospital outcome were derived from a two-level model with patients and hospitals. Estimates for consultant outcome after controlling for hospital effects were derived from a three-level model with patients, consultants and hospitals.
Assess the determinants of residual variation between consultants
To determine the contributions of consultants and hospitals to variation in patients’ outcomes after adjusting for case-mix, progressively complex multilevel models (using iterative generalised least square estimation) with disease-specific and generic PROMs scores as the outcome variables were run. The likelihood ratio test was performed to determine the best model that fitted the national data. One model had a random intercept for consultants; a second model had random intercepts for hospitals and consultants. The best fitting model showed variation at the level of the hospital and consultant for hip and knee replacement and at the level of hospital for hernia repair.
For patient-reported complications, progressively complex logit multilevel models (using Markov's Chain Monte Carlo Method) were performed with the binary outcome. Model fit was assessed using the deviance information criterion. The best fitting model for all three procedures was one with a random intercept at the level of hospital and consultant. Partitioning of variance was calculated using the linear threshold representation where the patient-level residuals follow a logistic distribution with a constant variance of 3.29.
All analyses were performed using STATA V.11.18 Multilevel modelling was performed using RunMLwin (University of Bristol) which allows RunMLWin to run within STATA.19
Results
Comparison of consultants’ outcomes
The fixed-effects model revealed the extent to which consultants’ outcomes varied (table 2). The proportions of ‘good’ outliers (more than 3 SDs above average) and ‘bad’ outliers (more than 3 SDs below average) according to the disease-specific PROMs were both greater than would be expected by chance (0.1% above and 0.1% below average) for hip and knee replacement. For example, of the 948 consultants performing hip replacement, 10 (1.1%) had adjusted postoperative OHS that were more than three SDs ‘better than expected’, and for 23 (2.4%) were worse than expected. There were fewer outliers detected using the EQ-5D, though still more than would be expected by chance for hip and knee replacements. For hernia repair, there were no more outliers than expected by chance.
Proportions of consultants with mean outcomes more than three SDs different than expected
Effect of the hospital on consultants’ outcomes
The impact of using a random-effects (controlling only for patient variation) model rather than fixed-effects model was, as expected, a reduction in the proportion of consultants deemed to be outliers. For this reason, we defined outliers as two SDs away from the mean, to increase sensitivity (table 3). For hip replacement, the proportion (better and worse than expected combined) according to the disease-specific PROM was 9.7% with the random-effects model compared with 13.5% with the fixed-effects model, and with the EQ-5D it was 5.1% compared with 10.6% (table 3). A similar pattern was seen with knee replacement and hernia repair. For all procedures there were still more ‘outliers’ than would be expected by chance.
Proportions of consultants with mean outcomes more than two SDs different than average
Controlling for hospital variation led to fewer consultants being deemed outliers. For hip replacement, only 22 (2.3%) consultants were still outliers according to the disease-specific PROM (fewer than the 5% expected by chance) and 8 (0.8%) according to the EQ-5D. A similar pattern was seen with knee replacement. For hernia repair, given that no consultant was more than two SDs from the mean after controlling for patient variation, controlling for hospital could have no impact.
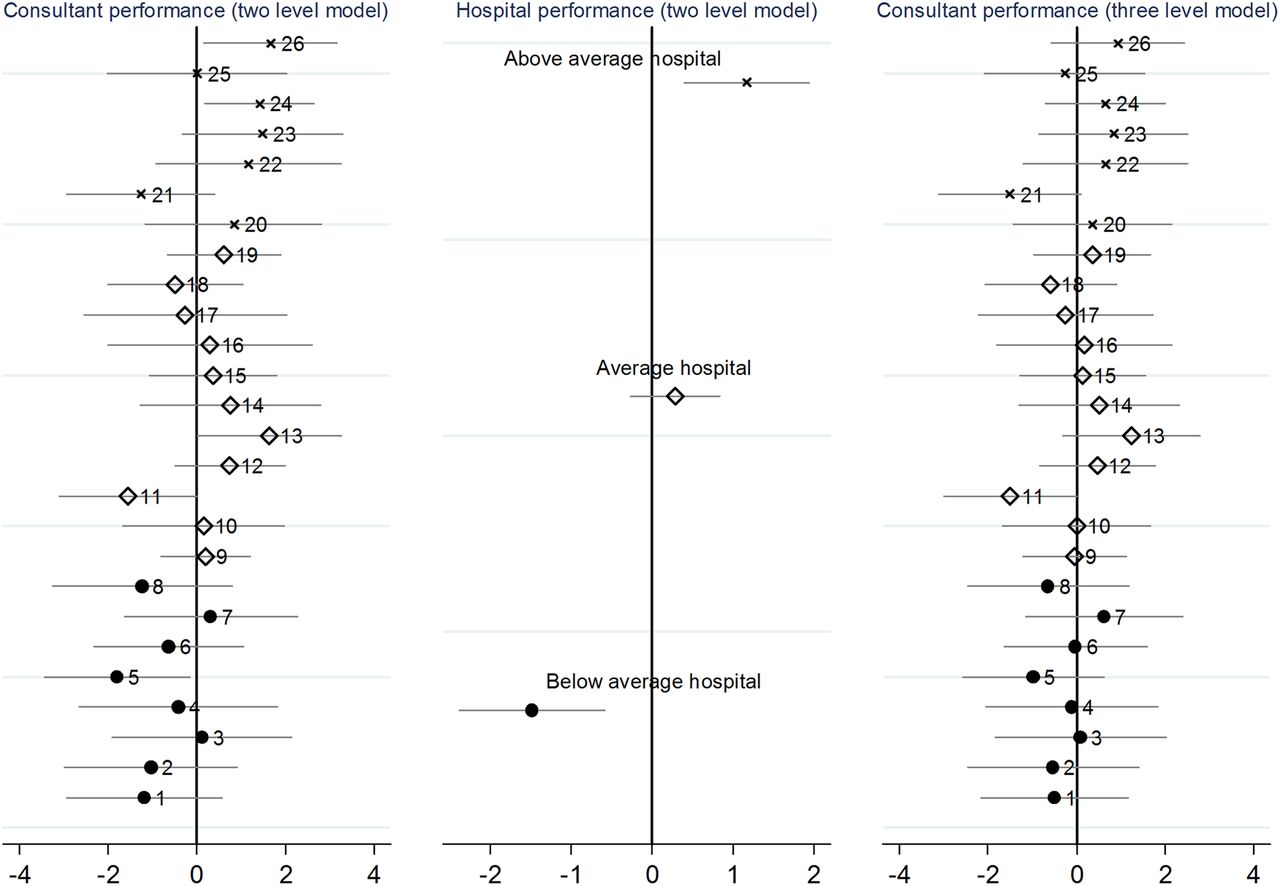
One way of observing the influence of a hospital on a consultant's outcomes is to consider three situations: hospitals categorised as below average, average and above average. In figure 1, consultant and hospital outcomes are indicated by the residual in the random-effects models, that is, the extent to which outcome is explained by the consultant or hospital. The central panel shows the outcome of hip replacement according to case-mix adjusted postoperative disease-specific PROM (OHS) for three contrasting hospitals. These data reflect the influence both of consultants and hospital factors. The left-hand panel shows the outcomes for the consultants working in each hospital: consultants 1–8 work in a below average hospital (•), 10–19 work in an average hospital (◊) and 20–26 work in an above average hospital (×). The right-hand panel shows the consultants’ outcomes after the effect of the hospital is taken into account. For example, in the below average hospital, none of the eight consultants are outliers according to the three-level model (right-hand panel), suggesting that the poor patient outcomes arise from hospital factors rather than below average consultants.

Influence of hospital factors on consultants’ outcomes for hip replacement (postoperative Oxford Hip Score): examples of an above average hospital (with seven consultants); average hospital (11 consultants) and below average hospital (eight consultants).
By contrast, consultant 13 who is above average (left-hand panel) is working in an average hospital. After adjusting for hospital effects, he appears to be only average (right-hand panel) suggesting his outcome is dragged down by hospital factors. The converse can also occur: consultant 5 is below average (left-hand panel), but after adjusting for hospital effects he appears to be only average, suggesting that his below average outcome was partly the result of hospital rather than personal factors.
Of those considered better than expected in the three-level model, some may be missed and appear ‘as expected’ with the two-level model. For example, this was true for one of the seven consultants better than expected for hip replacement using OHS in the three-level model.
Determinants of residual variation between consultants
To address the scope for improvement in outcomes that might be possible, the proportion of the residual variation for the three procedures using the disease-specific PROM for hip and knee replacement (OHS and OKS, respectively), and the EQ-5D score for hernia repair were considered (table 4). Almost all the residual variation (eg, 97% for hip replacement) is attributable to patient characteristics that are either not adequately accounted for by the risk adjustment model or have not been measured and included in the model. Very little of the variation can be attributed to characteristics of the consultant or hospital (eg, for hip replacement 1.6% and 1.0%, respectively). The same was true for all three procedures and for the rates of complications.
Variance (SE) and proportion of variance in consultants’ outcomes attributable to the hospital, consultant and patient
Discussion
Main findings
Unlike comparisons based on 90-day postoperative mortality, use of patients’ reports of postoperative symptoms, functional status, quality of life and incidence of complications reveals significant variation between consultants’ outcomes. When comparing the three available outcome measures, the proportion of consultants deemed worse than expected is higher according to disease-specific PROMs than when generic PROMs or the incidence of complications are considered.
When random-effects models are used instead of fixed effects, the number of worse than expected consultants decreases (eg, 40 instead of 75 for hip replacement according to the disease-specific PROM), but is still greater than would be expected by chance. The smaller number is not surprising as random-effects models are conservative in identifying outliers compared with fixed-effects models. This has previously been shown in comparisons of hospital mortality following cardiac surgery20 and acute myocardial infarction.21 This raises the issue of which type of model is more appropriate for quality improvement purposes. Fixed-effects approaches have greater sensitivity (ie, more likely to detect true outliers) but lower specificity (ie, more likely to incorrectly classify consultants as outliers). Random-effects approaches have lower sensitivity but higher specificity; so the choice depends on whether sensitivity or specificity is of greater policy importance.
When variation at the hospital level is taken into account, in addition to patient variation, the number of outlier consultants decreases further and is no longer more than might be expected by chance, for example, only 15 of the 40 consultants remain worse than expected for hip replacement, according to the disease-specific PROM, and only five out of 28 for knee replacement. This suggests that the majority of consultants who appear to be worse than expected are being disadvantaged by practicing in a hospital with poor outcomes. Efforts at quality improvement directed at consultants in such situations are, therefore, unlikely to improve outcomes.
The lack of scope for improvement was also evident when explanations for residual variation were explored. This showed that apart from that due to chance, characteristics of consultants and hospitals explained very little for all three procedures.
Limitations of the study
There are several potential limitations to consider. First, despite including a large number of hospitals, consultants and patients, we confined the sample to NHS-funded patients who underwent surgery in NHS hospitals and treatment centres. We excluded NHS-funded patients treated by private providers and privately funded patients. Excluded patients may have been at lower risk of a poor outcome: those treated in independent sector treatment centres are deliberately selected on this basis, and those paying privately are more likely to be of higher socioeconomic status enjoying access to better postoperative rehabilitation. However, these exclusions will only have narrowed the range of data values and not affected the internal validity of the analyses.
Second, we excluded hospitals if there were fewer than 40 patients with completed PROMs data linked to HES (resulting in excluding 52 (22%) hospitals for hip replacement; 48 (20%) for knee replacement; 97 (33%) for hernia repair). These included low-volume providers (in the case of hernia repair), poor recruitment of patients to the PROMs programme, poor postoperative response rates and failure to link the PROMs data to the appropriate HES episode. Exclusions might have led to a slight underestimation of the proportion of outliers, as those excluded are more likely to have worse outcomes.22–24
Third, within the participating hospitals, not all eligible patients were included as some did not complete a preoperative questionnaire (22% of hip replacements, 19% of knee replacements and 46% of hernia repair patients),25 some did not complete a postoperative questionnaire (15% hip and knee replacement, 27% hernia repair),26 and some could not be linked to their HES record (linkage bias). However, this will not have biased the results, as patient characteristics known to be associated with lower recruitment or response (older, sicker, non-Caucasian and more socially deprived patients) were adjusted for in the analyses. However, the possibility of unknown confounders remains (ie, patients with worse outcomes being less likely to complete postoperative questionnaires) though the extent of any bias is likely to be slight and not have affected the internal validity of the analyses.27
Fourth, as with any risk adjustment model, it does not take every conceivable risk factor into account. For example, patients undergoing hip replacement will not gain as much benefit from surgery if they also have osteoarthrosis of their knees or of the other hip joint. Our analysis assumes the prevalence of such patients is evenly distributed across consultants.
Fifth, some consultants work in more than one hospital, whereas the multilevel models assumed a hierarchy of patients nested in consultants nested in hospitals. To explore this, cross-classified models were created, but they did not give a better fit to the data compared with three-level hierarchical models. Hence, we used the latter, more parsimonious, models for our analysis.
Sixth, the measures of outcome used inevitably have limitations in their measurement properties. These are not thought to be serious. Criticisms that the OHS and OKS display a ceiling effect is to ignore the fact that many patients do indeed achieve perfect hip or knee function following surgery, so will be expected to reach the top of the scale. Concerns about the sensitivity of the EQ-5D are also misplaced as scores correlate highly with disease-specific scales.28
Finally, we attributed patients to the consultant who was responsible for their clinical management. In some cases, the operation will have been performed by surgeons working under the consultant. Consultant-level analyses, therefore, reflect the outcomes of all the patients for whom the consultant is responsible and is not restricted to those he or she operated on.
Implications
This is the first attempt to use PROMs data to compare consultants’ outcomes on a national scale. All previous reports have been limited to a measure of safety (postoperative mortality) which, given the rarity of death, did not identify any outliers in orthopaedic surgery. The use of PROMs has three advantages over the 90-day mortality rate: it provides information on effectiveness in terms of the principal objectives of reducing disability and increasing HRQL; it is a more sensitive measure, suggesting that there are some outliers, although very small proportions; and it requires data only on clinical practice of 3 years rather than that of 10 years. Thus, PROMs appear to be a better indicator than postoperative mortality for comparing consultants and should be considered as a better alternative.
Second, multilevel models should be used to assess consultants as it is important to distinguish between consultants’ and hospitals’ contributions to differences in patients’ outcomes. Consultants classified as ‘worse than expected’ might be disadvantaged if they are working in a poorly performing hospital. Controlling for hospital effects may allow a fairer assessment of their outcome though this in some ways ignores the complex interactions between consultants and hospitals.
The third implication arises from the finding that hospital and consultant factors explain very little of the residual variation after adjustment for patient case-mix. Given that most of the residual variation is attributable to chance or to unmeasured or inadequately measured patient factors, this suggests that there is little opportunity to reduce variation between consultants through quality improvement initiatives (such as additional training). If there is scope for improvements in outcome it will be achieved by shifting the whole distribution of consultants rather than by reducing variation between them.
Finally, two notes of caution are needed. (1) These results may not be generalisable to other elective operations, let alone non-elective reasons for admission to hospital. The relative lack of variation in outcomes between consultants seen for these surgical operations may reflect the success of the long-established policy in the NHS to ensure a similar level of satisfactory care across the whole country. (2) Just because these quantitative measures of consultant outcomes failed to show much potential scope for improvement, it does not mean that there are no modifiable factors that might be detected using qualitative methods.29
Acknowledgments
We thank Christopher Charlton of University of Bristol for providing support for RunMLWin and three reviewers for helpful comments.
References
Footnotes
-
Contributors All three authors contributed to the planning, conduct and reporting of the work described in the article. NB conceived the idea; MV undertook the analyses, supervised by AH; NB drafted the paper and MV and AH commented and contributed to revising it. NB acts as guarantor.
-
Competing interests None.
-
Provenance and peer review Not commissioned; internally peer reviewed.
-
Transparency declaration NB affirms that the manuscript is an honest, accurate and transparent account of the study being reported, that no important aspects of the study have been omitted and that any discrepancies from the study as planned (and, if relevant, registered) have been explained.